THE IMPACTS OF WINTER MAINTENANCE EQUIPMENT ON
VEHICLE DELAY ON INTERSTATES
William A. Holik1, Mallory Crow2, William H. Schneider IV3, Christopher M. Miller4
1, 2, 3, 4 The University of Akron, Department of Civil Engineering, Auburn Science and Engineering Center, Room
210, Akron, OH 44325-3905, United States of America Received 9 December 2014; accepted 29 July 2015
Abstract: This paper evaluates the impacts of specialty winter maintenance equipment on vehicle delay by fusing Bluetooth speed, weather, and winter maintenance treatment data. A specialty plow capable of plowing two lanes in one pass is compared to a standard winter maintenance truck that plows and treats one lane per pass. Each type of equipment is analyzed on the same two-lane interstate highway, with the two trucks maintaining different sections to avoid cross contamination. The researchers deployed multiple Bluetooth nodes along the roadway to capture vehicle speeds during maintenance activities. The cumulative delay per mile is compared for the two trucks during light and heavy snowfall. The times when delay occurs are grouped into five-minute intervals for two scenarios including when the winter maintenance equipment has just passed through a Bluetooth node segment and for all recently-treated segments after the equipment has exited the highway. The results indicated the specialty plow creates a larger delay than the standard truck when plowing two lanes and a similar delay when plowing one lane and the shoulder. However, when looking solely at heavy snowfall, the delay is similar for each type of equipment, indicating the specialty plow is more effective during heavy snowfall.
Keywords: vehicle delay, bluetooth speeds, winter maintenance equipment.
1. Introduction
Winter weather conditions such as snowfall and wind may have detrimental impacts on roadway operations and the level of service provided to the motoring public. The pavement friction is reduced as a result of the cold temperatures, snowfall, and wind, causing motorists to reduce the speed of their vehicles. It is generally accepted that the majority of motorists will decrease their driving speed based on their perception of the roadway conditions. Several studies throughout the world have been conducted to determine the impacts of snowfall on vehicle speeds. It is found that
The impacts of winter weather are expansive based on the geographical location and arrival time of the storm. Based on the arrival and duration of a storm, motorists may alter their mode of transport, delay their trip, cancel their trip, or continue with their planned trip. Regardless of when and where a storm arrives, maintenance agencies must combat the storm to the best of their abilities. Agencies employ a variety of techniques to clear roadways of ice and snow in order to limit the speed decreases caused by the winter event. Some of the strategies commonly utilized include plowing, applying salt and other abrasives during storms, and pretreating roadways before a storm arrives. Recently, many agencies, such as state departments of transportation (DOTs), have been evaluating the use of specialty winter maintenance equipment within their fleets. Some of the specialty equipment includes tow behind trailers that swing out and plow a second travel lane or shoulder, as well as salt hoppers that are capable of spreading material over multiple lanes. Many studies have been conducted to determine the advantages of winter maintenance equipment and materials. Other studies have been conducted to determine the benefits and disadvantages of many anti-icing and de-icing materials (Shi et al., 2013; Fischel, 2001). Additionally, many studies have evaluated specialty plow blades to determine which are the most efficient at removing snow and which are the most cost-effective to implement (Mastel, 2011; Braun Inertec Corp., 2010; CTC and Associates, 2010; Colson, 2010; Colson, 2009).
This study utilizes Bluetooth nodes to collect speed data to facilitate comparisons between the resulting speeds and delays produced by specialty winter maintenance
equipment with those for a standard plow truck. Bluetooth nodes are a relatively new type of equipment used to record speeds of motorists along a roadway. Bluetooth nodes calculate speeds by detecting the media access control (MAC) address of an enabled device and matching it on multiple nodes separated by a known distance. Not every motorist has a Bluetooth enabled device, and resulting studies have found Bluetooth penetration rates ranging from three percent to ten percent (Brennan et al., 2010; Hainen et al., 2010; Asudegi, 2009; Hainen et al., 2010). From this sample size, the overall trends are captured from available devices, including travel times that may easily allow delay determinations (Hainen et al., 2010; Schneider et al., 2012; Martchouk et al., 2011; Wasson et al., 2008).
One aspect of specialty equipment that is not formally documented is the impact on resulting travel speeds and the associated delay. It is reasonable to assume that different types of winter maintenance equipment will have varying impacts on level of service. It is prudent to determine the impacts of specialty equipment on vehicle speeds and vehicle delay in comparison to a standard plow truck used by the agency evaluating the new equipment.
2. Data Setting
The analysis for this study was conducted during the 2013-2014 winter season, when data are collected for the tow behind plow and standard plow truck on I-76 in Portage County, Ohio. Portage County is located in the southern end of the lake-effect
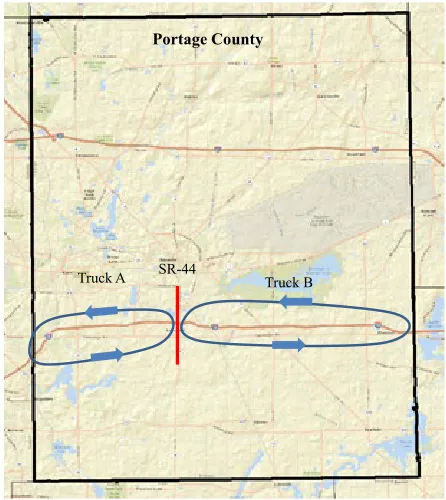
snow belt, resulting in snowfall amounts varying from 50 inches per year in the southern portion to 100 inches per year in the northern portion of the county. The study zone consists of a four-lane divided Interstate route maintained by the Ohio Department of Transportation (ODOT), as shown in Fig. 1.
Portage County
SR-44
Truck A Truck B
Fig. 1.
Location of Study Zone and Truck Maintenance Zones Note: Basemap adopted from Esri ArcGIS online
The study zone is 24 miles in length with a speed limit of 65 mph on the west half of the study zone and 70 mph on the east half. The average daily traffic varies from 59,700 to 29,900 on I-76 from west to east in the study zone (Ohio DOT, 2013). Each truck maintains one section of the study zone either east or west of SR-44.
3. Methodology
of the speed data segments and the winter maintenance equipment data.
3.1. Speed Data Collection Using
Bluetooth Technology
Bluetooth nodes are deployed along the roadside to calculate the speeds of passing motorists. The general principle of the Bluetooth system used to capture vehicle speeds is to place one node at location X and another node at location Y along a road, with a known distance Z between the two nodes. Once the nodes are deployed and the distance is known, it is possible to calculate the space mean speed of passing motorists. The nodes consist of a Bluetooth antenna to detect an active Bluetooth signal in passing vehicles, a computer board to maintain time synchronization and send data to a server, and batteries to power the device. Multiple nodes are placed along the roadway to record the timestamp and media access control (MAC) address when an active Bluetooth device passes. The raw data is sent in real-time to a server for processing, which includes grouping multiple recordings of a single MAC address on an individual node, and matching the unique MAC addresses on multiple nodes. The distance between each node is known so that when a MAC address is recorded on multiple nodes, the speed may be calculated by dividing the distance by the time difference. Additional information about the intricacies of the Bluetooth node development and deployment may be found in other works (Schneider et al., 2012; Pasolini and Verdone, 2002; Ahmed et al., 2008; Barcelo et al., 2009; Haghani et al., 2010; Quayle et al., 2010; Kim et al., 2011). For this study, data are collected continuously from December 2013 until April 2014. This duration allowed the research team to not only track delay
created by winter storms, but also to capture reoccurring congestion or other traffic patterns that may bias the data.
3.2. Winter Maintenance Equipment Data
Collection
This study compares the speeds resulting from the winter maintenance activities of a tow behind plow capable of plowing a second lane and a standard plow truck with a front plow and salt spreader. These will be referred to as the specialty plow and standard truck, respectively, for the remainder of this paper. The following paragraph describes the data collection process for both types of equipment.
in conjunction with the specialty plow was equipped with a global positioning system/ automatic vehicle locator (GPS/AVL) system to collect data automatically. The GPS/AVL system records the plow status, material application status, material application rate, and location. The standard truck was utilized during 22 snowfall events that occurred during the analysis period.
3.3. Data Fusion
To evaluate the impacts the w inter maintenance equipment types have on vehicle speeds, the Bluetooth speed data must be combined with the winter maintenance equipment data. The exact location of each Bluetooth node is known a priori, and segments are predefined to pair each node with the two adjacent nodes on either side in order to calculate a speed. Since the location of each truck is recorded, the data are analyzed to determine each pass of the winter maintenance equipment through a given Bluetooth node segment. The speeds are analyzed in two ways: first, recording the entry time, plow status, treatment status, and exit time when a plow truck travels through
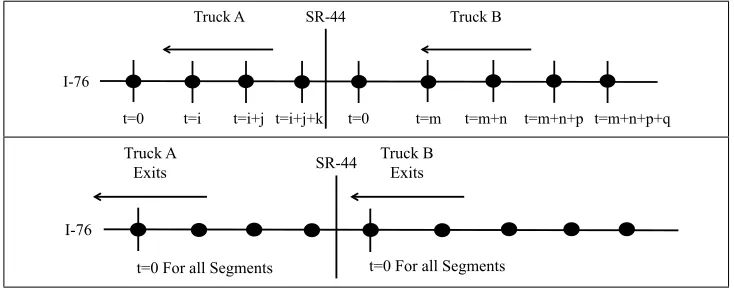
an individual node segment. This results in each node segment having a unique start and end time, with each node starting at time t=0. When the truck passes the last node segment it will start at t=0, while the previous node segment will be at t=i, which is equal to the time it took the truck to travel between the two node segments. This will continue back to where the truck began treating, with each node segment having a unique start time and time duration. To determine the effects of the winter maintenance equipment, the research team queried the speeds for each segment beginning at the entry time until 20 minutes after the exit time for each of the segments identified. Second, the entry time, plow status, treatment status, and exit time are recorded when the plow truck exits the highway. At this point, t=0 is set for all the node segments the truck has recently treated. This analysis results in several node segments having the same start and end times, since the speeds are recorded in all recently-treated segments for a period of 30 minutes once the truck exits the highway. Fig. 2 is developed to help describe this process and shows the first and second scenarios on the top and bottom, respectively.
I-76
SR-44
Truck A Truck B
t=0 t=i t=i+j t=i+j+k t=0 t=m t=m+n t=m+n+p t=m+n+p+q
SR-44 Truck A
Exits Truck B Exits
t=0 For all Segments I-76
t=0 For all Segments
Fig. 2.
In the first scenario, speeds are analyzed beginning each time a truck passes through the node segment. For the second scenario, speeds are analyzed using the same times for all segments recently treated, beginning at the time when the truck exits the highway.
The hourly snowfall, the previous four hours’ snowfall, and the total snowfall for the day are added to the dataset. The snowfall data are gathered through the use of a National Oceanic and Atmospheric Administration (NOAA) weather station. The speeds and accompanying delay are analyzed based on different storm severities, which are determined using the previous four-hour snowfall. The storms are classified into three categories based on the previous four-hour snowfall including: light for snowfall less than 0.5 inches, moderate for snowfall equal to or greater than 0.5 inches but less than one inch, and heavy for snowfall equal to or greater than one inch. Storm severity is often calculated using total snowfall for an event, but since the speeds and delays are based on current and recent weather, future weather cannot be used in this determination. Although other researchers have developed storm severity classifications (Nixon and Qiu, 2005), the classification system described herein is utilized based on the locality of the data and the temporal duration of the snowfall data.
Delay is calculated from the vehicle speeds by comparing the expected travel time to the actual travel time. The expected travel time may be determined in minutes by multiplying the distance between the two nodes by the quotient of 60 minutes per hour and the speed limit. Similarly, the actual travel time may be found by replacing the speed limit with the actual vehicle speed. The Bluetooth nodes were
placed in the field from December 2013 to April 2014 to capture baseline speeds under ideal weather conditions as well as speeds during winter events. The average speeds during weekday peak hours with normal weather were analyzed to determine if the expected travel time should be lower than the speed limit due to congestion, and the results indicated that using the speed limit is appropriate in this section of roadway. As stated previously, the speed limit is 65 mph west of 44 and 70 mph east of SR-44. These values are used as the baseline conditions from which delay is calculated, and the trucks maintain sections on both sides to eliminate any bias that may arise in the data from the different speed limits. Since each node segment is not of uniform length, the delay per mile is calculated to normalize for the varied lengths.
4. Results and Discussion
This research aims to quantify the impacts that various types of winter maintenance equipment have on vehicle speeds and the accompanying delays. A specialty plow maintains sections of a roadway in conjunction with a standard plow truck while the vehicle speeds and maintenance activities are recorded. Accordingly, the analysis and discussion is divided into two sections: the delay resulting when the winter maintenance equipment has recently passed through each segment, and the delay resulting after the winter maintenance equipment has exited the highway. In each case, an exponential decay curve is fit to the data with the accompanying coefficient of determination (R-squared value).
4.1. Delay in Individual Node Segments
truck passes through while treating the roadway. The times when the delays per mile occur are grouped into five minute intervals for each weather category and treatment type. The cumulative delay per mile occurring
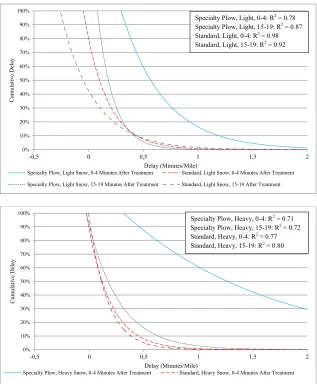
during normal utilizations were compared, including the specialty plow (treating both lanes of the highway simultaneously) and the standard truck (treating one lane at a time), as shown in Fig. 3.
Fig. 3.
The delay per mile shown corresponds to the delay of each individual vehicle on the roadway. The time intervals of zero to four minutes after the truck treated the node segment were compared to the time intervals of 15 to 19 minutes after treatment occurred. The delay per mile was shown for the specialty plow and the standard truck for light and heavy snowfall, zero to four minutes and 15 to 19 minutes after the truck passes through the node segments. From the first figure, it was found that the specialty plow has higher delay per mile than the standard truck during light and heavy snow. This occurs as a result of the specialty plow treating both lanes, which restricts traffic to traveling behind the truck and plow. While restricting traffic to traveling behind the specialty plow did result in increased vehicle delays, some may view this as a benefit by eliminating the possibility for a vehicle to travel at excessive speed in an untreated lane. Essentially, the specialty plow may limit vehicles to travel at slower speeds until clearing both travel lanes.
When comparing the delay per mile from the specialty plow zero to four minutes after treating during light and heavy snow, there was much greater delay during heavy snowfall. One possible cause for this result was that the specialty plow may be traveling more slowly and causing greater queues, which was not the case since the specialty plow treated at an average speed of 32 mph and 29 mph during light and heavy
snowfall, respectively, which would result in a difference of 0.2 minutes per mile in delay. This difference is only applicable when comparing the same time interval of the specialty plow during light and heavy snowfall. The larger delay during heavy snowfall was likely caused by motorists recognizing the hazardous conditions and reducing their speeds, a supposition which was further reinforced by a similar pattern found for traffic in segments maintained by the standard truck. During light snowfall, the specialty plow had a higher delay per mile during each time interval; during heavier snowfall, the delay per mile in the segments maintained by the specialty plow approaches that of the standard truck. Since the specialty plow maintained both lanes of traffic at once, the larger initial delay dissipated and approached that of the standard truck over time. Since the specialty plow was maintaining both lanes, a similar delay per mile was expected to occur if two plow trucks were gang plowing.
Fig. 4.
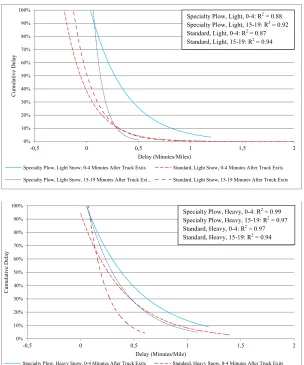
Cumulative Delay per Mile for Specialty Plow Maintaining One Lane and Shoulder and Standard Truck during Light and Heavy Snowfall
During light snowfall, the delay per mile for the specialty plow maintaining one lane and the shoulder was very similar to the standard truck. This was a result of both trucks maintaining a single lane in this configuration. When comparing the delay per mile during heavy snowfall, the
4.2. Delay when Trucks Exit the Roadway
Since the specialty plow may block both travel lanes while treating and cause queues to develop, the cumulative delay per mile was analyzed in all segments after the trucks
have exited the highway. Fig. 5 shows the cumulative delay per mile in segments maintained by the specialty plow treating two lanes and the standard truck treating one lane after the trucks have exited the highway.
Fig. 5.
During light snowfall, the delay per mile was higher for the specialty plow than for the standard truck, which was caused by the queues that build up when the equipment blocks both lanes of travel. When comparing the delay per mile caused by the specialty plow during light and heavy snowfall, the values were similar. However, the delay per mile caused by the standard truck was much greater during heavy snowfall than light snowfall and reached similar values as the specialty plow, which resulted from motorists decreasing their speeds since only one lane of the roadway had been cleared by the standard truck. This finding indicated that although the specialty plow created larger delays than the standard truck, it was more effective
during heavier snowfall, since it was able to clear two travel lanes in a single pass. The initial delay may be seen by comparing the delay per mile in the zero to four minute interval in Fig. 5 to the delay in the same time interval in Fig. 3.
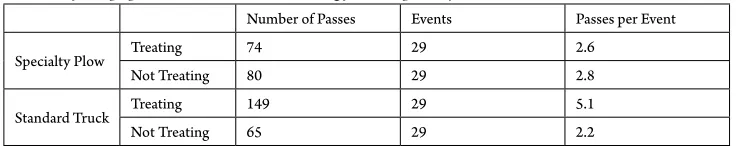
The specialty plow was capable of plowing and treating two lanes per pass, compared to the standard truck which was only capable of plowing and treating a single lane per pass. As a result, it was expected that the specialty plow will have to maintain the roadway a fewer number of times. The number of passes made by the specialty plow and standard truck while treating and not treating are shown in Table 1.
Table 1
Number of Loops per Hour made while Treating for the Specialty Plow and Standard Truck
Number of Passes Events Passes per Event
Specialty Plow Treating 74 29 2.6
Not Treating 80 29 2.8
Standard Truck Treating 149 29 5.1
Not Treating 65 29 2.2
A pass refers to each time the winter maintenance equipment treated one direction of the roadway, and treating refers to plowing, salting, or plowing and salting in the same pass. The standard truck made more passes while treating than the specialty plow, at a nearly 2:1 rate. While the specialty plow may create larger delays than the standard truck, the specialty plow is not on the road as often as the standard truck.
5. Conclusion
This investigation evaluated the impacts of specialty winter maintenance equipment
The cumulative delay per mile was determined for the standard truck and the specialty plow during light and heavy snowfall. The time when delay occurred were grouped into five-minute intervals for two different scenarios, including occasions when the winter maintenance equipment had just passed through a Bluetooth node segment and for all recently-treated segments after the maintenance equipment had exited the highway. The results indicated that the specialty plow created a larger delay than the standard truck when plowing two lanes simultaneously and a similar delay when plowing one lane and the shoulder. These delays were caused by the specialty plow maintaining two lanes and restricting vehicles from passing the plow as a result. This may be considered a benefit of the specialty plow as it does not allow for vehicles to pass at excessive speeds in an untreated lane. Although some motorists may not appreciate the forced speed reduction, the specialty plow forces motorists to travel at safer speeds when following the deployed equipment. Additionally, the delay created by the specialty plow is larger at the time closer to the time the truck first treated the roadway, as a result of the initial queue building up behind the truck. These initial queues were indicated by delay per mile curves that were much further apart for the specialty plow and standard truck in Fig. 3, found immediately after the trucks treated the road, and the similar delay values for each truck in Fig. 5, found after the trucks exited the highway. However, when looking solely at heavy snowfall, the delay was similar for each type of equipment, indicating that the specialty plow was more effective during heavy snowfall. The number of passes made while treating were compared for the specialty plow and the standard truck. The specialty plow created larger delays than the
standard truck, as a result of the specialty plow being capable of maintaining two lanes per pass, but it did not need to treat as often as the standard truck. Since the specialty plow was found to treat half as often as the standard truck, the impact of the delays are realized far less often on the roadway. These results are found for a specialty plow capable of plowing two lanes at once, but the results would be similar for gang plowing operations when multiple plows are used simultaneously.
Acknowledgements
The authors of this paper would like to thank the Ohio Department of Transportation for the use of their equipment and facilities in gathering the data for this study. Additionally, the authors would like to thank Mr. Brian Olson, Mr. Paul Ensinger, and Mr. Mark Griffiths for their guidance and input throughout this research project. The research was performed by The University of Akron. The contents of this paper reflect the views of the authors, who are responsible for the facts and the accuracy of the data presented herein. The contents do not necessarily reflect the official views or polices of ODOT or the Federal Highway Administration.
References
Ahmed, H.; El-Darieby, M.; Morgan, Y.; Abdulhai, B. 2008. A Wireless Mesh Network-Based Platform for ITS. In Proceedings of the Vehicular Technology Conference Spring
2008, IEEE Vehicular Technology Society, New York, NY,
3047-3051.
Barceló, J.; Montero, L.; Marqués, L.; Carmona, C. 2009. Travel Time Forecasting and Dynamic OD Estimation In Freeways Based on Bluetooth Traffic Monitoring. In Proceedings of the Transportation Research Board 89th Annual Meeting (CD-ROM), Transportation Research Board, Washington, D.C.
Braun Intertec Corporation. 2010. Development of Standardized Test Procedures for Carbide Insert Snowplow Blade Wear. Clear Roads Final Report.
Brennan, T.M.; Ernst, J.M.; Day, C.M.; Bullock, D.; Krogmeier, J.V.; Martchouk, M. 2010. Influence of Vertical Sensor Placement on Data Collection Efficiency from
Bluetooth MAC Address Collectoni Devices, Journal
of Transportatoin Engineering. DOI: http://dx.doi. org/10.1061/(ASCE)TE.1943-5436.0000178, 136(12): 1104-1109.
Colson, S. 2009. Evaluation of Alternative Snow Plow Cutting Edges. Technical Brief (09-3), Maine DOT Transportation Research Division.
Colson, S. 2010. Evaluation of the Kuper – Tuca SX36 Snow Plow Cutting Edges. Technical Brief 10-02, Maine DOT Transportation Research Division.
CTC and Associates LLC. 2010. Multiple-Blade Snowplow Project Final Report. Clear Roads Final Report.
Fischel, M. 2001. Evaluation of Selected Deicers Based on a Review of the Literature. Publication No. CDOT-DTD-R-2001-15. A Final Report Prepared for the Colorado Department of Transportation, Denver, CO.
Haghani, A.; Hamedi, M.; Sadabadi, K.; Young, S.; Tarnoff, P. 2010. Freeway Travel Time Ground Truth Data Collection Using Bluetooth Sensors. In
Proceedings of the Transportation Research Board 89th Annual Meeting (CD-ROM), Transportation Research Board, Washington, D.C.
Hainen, A.M.; Wasson, J.S.; Hubbard, S.M.L.; Remias, S.M.; Farnsworth, G.D.; Bullock, D.M. 2010. Estimating Route Choice and Travel Time Reliability with Field Observations of Bluetooth
Probe Vehicles, Transportation Research Record: Journal of the
Transportation Research Board of the National Acadamies. DOI: http://dx.doi.org/10.3141/2256-06, 2256: 43-50.
Hranac, R.; Sterzin, E.; Krechmer, D.; Rakha, H.; Farzaneh, M. 2006. Empirical Studies on Traffic Flow in Inclement Weather. FHWA-HOP-07-073.
Ibrahim, A.T.; Hall, F.L. 1994. Effect of Adverse Weather Conditions on Speed-Flow-Occupancy Relationships, Transportation Research Record, 1457: 184-191.
Kim, K.; Chien, S.I.; Spasovic, L.N. 2011. Evaluation of Technologies for Freeway Travel Time Estimation: Case Study of I-287 in New Jersey. In Proceedings of the Transportation Research Board 90th Annual Meeting, Washington, D.C.
Liang, W.L.; Kyte, M.; Kitcherner, F.; Shannon, P. 1998. The Effect of Environmental Factors on Driver Speed:
A Case Study, Transportation Research Record: Journal of
the Transportation Research Board. DOI: http://dx.doi. org/10.3141/1635-21, 1635: 155-161.
Martchouk, M.; Mannering, F.; Bullock, D. 2011. Analysis of Freeway Travel Time Variability Using Bluetooth Detection, Journal of Transportation Engineering. DOI: http://dx.doi. org/10.1061/(ASCE)TE.1943-5436.0000253, 137(10): 697-705.
Mastel, A. 2011. Evaluation of Snow Plow Blade Systems Final Report. North Dakota Department of Transportation Experimental Study MR 2010-03.
Ohio Department of Transportation. 2013. Traffic Survey Report. Division of Planning, Office of Technical Services, Traffic Counts.
Pasolini, G.; Verdone, R. 2002. Bluetooth for ITS?. In Proceedings of the 5th International Symposium on Wireless Personal Multimedia Communications, 1: 315-317.
Quayle, S.; Koonce, P.; DePencier, D.; Bullock, D. 2010. Arterial Performance Measures Using MAC Readers:
Portland Pilot Study. In Proceedings of the Transportation
Research Board 89th Annual Meeting (CD-ROM), Transportation Research Board, Washington, D.C.
Schneider, W.H.; Holik, W.A.; Bakula, C. 2012. Application of Bluetooth Technology to Rural Freeway Speed Data Collection. Ohio Department of Transportation Report FHWA/OH-2012/16.
Shi, X.; Venezian, D.; Xie, N.; Gong, J. 2013. Use of Chloride-Based Ice Control Products for Sustainable
Winter Maintenance: A Balanced Perspective, Cold Regions
Science and Technology. DOI: http://dx.doi.org/10.1016/j. coldregions.2012.11.001, 86: 104-112.
Tsapakis, I.; Cheng, T. 2012. Impact of Weather Conditions on Macroscopic Urban Travel Times. In the Special issue
of the Journal of Transportation Geography.
Wasson, J.S.; Sturdevant, J.R.; Bullock, D.M. 2008. Real-Time Travel Real-Time Estimates Using Media Access Control