High Energy Gamma Ray Imaging
Michael Richard Doherty
Thesis fo r the degree o f Doctor of Philosophy
UNIVERSITY COLLEGE LO NDO N
UNIVERSITY OF LONDON
ProQuest Number: 10017194
All rights reserved
INFORMATION TO ALL USERS
The quality of this reproduction is dependent upon the quality of the copy submitted.
In the unlikely event that the author did not send a complete manuscript and there are missing pages, these will be noted. Also, if material had to be removed,
a note will indicate the deletion.
uest.
ProQuest 10017194
Published by ProQuest LLC(2016). Copyright of the Dissertation is held by the Author.
All rights reserved.
This work is protected against unauthorized copying under Title 17, United States Code. Microform Edition © ProQuest LLC.
ProQuest LLC
789 East Eisenhower Parkway P.O. Box 1346
Abstract
This thesis presents a design study into gamma ray collimation techniques for
use in high energy radiation imaging devices for the nuclear industry. Such technology
is required to provide information on the nature and location o f isotopes within nuclear
facilities that have reached the end o f their useful life. The work has concentrated on the
use o f two different techniques, namely mechanical collimation using the Anger camera
and electronic collimation using a Compton camera. The work has used computational
models to evaluate the performance o f such systems and thereby suggest optimal design
parameters for use in prototype devices.
Ray tracing m odels have been constructed to simulate both parallel hole and
tapered bore diverging collimators. Investigations have been carried out to measure the
effects on the spatial resolution o f changing various design parameters o f the
collimators. The effects o f varying the hole size, septal thickness and collimator length
over a range o f source to collimator distances likely to be encountered in an industrial
scenario have been examined. Som e new insight into the nature o f the point spread
function o f m echanical collim ators has been gained and the lim itations o f the
conventional analytical approach to collim ator evaluation have been highlighted.
M odifications to the standard equations used in collimator design have subsequently
been suggested. An analytical description o f tapered bore collimators has been derived.
Monte Carlo models have been developed to model a single scatter Compton
camera. Germanium, silicon and sodium iodide have been investigated as candidates for
the scattering detector in such a device. A model o f a com plete ring array Compton
camera system has been used to evaluate performance. The data from the Monte Carlo
model has been reconstructed to form images. The quality o f the images generated have
then been compared with images obtained from parallel hole and focusing mechanical
collimators.
Contents
A b stract...2
C ontents...3
List O f F igures... 8
List Of Tables... 12
Acknowledgem ents... 15
1. Gamma Ray Imaging System s...16
1.1 In t r o d u c t io n...16
1.1.1 The Aim Of The W ork...16
1.2 DECOMMISSIONING STRATEGY...16
1.2.1 Incentives For D ecom m issioning... 16
1.2.2 Decom m issioning S ta g e s... 17
1.2.3 Decom m issioning Experience To D a te...18
1.2.4 Identification Of Contamination... 19
1.2.5 The Environment To B e Im aged... 20
1.2.6 Required Properties Of A Useful Imaging S y ste m ...22
1.2.7 Imaging Systems For D ecom m issioning Purposes... 23
1.3 The Ga m m a Ca m e r a... 24
1.3.1 Gamma Ray Imaging In M ed icin e... 24
1.3.2 Overview O f The Gamma Camera... 25
1.3.3 Gamma Camera Imaging Principle... 26
1.3.4 Imaging T echniques...29
1.3.5 Gamma Camera Collim ators... 30
1.4 THE Co m pto n Ca m e r a... 32
1.4.1 Compton Camera O verview ... 32
1.4.2 Compton Camera Imaging Principle... 33
1.5 Pro posed An d Co n str u c t ed Com pton Ca m e r a s... 36
1.5.1 Single Compton Scatter D ev ic e s... 36
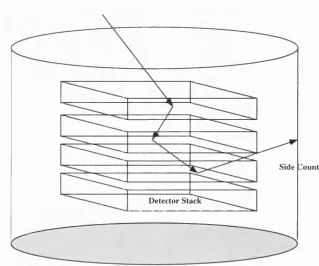
1.5.2 Multiple Compton Scatter Stack D e v ic e s ...39
1.5.3 Principle O f Multiple Compton Scatter D ev ices... 41
1.6 EXISTING GAMMA RAY IMAGING TECHNIQUES IN THE NUCLEAR INDUSTRY... 42
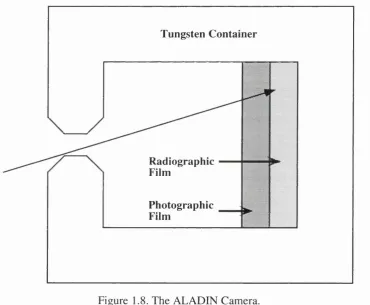
1.6.1 The ALADIN Camera... 42
1.6.2 Single Shutter Radiation Cam era...44
2.1 In tr o d u c tio n To Collim ator De s i g n...47
2.2 Gener al Desig n Co n s id e r a t io n s...47
2.2.1 Introduction to Design Considerations... 47
2.2.2 Electronics S y ste m ... 48
2.3 Ga m m a Ca m e r a Desig n Co n s id e r a t io n s... 49
2.3.1 Adaptation O f The Gamma Camera For Industrial Im a g in g 49 2.3.2 Parallel Hole Collimator Considerations... 50
2.3.3 Focusing Collimator Considerations... 54
2.3.4 Detector And Electronic Considerations... 56
2.3.5 Overall System Considerations... 58
2.4 COMPTON Ca m er a Desig n Co n s id e r a t io n s...59
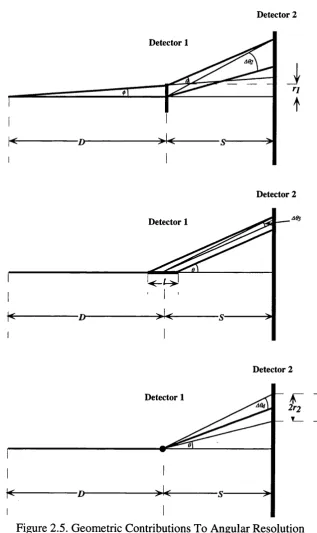
2.4.1 Spatial Resolution... 59
2.4.2 Efficiency and S en sitiv ity ...64
2.4.3 Rate Capability... 65
2.4.4 Detector Optimisation Considerations...66
2.5 TRANSFER Respo n se Fu n c tio n s Of Co l l im a t o r s... 67
2.5.1 The Imaging Problem ...67
2.5.2 Image Analysis Using Transfer Functions...67
2.5.3 Response Functions For Mechanical Collimator A ssessm ent...68
2.5.4 Response Functions For Electronic Collimator A ssessm ent... 69
2.6 Num erical Mo d e l l in g...70
2.6.1 The Purpose O f Computer Sim ulation...70
2.6.2 Ray Tracing M odels O f Parallel Hole C ollim ators... 71
2.6.3 Ray Tracing M odels Of Focusing C ollim ators... 75
2.6.4 Monte Carlo Models O f Electronic C ollim ators... 82
3. Ray Tracing Studies O f Mechanical Collim ators...86
3.1 DESIGN Of Parallel Hole Ga m m a Ca m e r a Collim ato rs By Ra y Tr a c in g...86
3.1.1 Introduction to A n a ly sis... 86
3.1.2 Implementation O f Ray Tracing Sim ulation... 86
3.1.3 PSF A s A Measure O f R esolution...89
3.1.4 Parameters In The Simulations...90
3.2 Experim en tal Me a su r e m e n t Of Collim ator Resp o n se Fu n c t io n s... 92
3.2.1 Objectives O f The Experiment...92
3.2.2 Collimator C o res...92
3.2.3 Apparatus...93
3.2.4 Experimental M ethod...95
3.2.5 A Comparison O f Ray Tracing With Experimental R esu lts...96
3.2.6 Conclusions On Experimental Comparison With Sim ulation...99
3.3 A Co m pa r iso n Of Ra y Tracing Sim ula tio n With St a n d a r d An a l y t ic a l Te c h n iq u e s... 99
3.3.1 Spatial Resolution... 99
3.3.2 Implications For Conventional D esign Techniques...106
3.3.3 Conclusions On Comparison... 109
3.4 RAY TRACING Re s u l t s...109
3.4.1 Effect Of Septal Thickness On Resolution... 109
3.4.2 Effect O f Collimator Length On R esolution...119
3.4.3 Effect Of Hole Size On R esolution...126
3.4.4 Conclusions On Ray Tracing Studies... 131
3.5 Co n c lu sio n s On The Desig n Of Pa r allel Hole Co l l im a t o r s...132
4. Ray Tracing Studies O f Focusing C ollim ators...134
4 .1 Ov er view Of Fo c u sin g Collim ator St u d i e s... 134
4.2 Practical Co nsider atio ns Of The Mo d e l...134
4.2.1 Focusing Collimator Geometries... 134
4.2.2 The Focusing Ray Tracing M o d el...136
4.3 Three Desig ns Of Diverging Co ne Beam Ta pered Bore Fo cusing Co l l im a t o r s... 138
4.3.1 Origin O f The D e sig n s...138
4.3.2 Response Functions Of Focusing C ollim ators... 140
4.3.3 Results From Ray Tracing Studies... 142
4.3.4 Variation O f Resolution With Photon E n erg y ...143
4.3.5 Effect o f Hole Position on Resolution... 147
4.3.6 Comparison O f Parallel Hole And Focusing Collimator Resolution... 148
4.4 An a ly tic a l Estim a te Of RESOLunoN... 149
4.5 Efficiency Of Fo cusing Co l l im a t o r s... 152
4.6 Co n c lu sio n s On Fo c u sin g Co l l im a t o r s... 154
5. Monte Carlo Studies Of Electronic Collimators... 156
5.1 In tr o d u c tio n To Co m pto n Cam er a St u d ie s...156
5.2 Tech nical Req uirem ents Of Co m po n en t Detectors Fora Single Scatter Co m pto n Ca m e r a... 156
5.2.1 Selection Of The D e v ic e ... 156
5.2.3 The Stopping Detector...158
5.2.4 Possible Candidates For Detector E lem ents... 158
5.3 COMPUTER SIMULATION AND DESIGN OF THE FRONT DETECTOR... 160
5.3.1 Comparison O f Ge, Si And N al As Detector M aterials...161
5.3.2 A Comparison Of Compton Scatter E fficiency...162
5.3.3 A Comparison O f N oise In the Scattering D etector...165
5.3.4 Optimum Scattering Detector S iz e s ...170
5.4 Desig na n d Sim ula tio n Ofa Complete Detector Sy s t e m... 171
5.4.1 Systems Used In Studies... 171
5.4.2 Geometry O f The System ... 172
5.4.3 Optimum Emission A n g le s ...173
5.4.4 Separation O f Detectors - including energy resolution...176
5.4.5 Outline O f The Monte Carlo C ode... 178
5.4.6 Principal O f Image Reconstruction And Outline O f C ode... 178
5.4.7 Results On Computer Simulated Data... 179
5.4.8 Conclusions On System Sim ulation...184
5.4.9 Practical Considerations For An Experimental S y ste m ...184
5.5 A COMPARISON Of Mec h an ica l An d Electronic Co llim a tio n 185 5.6 Co n c lu sio n s On Co m pto n Cam er a St u d ie s...188
6. Conclusions And Future W o r k ... 190
6.1 Su m m a r y Of Wo r k... 190
6.1.1 General O verview ...190
6.1.2 Anger Camera...190
6.1.3 The Compton C am era...191
6.1.4 Near Field Comparison O f Electronic And Mechanical C ollim ation... 192
6.2 Applications For The Nuc lea r In d u s t r y... 193
6.3 Fu tu r e Wo r k...194
Appendix 1: Gamma Ray Interactions With M atter... 195
A 1.1 Ga m m a Ra y In t e r a c t io n s... 195
A l . l . l Photoelectric Absorption...195
A l.1 .2 Compton Scattering... 196
A l.1 .3 Pair Production... 197
Appendix 2: Linear System s... 198
A 2 .1 Lin ear Sy stem s An d Im a g in g... 198
A2.1.1 Basic C oncep ts... 198
A 2.1.2 Formal Description O f Relationship Between Object And Im age... 198
A2.1.3 Implications For Im aging...200
Appendix 3: Monte Carlo Simulation Using The EGS4 Code
System ... 201
A3.1 INTRODUCTION TO E G S4...201
A3.2 DESCRIPTION OF E G S4... 201
A3.2.1 Overview O f EGS4...201
A3.2.2 Implementation o f EG S4...202
Appendix 4. Data Obtained From Ray Tracing Studies Of
Parallel Hole Collimators... 204
A4.1 NOTES... 204
Appendix 5. Data Obtained From Ray Tracing Studies Of
Diverging Tapered Bore Focusing Hole Collimators... 214
A5.1 No tes... 214
List Of Figures
1.1 The Gamma Camera. 25
1.2 Anger Camera Logic Circuit. 27
1.3 Anger Camera Collimator Geometries. 31
1.4 A Single Scatter Compton Camera System. 33
1.5 Projection Of Conic Sections In The Image Plane. 34
1.6 A Ring Array Compton Camera. 38
1.7 A Multiple Stack Compton Camera. 40
1.8 The ALADIN Camera. 44
1.9 The Single Shutter Radiation Camera. 45
2.1 Section and Plan View of a Parallel Hole Collimator. 50
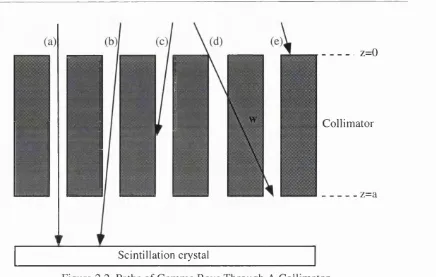
2.2 Paths of Gamma Rays Through A Collimator. 52
2.3 Section View Of Diverging Collimator. 55
2.4 Uncertainty per keV o f Energy Resolution Versus the Central Scattering
Angle. 61
2.5 Geometric Contributions To Angular Resolution. 62
2.6 Rays Intersecting Crystal At Incremental Distances. 72
2.7 Unit Cell Used In Parallel Hole Ray Tracing Program. 73
2.8 Flow Diagram For Ray Tracing. 74
2.9 Solutions To Ray Trajectory Equation. 78
2.10 Structure Of Collimator Used In Ray Tracing. 80
3.1 Response Functions Of A Collimator. 87
3.2 Object and Images Illustrating The Effect Of Long Tails In The PSF. 89
3.3 Experimental Apparatus For Measuring Point Spread Functions Of
Collimator Cores. 94
3.4 A Comparison Of Experimental Data And Simulated Results For Collimator
Core A. 98
3.5 Geometry Used In Deriving Collimator Equations. 101
3.6 Plan View Of Photon Trajectories Through A Circular Collimator Hole. 102
3.7 Simulated And Theoretical Geometric Response For Collimator Study 1. 105
3.8 Simulated And Theoretical Geometric Response For Collimator Study 4. 106
3.9 Collimator Resolution Against Septal Thickness. 111
3.10 Edge Penetration Response Functions For f = 0.1 mm to 0.7 mm. 112
3.11 Septal Penetration Response Functions For / = 0.1 mm to 0.7 mm. 113
3.12 Edge Penetration Response Functions For t = \ . Q mm to 1.9 mm. 114
3.13 Septal Penetration Response Functions For ^ = 1.0 mm to 1.9 mm. 114
3.14 Components Of The Septal Penetration Response Function { t = 1.2 mm ). 115
3.15 Components Of The Septal Penetration Response Function { t = 1.5 mm). 116
3.16 Collimator Resolution Against Collimator Length. 120
3.17 Edge Penetration Response Functions For a = 10 mm to 100 mm. 121
3.18 Septal Penetration Response Functions For a = 10 mm to 100 mm. 122
3.19 Components Of The Penetration Response Function For a = 10 mm. 123
3.20 Components Of The Penetration Response Function For a = 100 mm. 124
3.21 Path Of Photons Penetrating Long Axis Of Collimator. 125
3.22 Increased Path Through Septa For Increased Source Distance. 125
3.23 Collimator Resolution Against Collimator Hole Size. 127
3.24 Penetration Response Functions For d = 3.0 mm and 3.5 mm. 128
3.25 Edge Penetration Response Functions For d = 2>.0 mm and 3.5 mm. 129
3.26 Septal Penetration Response Functions For d = 3.0 mm and 3.5 mm. 129
3.27 Components Of The Septal Penetration Response Functions For d = 2t.O
mm. 130
3.28 Components Of The Septal Penetration Response Functions For d = 3.5
4.1 Focusing Collimator Designs. 135
4.2 Plan View Of Collimator With 9 Holes Projecting Radially. 137
4.3 Parameters Used In Tapered Bore Focusing Collimator Simulations. 139
4.4 Characteristic Response Functions O f A Tapered Bore Focusing
Collimator. 141
4.5 Paths Of Photons Incident Parallel To The
z
Axis. 1424.6 Variation In FWHM Value For The Central Hole Of Each Collimator
Design. 143
4.7 Variation In FWTM Value For The Central Hole Of Each Collimator
Design. 144
4.8 Edge Penetration Response Functions For Collimator B At 130 keV And
660 keV. 146
4.9 Variation In FWHuM Value For The Central Hole Of Each Collimator
Design. 147
4.10 Comparison Of Parallel And Focusing Collimators Images Of Disc
Sources. 149
4.11 Analytical Description Of A Tapered Bore Focusing Collimator. 150
5.1 Pc As A Function Detector Thickness In Germanium. 163
5.2 Pc As A Function Of Detector Thickness In Silicon. 163
5.3 Pc As A Function Of Detector Thickness In Sodium Iodide. 164
5.4 Ratio Of Single Compton Scattered Photons To Multiple Compton Scattered Photons As A Function Of Detector Thickness In Germanium. 165
5.5 Ratio Of Single Compton Scattered Photons To Photoelectrically Absorbed Photons As A Function Of Detector Thickness In Germanium. 166
5.6 Pc/Pmc As A Function Of Detector Thickness In Silicon. 167
5.7 Pc/Ppe As A Function Of Detector Thickness In Silicon. 167
5.8 Pc/Pmc As A Function Of Detector Thickness In Sodium Iodide. 168
5.9 Pc/Ppe As A Function Of Detector Thickness In Sodium Iodide. 169
5.10 Geometry Of The Compton Camera System Used In The Studies. 172
5.11 Angular Distribution Of Compton Scattered Photons In Germanium
Detector. 173
5.12 Angular Distribution Of Compton Scattered Photons In Silicon Detector. 174
5.13 Angular Distribution Of Compton Scattered Photons In Sodium Iodide
Detector. 175
5.14 Angular Uncertainty As A Function Of Detector Separation. 177
5.15 Coincident Count Energy Spectra From Front Detector Without Using
Energy Summation Test. 180
5.16 Coincident Count Energy Spectra From Front Detector Using Energy
Summation Test. 181
5.17 Germanium - Sodium Iodide Camera System Images With (a) And Without
(b) Energy Summation. 183
5.18 Silicon - Sodium Iodide Camera System Images With (a) And Without (b)
Energy Summation. 183
5.19 Sodium Iodide - Sodium Iodide Camera System Images With (a) And Without (b) Energy Summation. 183
5.20 Simulated Test Distribution. 186
5.21 Images Of The Test Object. 187
List Of Tables
1.1. Summary Of Gamma Ray Emitting Isotopes Found At BNFL Sellafield. 22
3.1 Collimator Designs Used In Example Image. 88
3.2 Dimensions Of Collimator Used In PSF Accuracy Investigation. 91
3.3 The Effect Of The Number of Photons Traced per Azimuthal Angle on
Calculated Resolutions. 92
3.4 Dimensions Of Collimator Cores. 93
3.5 A Comparison Of Resolution Values Obtained From Standard Equations And Collimator Simulations. 104
3.6 A Comparison Of Collimator Designs Obtained With And Without Using A
Hole Shape Correction. 108
3.7 Ray Tracing Model Constant Parameters Used In Septal Thickness
Investigation. 110
3.8 Variation Of Minimum FWHuM Value With Septal Source To Collimator
Distance. 118
3.9 Ray Tracing Model Constant Parameters Used In Collimator Length
Investigation. 119
3.10 Ray Tracing Model Constant Parameters Used In Hole Size (Flat to Flat)
Investigation. 126
4.1 Design Parameters For Focusing Collimator Studies. 140
4.2 A Comparison Of Focusing And Parallel Hole Collimator Resolutions. 148
4.3 Geometric Efficiency Of Collimator D esigns Along Central Axis Of
Collimator. 153
5.1 A Comparison Of Gamma Ray Detectors. 160
5.2 Dimensions And Properties Of Designs For Use As A Scattering Detector In a Compton Camera System. 171
5.3 Contributions To Angular Uncertainty Due To Energy Resolution. 177
5.4 Intrinsic Efficiency Of Compton Camera Designs. 181
5.5 FWHM of Compton Camera Designs. 184
5.6 Dimensions Of Test Distribution. 186
6.1 Comparison Of Collimation Techniques. 192
A4.1 Variation Of The FWHM Of The PSF With Septal Thickness(/) And Source To Collimator Distance(^). 205
A4.2 Variation Of The FWTM Of The PSF With Septal Thickness(/) And Source To Collimator Distance(^). 206
A4.3 Variation Of The FWHuM Of The PSF With Septal Thickness(^) And Source To Collimator Distance(^). 207
A4.4 Variation In FWHM Of The PSF With Collimator Length(a) And Source To
Collimator Distance(^). 208
A4.5 Variation In FWTM Of The PSF With Collimator Length(a) And Source To
Collimator Distance(6). 209
A4.6 Variation In FWHuM Of The PSF With Collimator Length (a) And Source To Collimator Distance(ft). 210
A4.7 Variation In FWHM Of The PSF With Hole Size(rf) And Source To Collimator Distance(ft). 211
A4.8 Variation In FWTM Of The PSF With Hole Size(//) And Source To
Collimator Distance(^). 212
A4.9 Variation In FWHuM Of The PSF With Hole Size(</) And Source To
Collimator Distance(^). 213
A 5 .1 Collimator A: Variation In FWHM Value With Energy (E/keV) And Radial
Position (N). 215
A5.2 Collimator A: Variation In FWTM Value With Energy (E/keV) And Radial
Position (N). 216
A5.3 Collimator A: Variation In FWHuM Value With Energy (E/keV) And
Radial Position (N). 217
A5.4 Collimator B: Variation In FWHM Value With Energy (E/keV) And Radial
Position (N). 218
A5.5 Collimator B: Variation In FWTM Value With Energy (E/keV) And Radial
Position (N). 219
A5.6 Collimator B: Variation In FWHuM Value With Energy (E/keV) And
A5.7 Collimator C: Variation In FWHM Value With Energy (E/keV) And Radial
Position (N). 221
A5.8 Collimator C: Variation In FWTM Value With Energy (E/keV) And Radial
Position (N). 222
A5.9 Collimator C: Variation In FWHuM Value With Energy (E/keV) And
Radial Position (N). 223
Corrigenda
p l8 , line 14 Replace "Dosimetric surveys can he extremely inefficient,.." with
"Dosimetric surveys provide limited spatial localisation o f the contamination...".
p i 8, line 19 Replace "...activity o f the waste" with "...volume o f the waste".
p i 8, line 29 Interchange stated half lives of ^^Ni and ^^Co.
p l9 , line 24 Replace "...(Jones 1987)" with "...(Collins 1987)".
p26, line 4 Replace "...with with "...with ZP^/E^y( 4 < n ^ and 1 ^ < 3 )" .
p28, line 11 Insert "were" after "...X and Y signals".
p34, Equation 1.3 Eyi s the energy of the incident gamma ray.
p35, line 25 Replace "...Singh and Doria 1986" with "...Singh et al 1986".
p50, line 8 Insert "intrinsic gamma ray" before "detection efficiency...".
p50, line 13 Insert "spatial" before "resolution...".
p56, line 15 Replace cos6i^ with cos^O.
p75, line 12 Replace "...output information or" with "...output information for".
p88. Table 3.1/ p91, Table 3.2 Replace "(Flat tat Flat)" with "(Flat to Flat)".
93, line 7 Remove "...perpendicular directions in".
p95, line 32 Insert "This resulted in a maximum o f approximately 30000 counts being deposited in the bin representing direct alignment o f source and detector" after
"...each position o f the source.".
p i 15, Figure 3.14/ pi 16, Figure 3 .1 5 /p l23. Figure 3 .1 9 /pl24. Figure 3 .2 0 /p i 30, Figure 3.27/ p l3 1, Figure 3.28 Replace first legend with "Single Septal Penetration".
p i 44, line 12 Replace "...an increase in the displacement value in the width o f the PSF at its intersection with they=0.5 line" with "...a linear increase in the FWHM o f the PSF fo r each increment in energy".
pl5 1 . Equation 4.6 First term on RHS should have a factor (1+c/a).
p i 52, line 17 Insert "fractional" before "solid angle...".
p i 54, line 10 Replace "...Table 4.12" with "...Table 4.3".
pi 83, Figure 5.17, Figure 5.18 and Figure 5.19 interchange images a) and b).
1. Gamma Ray Imaging Systems
1.1 Introduction
7.7.7
The Aim Of The Work
Once a nuclear fuel processing plant has reached the end o f its operational life, it may have become contaminated by radionuclides. This contamination must be safely removed before any further decommissioning activities can proceed. The aim o f the thesis is to evaluate gamma ray collimation techniques for imaging the radiation emitted by such fission products. Two different approaches will be examined and their relative merits and disadvantages compared. The first technique considered is the adaptation of the clinically used gamma camera. This will take the form o f both ray tracing computational models and experimental work. The second technique is that o f the development of a Compton camera. This will be examined using Monte Carlo photon transport computational models .
This chapter initially introduces the subject of nuclear decommissioning and the problems it poses. There then follows a description of the two gamma ray imaging techniques studied in this thesis. The chapter concludes with a review o f other techniques currently under development for use in the nuclear industry.
1.2 Decommissioning Strategy
7.2.7
Incentives For Decommissioning
A central assumption in the development of the nuclear industry has been that all reactors and associated fuel facilities will eventually be dismantled and their locations returned to "green field" sites. The decommissioning of nuclear plants has therefore become a high profile topic. This can be attributed to three major factors (Lawton 1987). Firstly, many reactors and plants are reaching the end o f their operational lives. Secondly, there is widespread public interest in the subject, particularly relating to the safe disposal of any wastes. Lastly, the long term future of the nuclear industry depends upon the demonstration that safe and cost effective decommissioning of nuclear facilities is a viable proposition.
Chapter 1: Gamma Ray Imaging Systems
An indication of the costs and timescales involved in decommissioning is illustrated by considering the UK programme: The current estimated cost of decommissioning the United Kingdom's 8 Magnox and 6 AGRs is £9.6 billion (Surrey 1994). In the case o f one decommissioning project, the Windscale Advanced Gas-cooled Reactor (WAGR), it was estimated that the whole project would be completed in nine years. If no decommissioning took place, it was estimated that remote handling techniques would still be required, even after 300 years.
1.2.2 Decommissioning Stages
The accepted method of decommissioning a nuclear installation in the UK is a three stage process.
1) The first stage is known as post operational clean out (Cunningham 1991). As the name implies, this follows the immediate shutdown o f the plant. In this stage all operating personnel areas are shutdown and redundant instrumentation is removed. Operational wastes and any processing residues remaining in the plant are then removed as best possible, usually by flushing plant vessels through drain valves. The installation is then made safe to the satisfaction of the Regulatory Authorities. Extensive routine maintenance and surveillance is required before progressing to stage two.
Chapter 1: Gamma Ray Imaging Systems
3) The final stage of the process is to remove the remaining active plant and structural parts. They may also be treated by a waste processing plant. The decommissioned area can then be classified a green field site.
The time period between any of these stages could be a period of decades. This will depend upon factors such as the type of facility, conditions of buildings, economic climate and public attitude. UK decommission policy assumes that for the case of nuclear reactors, the time between the second and third stages is at least one hundred years.
In the second and final stage of the process, it is important to discriminate between items that are high level activity and those that are low level activity waste. The reason for this is to ensure that there is no spread of contamination and that there is minimum radiation exposure to personnel. There are many different types of plant used in nuclear fuel reprocessing, each of which present different isotopes and levels of activity. Dosimetric surveys can be extremely inefficient, with low or negligible level activity waste being processed as high level activity waste. This can add greatly to the cost of decommissioning.
Once removed from the active area, waste must be safely packaged in the necessary containers. Decontamination may be employed at this stage to reduce the activity of the waste. This may be achieved by chemical decontamination, chipping, grinding, ultrasonic methods, steam cleaning and hydrolazing (Denault 1988). The packaged waste is then subject to a radioactive inventory before it is sent for disposal.
1.2.3 Decommissioning Experience To Date
There are two main categories of nuclear plant to be decommissioned: reactors and chemical processing plants. Reactors pose greater problems because once the operational components have been removed, the residual radioactivity is caused by the transmutation of elements in the reactor material and its containment. This is largely due to stainless steel structures. During the operational life of the reactor, the nickel and associated cobalt in the stainless steel absorb neutrons to form high gamma activity isotopes. The isotopes ^^Ni (half life 5.3 years) and ^^Co (half life 100 years) are typically found (Lawton 1987). To date, no full size reactor has been dismantled anywhere in the world (Surrey 1994). The radioactivity in chemical plants is mainly due to surface contamination and so presents more o f a decontamination problem i.e. the radioactivity lies in deposits on the surface o f objects rather than within the object's structure. There have been three reported successes in decommissioning chemical plants
Chapter 1: Gamma Ray Imaging Systems
to Stage 2 including Dounreay in the United Kingdom, West Valley in the USA and Cap La Hague in France (Lawton 1987).
A report on the decommissioning experience of British Nuclear Fuels (BNFL) at Sellafield in the UK makes several points (Colquhoun 1993) on the nature of the problems encountered:
1) Most o f the areas to be decommissioned are physically large and all are difficult to access.
2) The engineering support facilities such as lifting equipment and ventilation are unusable or non-existent.
3) The plants were not designed with decommissioning in mind and must now be decommissioned to personnel dose and environmental standards that were not envisaged at the time when they were in operation.
BNFL have therefore based the technical requirements o f their decommissioning programme on solving these three problems. A design study for the decommissioning of the Caesium Extraction Plant at Sellafield typifies the problems encountered (Wroughton 1992) by BNFL. The plant was closed 30 years ago due to equipment failure and reduced demand for Caesium. The equipment has deteriorated significantly since its introduction. The vacuum transfer system is inoperable making effluent movement impossible. Some of the information on the plant has deteriorated with time and become difficult to read. Other information has been lost.
There are currently no published accounts o f the final stage o f decommissioning being completed. However some projects such as the WAGR are now approaching this stage (Wakefield 1988). This project has involved the construction and installation of a dismantling machine (Jones 1987). This machine was designed to both cut and remove the remaining active materials using oxypropane and plasma arc cutting techniques using closed circuit television as the visual assistance for the operator. Once these wastes have been removed, the final dismantling remains an exercise in civil engineering.
1.2.4 Identification Of Contamination
Chapter 1: Gamma Ray Imaging Systems
which contaminate the process plant. When such plants reach the end o f their operational life, they must therefore be decontaminated before any further decommissioning activities can proceed. This requires the identification and removal of high activity waste.
The location and concentration of such isotopes will not necessarily be known within a particular plant. The most desirable way to identify the position and composition of this waste is in the form of an image of radiation hotspots in the scene. However, such techniques are not commonly used in the nuclear industry. A device capable of imaging radiation would find widespread use in the nuclear industry, specifically in the following areas (Simonet 1989):
1) Planning of a manual intervention into a radiation "hot area".
2) Evaluating the required decontamination procedures for a particular radiation environment.
3) Strategy planning for dismantling and decommissioning nuclear installations.
4) Containment monitoring of risk areas. This involves monitoring radiation protection and detecting possible leaks.
5) Examination and monitoring of effluent circuits in reprocessing operations.
6) Quantification of materials for radioactive waste management.
In addition to the above areas, a radiation imaging device would find use in possible radiation incidents. There is therefore considerable interest in developing technology for imaging distributions for the above purposes.
1.2.5 The Environment To Be Imaged
The size and type of plant to be decommissioned can vary widely, from small laboratories to large buildings. Likewise, the range o f radiations present in a particular scenario will also vary widely. In some cases it may be possible to provide information on the basis of known parameters relating to the operational purpose of the plant. In others, radiometric measurements may be the primary or only source of information.
The activity of wastes generated by the decommissioning process fall into three broad categories (Wakefield 1988):
1) Non-active waste. This is suitable for disposal on a public waste tip. Activity <0.0004 MBq/ kg.
Chapter 1: Gamma Ray Imaging Systems
2) Low Level Waste (LLW). This is suitable for sea disposal or may be buried in a shallow or deep land repository. Activity < 1 2 MBq/ kg.
3) Intermediate Level Waste (ILW). This is suitable for sea disposal or may be buried in a deep land repository. Activity >12 M Bq/kg
The quantity of each category of waste produced by individual projects will depend upon the nature of the plant, and the stage of decommissioning taking place. Decontamination of plant items will produce contaminated liquid effluents, filters and sludges. These will typically require some form of conditioning before disposal as low level waste. Gardener et al (1991) indicate that waste at the Sellafield reprocessing plant in the UK will contain a variety of materials with activities ranging from < 0.4 Bq/g for very low level waste (VLLW) to 10^^ Bq/g in residual fuel bearing wastes. This may be contained in small packages or very large crates. Remnants of such waste can expect to be found in reprocessing facilities during decommissioning. Wroughton (1992) describes the problems faced in decommissioning the Caesium Extraction Plant at Sellafield. The radiation levels inside the plant result in effective dose equivalents of 0.3 Sv/hr to 4.0 Sv/h.
Contamination will generally consist of material emitting a combination of gamma and beta radiation. Beta particles are of little use in forming an image because they cannot penetrate more than a few millimetres of material without undergoing an interaction. This means that it is difficult to establish with any accuracy the origin of the particles as they may have been scattered several times before they reach the detector. In addition to this, the range of beta particles produced in radioactive decay is small. Gamma rays, on the other hand, are sufficiently penetrating that they may travel a considerable distance in straight line to a detector from their source without undergoing any interaction on the way. This makes them ideal for forming an image.
Chapter 1: Gamma Ray Imaging Systems
For this reason, it was selected as the isotope on which to base the studies of the gamma ray collimation techniques presented in this thesis.
Table 1.1. Summary Of Gamma Ray Emitting Isotopes Found At BNFL Sellafield.
Plant
Isotopes Present
Magnox Fuel Storage Pond 1 3 7 c s , 2 3 5 u , 4 0 k , 154eu, 9 5 ^ ,6 ,6 0 c o ,
234m Pa
Caesium Extraction Plant 137Cs, 106r u, 40k, 95zr, 154e u, 9 5 x b
Pilot Magnox Fuel Reprocessing Plant 1 3 7 c s , 2 3 5 u , 4 0 k , 154eu, 6 0 c o , 234m Pa, 144ce, 144pr, 106ru
Magnox Intermediate Level Waste Repository
1 3 7 c s , 235u, 60c o, 40r,
Plutonium Pacemaker Plant 235u, 241^^1, Pu (All isotopes)
1.2.6 Required Properties O f A Useful Imaging System
Imaging system performance is usually described in terms of spatial resolution and sensitivity. Spatial resolution describes the ability of a system to resolve fine detail in the object. Sensitivity is the characteristic which expresses the number of counts obtained by the detection system in terms of the number o f quanta emitted from a source. These performance criteria have been assessed in terms o f the requirements for an industrial imaging device. In terms o f sensitivity, measurement time is not considered to be a restricting factor because areas to be imaged generally contain stationary objects, and access is infrequent. Discussions with BNFL (Garlick 1991) indicate measurement times o f several days are not considered a problem. This factor added to the high activity of radiation areas, suggests sensitivity does not need to be optimised. Spatial resolution is considered a much more important factor. Discussions with BNFL indicate the minimum useful spatial resolution would be 1 m at 5 m from the detector (Garlick 1991).
Examination o f Table 1.1 in conjunction with discussions with BNFL (Cunningham 1991) leads to the conclusion that a generalised gamma ray imaging device constructed for use in the nuclear industry should be based on imaging the 662 keV photopeak of ^ ^^Cs. The range of activities encountered varies widely as outlined
Chapter 1: Gamma Ray Imaging Systems
in the previous section. The device should operate in environments with activities up to 12 MBq/kg. In the extreme case, the photon flux on the detector may reach 1x10^ photons per cm^. Radiation damage to detector components should therefore be considered in any practical implementation of a detection system.
A device for general use should be portable. This places restrictions on the size and weight o f the detector. The size is limited by the size o f remote handling ports (approximately 170 mm diameter) into contaminated areas. This may require radiation shielding of the detector to be minimised. Shielding may also be limited by weight restrictions. Weight restrictions may arise from the strength of remote handling manipulators. However, there is the possibility of using a gamma ray imaging device in a sentencing cell environment. This is an area where contaminated objects are taken to be categorised by their activity. Once examined, the fate of the waste may be decided. In this scenario, the device may be permanently mounted and the above arguments on portability no longer hold.
The field o f view o f the device should be as large as possible. However, scanning over a large area may be possible in some situations. Ideally, one should be able to obtain three dimensional information about the object being imaged. It is quite possible that a radiation image could be superimposed on an optical image to give some information of this nature. Alternatively, range finding equipment (e.g. ultrasonic) could be used to identify an object in a scene.
1.2.7 Imaging Systems For Decommissioning Purposes
It has been established in this section that gamma ray imaging could be used to assist in the decommissioning o f nuclear facilities. In addition to this, the nature of the radioactivity and environments in which it exists have been examined in this section. The remainder of this chapter looks at a variety of devices either currently used or proposed for gamma ray imaging and examines their suitability for adaptation to the industrial environment. The chapter concludes with an examination of two techniques currently under development for use in the nuclear industry.
Chapter 1; Gamma Ray Imaging Systems
electronic collimation. All the designs considered in following sections employ one or the other technique.
Medical imaging has probably seen more developments in the field of gamma ray imaging than any other and indeed both collimation techniques originate from this area. For this reason, the de-facto device used in medicine today, the Anger gamma camera, is considered first.
1.3 The Gamma Camera
1.3.1 Gamma Ray Imaging In Medicine
The use of tracer isotopes for the diagnosis of clinical disease has come to be known as nuclear medicine. The purpose o f radionuclide imaging in medicine is to obtain a picture of such radioactive labelled substances within the body after they have been administered to a patient. These are known as radiopharmaceuticals and are designed to investigate the physiological function of individual organs in the body. The
in-vivo distribution is mapped or "imaged" by recording the emissions from the radioactivity, with external radiation detectors placed outside the body. This differs significantly from x-ray imaging whose purpose is to provide anatomical information.
The most common form of imaging is static planar imaging. These images consist of two dimensional projections of the three dimensional distribution of activity within the body. Data collection may take several minutes to complete. The image therefore can give information on the total uptake of a particular pharmaceutical within the body. The main problem with planar imaging is that it can be difficult to determine the function of tissue deep in the body. This is due to the superposition of information in the single planar view. This may be overcome by taking several images of the object from different orientations and combining the information. This is known as emission computed tomography (ECT). Images are taken axially around the object and combined using mathematical reconstruction algorithms on a computer.
The most popular metastable radionuclide for use in nuclear medicine imaging studies today is technetium-99m (^^Tc^). It has a physical half life of 6.02 hours and decays via isomeric transition to ^^Tc emitting a 140 keV gamma ray. The short half life and absence o f p decay result in a low patient dosage. In addition, the photon energy is sufficient for penetration of body tissue. It is for this reason the main imaging device used in nuclear medicine is optimised for the detection o f 140 keV gamma rays. This is known as the gamma camera.
Chapter 1: G am m a Ray Im aging System s
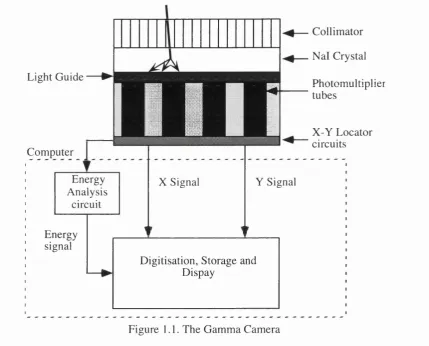
1.3.2 Overview Of The Gamma Camera
The gamma camera is a position and energy sensitive gamma ray detector used in the medical field to image such in vivo distributions of radioactivity (Fig. 1.1) as described above. It was first introduced in the late 1950’s (Anger 1958).
Light Guide
Computer
I I i
Energy Analysis circuit
Energy signal
X Signal
Collimator
Nal Crystal
Photomultiplier tubes
X-Y Locator circuits
Y Signal
Digitisation, Storage and Dispay
Figure 1.1. The Gamma Camera
The preferred emissions range for this application are y rays in the energy range of around 80 keV to 300 keV. Gamma rays of these energies are sufficiently penetrating in body tissues to be detected from deep lying organs but are shielded adequately with reasonable thicknesses of lead. The device consists of a single thin, large diameter (typically 13 mm x 400 mm) Nal(Tl) scintillation crystal optically coupled to a series (up to 101) of hexagonal packed photomultiplier tubes, possibly via a light guide. Thallium activated sodium iodide is used for two main reasons:
i) Nal has a high light yield emitting around 40 photons per keV of ionising radiation energy absorbed. This response is close to linear over a wide energy range (Knoll 1989).
Chapter 1: Gamma Ray Imaging Systems
ii) Nal is relatively dense (p = 3.67 g/cm^) and contains an element of high atomic number (Iodine, Z=53). This makes it an ideal absorber of gamma rays at low energies, since the probability o f photoelectric absorption varies with Z^/By^ where Ey, is the incident energy of the gamma ray.
Nal has a high refractive index (1.85) for its own scintillation light. This is a blue light with a wavelength o f approximately 415 nm. A transparent plastic light guide may therefore be used to optically couple the scintillator and photomultiplier tubes hence reducing light loss. Alternatively, microprocessor based correction techniques may be applied during data acquisition. The spectral response of the photocathode of the photomultiplier is matched to the spectral output of the scintillator by the use of bialkali materials (e.g., SbK2Cs). The whole assembly is packed into a light sealed case. This is necessary due to the hygroscopic nature o f Nal. The case is also radiation shielded to prevent unwanted gamma rays entering the crystal (Short 1984). In order to form an image, a lead collimator is placed over the crystal face.
1.3.3 Gamma Camera Imaging Principle
A gamma ray photon passing through the collimator interacts in the crystal to produce scintillation photons. The intensity of the light pulse received by a particular photomultiplier tube will be dependent on its distance from the event. If the co-ordinate axis are defined, the tube outputs can be processed to give the positional co-ordinates of the event relative to its position of interaction in the crystal. If the outputs o f all tubes are then summed together, the energy deposited by the interaction can be obtained.
A conceptual seven photomultiplier tube gamma camera using resistive coupling is shown in Figure 1.2.
The outputs o f tubes 2 and 3 are combined through resistance Ry2 and Ry^ to
produce the F+ signal. Similarly the outputs of tubes 5 and 6 are combined through resistance's R~y^ and R~^ to produce the F" signal. These outputs are then combined in amplitude and polarity to provide a signal representative of the Y co-ordinate of the gamma ray interaction
F = k
(
1
.
1
)
where k is a scale factor.
Chapter 1: G am m a Ray Im aging System s
The %+ signal is obtained in the same way through resistances and
Rl^, however, in this case the value of R^^^ is half the value of the other two resistors. This is necessary because photomultiplier tube 4 has twice the linear displacement along the X axis as the other two photomultipliers. The outputs of tubes 1, 2 and 6 are added through resistances R^j , R^j and R^^Xo produce the X~ signal. Once again, the value of R^j is half that of the other two to reflect its displacement. The %+ and As signais are then combined to give the X co-ordinate of the interaction:
X = k\
x - x
(1
.2
)Y E nergy X- X
D ifferen ce S u m m ation D iffer en ce
C ircuit C ircuit C ircuit
Figure 1.2. Anger Camera Logic Circuit
Chapter 1: Gamma Ray Imaging Systems
The Z channel signal is obtained by combining the signals from all photomultipliers via resistances Rj through to Rj which are all of equal value. The Z signal is proportional to the total amount o f light produced by the interaction in the crystal. This signal is sent (possibly via an amplifier) to a single channel analyser (SCA) which determines if the photon is within a pre-defined energy window centred around the expected photopeak of the incident gamma ray. The lower level o f this window is set to reject scattered photon events from being recorded. These would degrade spatial resolution in the image. Signals resulting from the total (photoelectric) gamma ray absorption within the crystal are then accepted by the signal processing and contribute towards forming an image.
Historically, the X and Y signals applied to the X and Y deflection plates of a cathode ray tube (CRT). The signals were shaped to create 2-4 |xs pulses, capable of holding the electron beam o f the CRT in the desired position. If the Z signal was accepted, the electron beam would be turned on for a few |is to create a flash of light in the desired location on the CRT. The Z signal is also used to normalise X and Y signals (equations 1.1 and 1.2 ). This is necessary in order to prevent the situation where low energy y emitting radionuclides, which generate less scintillations per event, produce smaller X and Y signals and hence smaller images. This also permits systems equipped with several SCA's, to perform simultaneous acquisition o f data from multiple photopeaks. Many modem systems are now totally digital. The analogue data from the gamma camera photomultiplier tubes is digitised at the camera head to minimise noise effects (Ott 1988). The analogue image is thereby replaced by a high resolution digital image.
One variation on the standard gamma camera is worth noting. A multicrystal gamma camera has been also been developed (Grenier et al 1974). This uses an array of small detector elements to cover a large imaging area. This has been commercially known as the "Autoflouroscope" or "System 70". The detector consists o f an array of 294 Nal scintillation detectors arranged into 14 x 21 elements. Each element measures 0.8 cm X 0.8 cm x 3.8 cm thick. Scattering between crystals is minimised by placing lead shielding between them. The collimator may be a pinhole or multihole type. Each crystal is coupled to a photomultiplier tube by a light guide. Photomultiplier tubes are connected in such a way that there is one tube for each row and one tube for each column. Gamma ray interactions are therefore localised by examination o f which combination of row and column received the light from the scintillator. The main advantage of the multicrystal system is increased count rate capability. This is achieved because each photomultiplier tube operates essentially independently of the others. Thus the possibility of pulse pile up is avoided. The count rate ability of the device is
Chapter 1: Gamma Ray Imaging Systems
approximately 250 kcps as oppose to 100 kcps in the conventional gamma cameras used at the time o f development. This device also offers greater detection efficiency for gamma rays with energy greater than 200 keV due to the increased Nal thickness. A disadvantage of the multicrystal system is its energy resolution. This is due to light loss in the light guide system. The energy resolution is around 50% for a photon energy of 140 keV. The concept has more recently been extended to a single 20.3 cm x 20.3 cm 2.54 cm thick Nal crystal that is slotted into an equivalent array of 20 x 20 elements. An array of 115 photomultiplier tubes are coupled directly onto the back of the crystal. Localisation of gamma ray interactions is performed in the same way as in the conventional gamma camera.
1.3.4 Imaging Techniques
In normal use the gamma camera forms a planar image i.e. a two dimensional representation of a three dimensional scene. However more recently the development of single photon emission tomography (SPET) has made three dimensional imaging possible (Barrett 1986). This technique uses a rotating gamma camera fitted with a parallel hole collimator. The camera rotates around the object to be imaged with its face parallel to the axis of rotation taking images at equally spaced angles. A particular row in each projection may be assumed to arise from a single transverse slice through the object. Information on the depth of the radioactivity within the object is obtained by backprojecting all angular projection data for that slice. Recent developments in this field have seen the introduction of multiheaded systems (more than one camera) in order to increase the number o f lines along which gamma rays can be detected simultaneously. This significantly increases the sensitivity. As patient dose must be kept to a minimum, this increased sensitivity may then be traded off for improved spatial resolution with lower sensitivity high resolution collimators (Moore 1992).
Chapter 1: Gamma Ray Imaging Systems
1.3.5 Gamma Camera Collimators
The geometrical field of view of the camera is defined by the lead collimator placed over the crystal face. Gamma rays cannot be focused like optical photons. In order to form an image there must a one to one correspondence between the direction of emission of a gamma ray from a radioactive source and its point of detection. Therefore, most practical gamma ray imaging systems employ the principle o f absorptive collimation for image formation. The collimator of a gamma camera is the means for achieving this. An absorptive collimator projects an image o f the source distribution onto the detector by allowing only those gamma rays travelling along certain directions to reach the detector. In theory gamma rays not travelling in the allowed direction are absorbed by the collimator before they reach the detector (although in practice, some will penetrate the collimator). This projection by absorption technique is an inherently inefficient method for utilising radiation because most of the potentially useful radiation travelling towards the detector is actually stopped by the collimator. This is one of the underlying reasons for the relatively poor quality o f radionuclide images compared to radiographic images. Typically for 10^ photons emitted only one is detected (Moore 1992) in medical studies. Consequently, there is a significant reduction in image quality. This affects both the spatial resolution and image contrast.
The gamma camera collimator consists o f a lead plate with either a single or regular array of shaped holes passing through it. The most common hole shape is the hexagon as this allows the most efficient packing although circular and triangular holes have been used in the past. There are four main designs of collimator available; pinhole, parallel hole, diverging hole and converging hole. The choice of collimator depends on the investigation being carried out. The four general categories of collimator are shown in Figure 1.3. A more detailed explanation o f those relevant to industrial imaging is given in Chapter 2.
The original design o f the gamma camera used a pinhole collimator (Anger 1958). This is shown in Figure 1.3a. Pinhole collimators offer very good resolution and efficiency at close distances, but the field of view decreases rapidly with increasing source to detector distance. This effect produces changes is resolution and efficiency, which can introduce distortions in images e.g. source planes of a three dimensional object at different distances from the collimator are magnified by different amounts. Pinhole collimators are mainly used for imaging small organs that can be positioned close to the detector. They can also be of use in imaging high energy gamma rays because the single hole design does not suffer from penetration of radiation between neighbouring holes. However, there may be some penetration through the edge of the aperture.
Chapter 1: G am m a Ray Im aging System s
a) Pinhole Collimator
Nal Crystal
b) Parallel Hole Collimator
Nal Crystal
Nal Crystal Nal Crystal
/ / I I W
XAI/f
c) Diverging Hole Collimator d) Converging Hole Collimator
Figure 1.3. Anger Camera Collimator Geometries
The most widely used collimator is the parallel multihole design (Figure 1.3b).
In planar imaging a three dimensional distribution of radioactivity is represented as a
two dimensional image called the projection. A parallel hole collimator has the property
that each point on the projected image has a value equal to the number of detected
gamma rays that travelled through the corresponding collimator hole. Assuming no
scatter occurred, the detection of a gamma ray indicates that a source of radioactivity
existed somewhere along the line through the collimator hole. The depth of the source
along the line is not known. However, the size of the image is independent of the
distance between the source and the collimator. This is an advantage in clinical
diagnostic situations where an organ lies at an unknown depth and its size is to be
determined (Anger 1964) and is the major reason for its widespread use.
Diverging multichannel collimators (Figure 1.3c) were first devised to allow
larger area images to be obtained than those possible with a parallel hole collimator
(Muehllehner 1969). This reduced the need for combining several images from a
parallel hole collimator which introduced errors from both exposure time and relative
positioning. Early diverging collimators consisted of multichannel collimators with
radially diverging holes of uniform diameter. The converging side faces the camera
while the diverging side faces the object. The development of larger area detectors has
now reduced the use o f diverging collimators. The size of the image on the detector
C hapter 1: Gamma Ray Imaging Systems
changes with distance from the collimator and so images may become distorted as in the case of the pinhole collimator.
Converging collimators (Figure 1.3d) were originally developed to increase the resolution of radionuclide images (Rudin 1971). These collimators traded off field of view for improved image resolution. The design was based on inverting the diverging collimator (Moyer 1974). Thus early designs consisted o f an array o f radially converging holes of uniform diameter. Other types of converging collimator have more recently found use in single photon emission computed tomography (SPECT). Fan beam collimators were the first to be investigated for this purpose (Jaszcak 1979). These collimators have parallel hole collimation in one direction and converging collimation in the other. Focusing is in achieved in a line parallel to the axis o f rotation of the camera. This provides more efficient utilisation of the active detector surface. Cone beam collimators have also been developed for SPECT (Jaszcak 1986). In this design, the collimator consists of an array of holes that focus in both directions. This has the property that the collimator focuses to a point as oppose to line in the case of the fan beam design. Converging collimators also suffer from image distortion because image magnification depends upon source to collimator distance.
1.4 The Compton Camera
1.4.1 Compton Camera Overview
The Compton camera is a gamma ray imaging device that uses a technique known as electronic collimation. The first incarnation o f the instrument was proposed by Todd et al (1974) for use in the medical field. This version used the principle of electronic collimation as an alternative to the mechanical (absorptive) collimation conventionally used in the gamma camera. There were three main incentives for developing such a device for medical imaging:
i) To increase the range of isotope energies available for gamma ray imaging. The optimum energy for the conventional gamma camera is around 140 keV. Photons of this energy may undergo scattering within the object (body) before they reach the detector. This degrades image quality as the original trajectory of the photon may not be determined. However, this scattering effect is inversely proportional to energy. If the energy o f the isotope is increased, scattering is reduced and hence spatial resolution may be increased.