Nutrition and Dietary Supplements
Dove
press
R e v i e w
open access to scientific and medical research
Open Access Full Text Article
Personalized nutrigenomics: tailoring the diet
to the aging diabesity population
Douglas M Ruden1
Xiangyi Lu2
1wayne State University, Department of Obstetrics and Gynecology, C. S. Mott Center for Human Growth and Development, institute of environmental Health Sciences, Detroit, Mi, USA; 2institute of environmental Health Sciences, eugene Applebaum College of Pharmacy and Health Sciences, Detroit, Mi, USA
Correspondence: Douglas M Ruden wayne State University, Department of Obstetrics and Gynecology, C. S. Mott Center for Human Growth and Development, institute of environmental Health Sciences, Detroit, Mi, USA Tel +1 313 577 6688
email douglasr@wayne.edu
Abstract: According to the International Diabetes Federation (IDF), 190 million people worldwide suffer from diabetes, and this number is estimated to double by the year 2025. Diabetes is especially prominent in the elderly population because the IDF indicates age above 45 years as a major risk factor for diabetes. The most common trials for controlling diabetes focus on tighter glucose control as a means to reduce the long-term complications. However, whether tight blood sugar control or other dietary or pharmaceutical interventions in the elderly are more appropri-ate is not known. Major changes have taken place in our diet over the past 10,000 years since the beginning of the Agricultural Revolution, but our genes have not changed. Furthermore, the large numbers of diabetic elderly in the population are a recent phenomenon, because those with diabetes have historically died young. Genetically speaking, humans today live in a nutritional environment that differs from that for which our genetic constitution was selected. For example a high omega-6/omega-3 ratio, found in today’s Western diets, promotes the pathogenesis of many chronic diseases, including cardiovascular disease and diabetes. Knowing who is at risk would be useful if it meant that one could avoid the environmental triggers that convert susceptibility to disease. The prospect of targeting specific dietary treatments at the elderly, who are predicted to gain the most therapeutic benefits, clearly has important clinical and economic consequences. In this review, we will discuss modern molecular genetic and epidemiological techniques which are now, or soon will be, made available by inexpensive whole-genome sequencing and other whole genome approaches to treat the elderly diabetic population.
Keywords: diabetes, elderly diabetic population, DNA, genome sequencing
Introduction
The number of people suffering from diabetes currently stands at 190 million worldwide, and this number is estimated to double by the year 2025 (http://www.diabetesatlas.org). The elderly diabetic population is increasing every year as the baby boom population peaks, yet we do not know the appropriate dietary interventions to treat this population. Strict glucose control is the treatment of choice in young diabetics, but this is not necessarily the optimal treatment in the elderly.1 Furthermore, a dietary intervention
in one person might not work in another person because they have a different genetic composition.2–10 It is even possible that a dietary intervention in one elderly
identi-cal twin might not work in the other twin because they have a different epigenetic composition that is represented by the “DNA methylome” or the whole genome DNA methylation profile.11–15
Several reviews discuss dietary interventions to treat the diabetic population, and a few have focused on the elderly diabetic population.16–20 However, this review is unique
Nutrition and Dietary Supplements downloaded from https://www.dovepress.com/ by 118.70.13.36 on 25-Aug-2020
For personal use only.
Number of times this article has been viewed
This article was published in the following Dove Press journal: Nutrition and Dietary Supplements
Dovepress
Ruden and Lu
because we will propose future studies based on inexpensive whole genome sequencing technologies to develop a per-sonalized nutrigenomic based therapy to treat the elderly diabetic population. We will describe how whole-genome sequencing is done, and how one can correlate individual nutrients to changes in gene expression and DNA methyla-tion patterns. With this informamethyla-tion, we will describe how one can determine the optimal nutrients an elderly diabetic person needs to maximize his or her health.
History of treating the diabetic
population
Before Banting and Best used insulin to treat diabetes in humans in 1922, for which they won the 1923 Nobel Prize in Physiology and Medicine,21 the preferred treatment of
dia-betes was starvation therapy.21,22 Those with type 1 diabetes
lack insulin, usually because the islet cells in the pancreas were destroyed, in most cases, by an autoimmune reaction.23,24
Insulin is secreted by the islet cells in the pancreas after a person eats, thereby activating glucose channels throughout the tissues of the body that move glucose from the blood to inside the cells to restore energy levels.25–28 In the absence
of insulin, the body’s glucose metabolism is thrown into disarray because glucose does not get pumped into the cells appropriately. Starvation, on the other hand, bypasses the insulin-signaling pathway because, even in healthy people, insulin is not produced at very high levels. Consequently, starvation therapy or otherwise severe caloric restriction allows a diabetic, even in the absence of insulin treatment, to survive an otherwise lethal disease.21 Unfortunately, prior
to the development of insulin, those suffering from diabetes would usually die in their teens to early to late 20s because of other complications caused by diabetes.
Therefore the elderly diabetic population is a relatively recent phenomenon. Children who were born after 1934 are in their 70s and 80s now, whereas children born 1 or 2 decades before 1934 would have died at a young age because of the complications of diabetes. Since this population overlaps with the baby boom population born between 1945 and 1962, this means that in the next decade or two, we will be having an explosive growth of elderly with diabetes.
Fortunately, we are just beginning a new revolution in biol-ogy called personalized medicine,29–33 which includes nutritional
genomics.34–44 Nutritional genomics utilizes whole genome
sequencing, gene expression, and DNA methylation technolo-gies to best define the optimal medicine or diet to maximize human health. A medicine or diet will soon be customized for the individual based on his or her genome sequence.
Fad diets are not the answer
In an earlier review, I proposed a “Dietary Ames Test” to validate the efficacy of fad diets.45 I was concerned that
people, mostly without any scientific credentials, were pro-posing often dangerous and ill-conceived radical changes in a person’s diet to control the obesity epidemic. For example, the Atkin’s Diet proposes that one eats mostly meats and fats and very few carbohydrates.46 In contrast,
the South Beach Diet proposes that one eats very few meats and fats.47 In our “Dietary Ames Test” we fed Drosophila
either pure ground beef diets or other types of extreme diets and we found, not surprisingly, that these diets dramati-cally reduced the lifespan of the fruitflies.48 This was not
surprising, at least to us, because most dieticians prescribe a well balanced diet that includes both carbohydrates and fats. While the so-called “food pyramid” often changes in details over the decades, the well-rounded advice is always given.
Most nutritionists believe that the only way to reduce weight, and thereby decrease the risk of type 2 diabetes, is to reduce the caloric intake. The reason that the Atkin’s or South Beach diets work to some extent is that the person on the diet presumably reduces his or her caloric intake. However, everyone responds to a particular nutrient differ-ently and it would be helpful to understand how a person’s genetic makeup influences his digestion of a particular nutri-ent. To take an extreme example that is commonly known, someone with phenylketoneuria (PKU) cannot metabolize phenylalanine.49–51 Consequently, if someone with PKU is
given a diet rich in phenylalanine, they will get very sick because of a toxic buildup of this amino acid. Therefore, for many years, a newborn’s blood has been tested for the genetic mutation that causes PKU.52,53
The easiest way to think about what personalized nutrigenomics is to imagine that everyone on earth has some sort of PKU-like disease to a minor or severe extent. In fact, each individual probably has not only a single PKU-like disease, but potentially dozens or hundreds of such diseases.54,55 Food containing phenylalanine is bad
for PKU patients. Maybe for you, omega-3 fatty acids are especially toxic because they cause your triglyceride levels to rise dramatically, for instance. Maybe for someone else, omega-6 fatty acids have this effect. At this point, this is purely hypothetical, but we will soon be able to determine the diet-by-gene-by-phenotype (D × G × P) interactions on a genome-wide scale for large populations. For the purposes of this review, we will focus on the elderly diabetic population.
Nutrition and Dietary Supplements downloaded from https://www.dovepress.com/ by 118.70.13.36 on 25-Aug-2020
Dovepress Personalized nutrigenomics for the aging diabesity population
How whole genome sequences
are obtained
What makes personalized medicine and nutritional genomics possible is the advent of inexpensive whole-genome sequencing. In the 1980s and 1990s, DNA sequencing was done 1 DNA molecule at a time. First, in “Maxam and Gilbert” or “chemical sequencing” the phosphodiester bond was broken chemically at particular bases and the end-labeled DNA was run on a long polyacryamide gel – each lane with a separate reaction.56 An investigator, usually a technician or a
graduate student, would spend endless hours deciphering each G, A, T, and C. Next came Sanger or “dideoxy sequencing” where a primer annealed to single-stranded DNA and DNA sythesis was terminated by dideoxy nucleotides that had a Hydrogen (H) at the 3′ position of the ribose ring to terminate transcription.57 Again, the end-labeled DNA fragments were
separated on a long polyacrylamide gene with 1 reaction per lane (ddG, ddA, ddT, and ddC lanes). Next, came the advent of capillary DNA sequencers where the ends of the dideoxy nucleotide reactions were labeled with different colors for G, A, T, and C and the mixture was size separated on long and thin capillaries filled with a liquid-based matrix.58 The sequence
was measured automatically by detecting the color of the DNA fragment that ran off the end of the capillary tube.
Capillary sequencing is very accurate and sufficiently powerful to allow the successful completion of several model genomes and even the human genome.54 However, it was not
until the advent of so-called “next-generation” sequencing that made whole genome sequencing affordable for the indi-vidual laboratory.59 The first human genome sequence cost
over US$1 billion dollars, but next generation sequencing has enabled the National Institutes of Health to sequence an entire human genome for under US$1000.60 With instruments
that are on the market today, the cost of a human genome sequence is in the US$10,000 to US$20,000 range, but in the next few years, the goal of the “$1000 genome” is expected to be reached.
The next generation is similar to dideoxy sequencing, but rather than sequencing a few dozen DNA molecules at a time, depending on how many capillaries are on the instrument, several million DNA molecules are sequenced simultaneously. What is done on the Solexa HiSeq2000 is to load a DNA library onto a flow cell that contains more than 60 million oligonucleotides, which anneal to each probe in the library (Figure 1A).61 Sequencing is done 1 base at a
time, in a process called “sequencing by synthesis”. As with capillary sequencing, fluorescent labeled nucleotides, each base being a different color, are added to the flow cell.
However, unlike capillary sequencing, only a single base is added after each reaction because the fluorescent molecule is at the 3′ position on the ribose base and therefore termi-nates DNA replication. At this point, a picture of the more than 60 million colored dots is taken and each of the 4 colors corresponds to the first base sequence for that molecule in the library. This is done currently for up to 150 nucleotides for each molecule in the library. The library is constructed in such a way that 150 nucleotides can also be sequenced from the other end of each molecule in the library, giving a total of 300 nucleotide sequences for 60 million clones in the library, or roughly 18 billion nucleotides of DNA sequence from a single lane in the flow cell (http://www.illumina. com/systems/hiseq_2000.ilmn). Since the HiSeq2000 has 16 lanes, 8 lanes in each of 2 flow cells, a single run of this instrument, which takes more than 1 week, can gener-ate almost 300 billion nucleotides of DNA sequence. The human genome is approximately 4 billion nucleotides, so that a single run should produce a ∼75× coverage of 1 human genome, which is sufficient for detecting most SNPs. Because upgrades on the HiSeq2000 instrument occur several times per year, it is likely that several human genomes can be sequenced to a sufficient depth for each run of the instru-ment. At the time of this review, the largest purchaser of the HiSeq2000, which is the most popular of next-generation DNA sequencers, is BGI (which changed its name from the Beijing Genome Institute). This organization is part of the plan of the Chinese government to modernize its economy (www.genomics.org.cn).
While powerful and fast, it is not likely that instru-ments such as the HiSeq2000, or a competing instrument from Roche called a 454 Sequencer, will bring the cost of a human genome sequence to under US$1000 (www.454.com). What should succeed, are so-called “third-generation DNA sequencers”, which can sequence individual DNA molecules without amplification. The Illumina and Roche instruments require “polony” amplification,62 which is a polymerase chain
reaction (PCR) amplification on a solid surface (Illumina) or in a microsphere. Such polony (short for PCR colony) amplification is required because the current detectors are not sensitive enough to detect a single DNA molecule. However, third-generation DNA sequencers, such as one recently on the market from Pacific Biosciences (PacBio), can detect single molecules by using different technologies (www. pacificbiosciences.com). The PacBio instrument uses a DNA polymerase attached to the bottom of a wave guide in which a DNA molecule is replicated.63–65 As the DNA is replicated,
the sequence is determined by the amount of time each base
Nutrition and Dietary Supplements downloaded from https://www.dovepress.com/ by 118.70.13.36 on 25-Aug-2020
Dovepress
Ruden and Lu
takes to be added to the growing change – each of the 4 bases, G, A, T, C, has a unique time signature (Figure 1B). Remark-ably, this instrument can even sequence 5-methyl-cytosine and 5-hydroxy-methyl-cytosine, the so-called 5th and 6th bases,66 because they too have a unique time signature that
differs significantly from the other 4 bases.675mC and 5hmC
will be discussed further in a later section.
The PacBio third-generation DNA sequencer is, like the second-generation sequencers, a “sequencing-by-synthesis” machine because the DNA needs to be replicated to be sequenced. A more radical type of third-generation DNA sequencer does not replicate the DNA, but rather sequences
the DNA molecules as they pass through nanopores which are only wide enough for a single stranded DNA fragment to pass through.68–73 The nanopore technology “reads” the DNA
sequence by measuring the conductance changes as the DNA threads its way through the nanopore (Figure 1C).
In summary, the second-generation DNA sequencers have already made whole genome DNA sequencing afford-able to the average laboratory. The third-generation DNA sequencers, when they are further developed, promise to bring the cost of whole genome sequencing down to what is affordable to the patient or health care provider. When large enough numbers of patient DNA sequences are available,
A
B
C
5’ end
5’ end
G A T C mC hmC
Time (msec)
G A T C mC hmC
Conductance
Figure 1 Second- and third-generation sequencing methods. A) Sequencing by synthesis with the Infinium HiSeq2000 system. Each base is added one at a time. B) Sequencing by time with the Pacific Biosciences single molecule third-generation sequencing system. The DNA polymerase is anchored to the bottom of a wave guide (blue) while the DNA is replicated. Each base has a distinct time interval (shown schematically, but not accurately). C) Sequencing by conductance with a nanopore (hexagon). As the single stranded DNA passes through the nanopore, conductance is measured. Each base has a distict conductance (shown schematically, but not accurately).
Nutrition and Dietary Supplements downloaded from https://www.dovepress.com/ by 118.70.13.36 on 25-Aug-2020
Dovepress Personalized nutrigenomics for the aging diabesity population
the era of personalized medicine and personalized nutrition will be here. While many details still need to be worked out, this era will be here within the next couple of years.
Quantitative trait nucleotides
can be identified in the elderly
diabetic population
Quantitative trait nucleotides (QTNs) are nucleotide poly-morphisms that significantly correlate with a quantitative trait.74 The most famous example of a QTN is a single
nucleotide polymorphism (SNP) (from an A to a T), which changes the sixth codon of the hemoglobin gene (from a glutamic acid to a valine) and thereby alters the protein so that it causes sickle cell anemia. Linus Pauling discovered this in 1949 by direct protein sequencing, which is the first example of a characterized genetic disease.75 If the normal
allele is called H and the sickle allele is called S, then H/H and H/S people will be normal, but S/S people will develop sickle cell anemia. In other words, the SNP that causes the S allele is a QTN for sickle cell anemia. However, the SNP that causes the S allele is also a QTN for malaria resistance because H/H people will develop malaria but H/S people are resistant to malaria.
The goal of QTN analysis in the elderly diabetic popula-tion is to find SNPs that correlate with a phenotypic outcome. For example, if you sequence the genomes of 1000 patients with diabetes and 1000 patients without diabetes, and you identify an SNP that is present in all 1000 diabetic patients but in none of the non-diabetic patients, then you have a 100% correlation between that SNP and diabetes (ie, r= 1.0;
P= 0). Of course, in real life, such perfect correlations rarely occur, but one need only search for SNPs that have a highly significant correlation (eg, r= 0.94; P= 0.001 after multiple comparisons correction).
How would one identify QTNs? The 1000 human genome project has identified more than 70 million SNPs in the human population, as well as millions more inser-tions and deleinser-tions and other rearrangements.55 One could
identify QTNs by making a chart of all 70 million SNPs on the x-axis and then the LOD score (logarithm [base 10] of odds) on the y-axis (Figure 2). On the y-axis, there is also a dashed line that indicates the significance threshold that you set for identifying SNPs (such as 0.001 after multiple comparisons corrections). Therefore, any of the 70 million SNPs with LOD scores that extend above the threshold are, by definition, QTNs.
Why are QTNs useful? QTNs are useful because one can infer from the genome sequence of an elderly patient,
his or her risk for developing diabetes later in life. QTNs are also helpful in characterizing quantitative trait transcripts (QTTs) and other types of quantitative traits described in the next sections.
Gene expresson patterns vary
from individual to individual
The first method to be used in personalized medicine and personalized nutrigenomics is called quantitative trait tran-scripts or QTT.45,76–79 In the QTT method, whole genome
expression profiles are done for a large number of patients from a particular biospecimen – the more specific the bio-specimen, the better. For example, CD4+ blood cells would be better than whole blood, and deep abdominal adipocytes would be better than less-specifically isolated adipocytes. Alternatively, if one is working with induced pluripotent stem cell (iPSC) derived tissues, which will be described in a later section, then cells of a particular type should be isolated as purely as possible.
The whole genome expression profiles are traditionally done by DNA oligonucleotide arrays, or DNA microarrays or gene expression arrays for short, which were first developed in 1987.80 Miniaturized versions were developed in 1995 by
Donald Brown laboratory at Stanford.81 In DNA microarrays,
1 or several oligonucleotides, which are complementary to each of the 20,000 or more genes in humans, is arrayed on a slide. Relative gene expression levels are determined by fluorescent labeling of cDNAs, made from purified mRNA isolated from the tissues, and then hybridizing the labeled-cDNA to the oligonucleotide arrays.81
6 5 4 3 2
1
0 −1 −2
−3 −4 −5 −6
SNPs associated with a decrease in glucose resistance SNPs associated with an increase in glucose resistance
LOD score
Figure 2 Quantitative trait nucleotide (QTN) analysis of glucose tolerance. The ∼70 million single nucleotide polymorphism (SNPs) in the human genome are aligned in order along the x-axis. SNPs associated with glucose tolerance are shown above the line (green) and genes associated with glucose intolerance are shown below the line (red). LOD (logarithm [base 10] of odds) score is the y-axis (see text).
Nutrition and Dietary Supplements downloaded from https://www.dovepress.com/ by 118.70.13.36 on 25-Aug-2020
Dovepress
Ruden and Lu
A more precise and arguably more quantitative approach to quantify the amount of mRNA from a tissue is to use the next-generation DNA sequencing technology described in the previous section. Here one would sequence the cDNA directly with the instrument. The advantage of next-generation sequencing cDNAs, also called RNA-Seq, is that one can also measure alternative transcription start points and alternative splicing products in the genes.65,82–84
Some of these products might be patient specific and would be missed by the DNA microarrays. Also, the RNA-Seq technique is thought to be accurate over 2 to 3 logs of expression levels (ie, 100- to l000-fold) whereas DNA microarrays are accurate only within a single log (ie, 10-fold or fewer changes in expression). The RNA-Seq technique is also called “digital gene expression” because one can normalize the amount of expression for a particular gene or splice product simply by counting the number of sequenced molecules. Complex normalization techniques must be done with DNA microarray data because each array would have a different amount of total fluorescence because of labeling differences and other artifacts of cDNA synthesis. Nevertheless, gene expression arrays still have many advocates because they are currently less expensive and the data is more automated and therefore easier to analyze than RNA-Seq, and RNA-Seq has its own artifacts of hotspots and cold spots for regions of the cDNAs that are sequenced.85
Finally, when one has completed the gene expression analyses of a large number of patients from a specific tissue, then one can identify QTTs. QTTs are transcripts that have a one-to-one match with the phenotype that is being inter-rogated. For example, if the phenotype in question is the degree of change in triglyceride levels after eating 10 g of omega-3 fatty acids every day for 1 month, then one could arrange the 1000 patients in order of the change (Figure 3). For the sake of argument, let us say that 500 patients have an increase in triglyceride levels in their whole blood and 500 patients have a decrease in triglyceride levels in their whole blood. A QTT would be a transcript that most closely matches the phenotype by a statistical technique called regression analysis, developed by Legendre in 1805,86 and by Gauss
in 1809.87 A perfect one-to-one match between the degree of
triglyceride change and a change in gene expression in whole blood would have a correlation coefficient of 1.0 (r= 1.0;
P= 0). Of course, in real life with real data, perfection is never achieved and one would see a highly significant cor-relation coefficient (eg, r= 0.92; P= 0.001, after multiple comparisons correction).
What is a QTT? There are actually 2 main types of QTTs, so-called “hub” genes and “spoke” genes. As their names imply, hub genes are more important because they are the master regulators of many other genes, the spoke genes (think of a bicycle wheel). Hub genes and spoke genes can be functionally validated in model organisms by knocking out or over expressing the genes. If a hub gene is over expressed, for instance, then all of the spoke genes will be over expressed, too. However, if a spoke gene is over expressed, it will not have any effect on the hub gene or the other spoke genes.
What are hub genes? Hub genes are master regulatory molecules that regulate expression of a large number of spoke genes. They could be transcription factors (either positive or negative), translation factors, or any one of a number of proteins in a key signaling pathway. Spoke genes can be fur-ther characterized by looking for conserved motifs in eifur-ther the promoter region (for transcription factors) or in the 3′
untranslated regions of the genes (for translation regulators). If a common motif is identified, then the hub gene is likely to function (either directly or indirectly) through the motif. Again, this can be validated in model organisms or human tissue culture cell systems.
Why are hub genes important? Hub genes are important because they are the master regulators of the spoke genes, and therefore are prime targets for nutritional or pharmaceutical interventions. For example, if the hub gene encodes a tran-scription factor that activates a large number of lipases, and a drug causes the activation of this transcription factor, then
Glucose resistant
Glucose intolerant Gene X mRNA level increases
Gene X mRNA level decreases Drug decreases
mRNA levels
Drug increases mRNA levels
Patient-1 Patient-2 ...
Patient-1 Patient-2
Patient-100
Patient-100
Drug effective Drug not effective
Change in mRNA level after drug
+
0
−
Diabetse- related function after drug
+
0
−
Figure 3 Quantitative trait transcripts (QTT) associated with diabetes. Red, gene expression changes arranged in order of most negative change to most positive change after dietary intervention in 100 patients. Blue, diabetes related function (such as glucose tolerance) arranged in order after dietary intervention. A one-to-one correspondence between the patients in the red and blue lines represents a perfect (100%) correlation.
Nutrition and Dietary Supplements downloaded from https://www.dovepress.com/ by 118.70.13.36 on 25-Aug-2020
Dovepress Personalized nutrigenomics for the aging diabesity population
the large number of lipases will increase in activity. If, on the other hand, a drug is developed that activates a single one of the lipases (on one of the spokes), then that drug will probably have much less efficacy than the drug that targets the transcription factor (ie, the hub).
In the next few sections, we will discuss other bioin-formatic approaches that are similar to the QTT approach. The ultimate goal of this review is to find an approach, or approaches, which allows one to identify the optimal person-alized diet for the elderly diabetic population.
DNA methylation patterns
reflect the environmental input
on the genome
In addition to QTTs, described in the previous section, one can also measure quantitative trait methyl-cytosines (QTmC)
and quantitative trait hydroxymethyl-cytosines (QThmC).
5-methyl-cytosine (5mC) and 5-hydroxymethyl-cytosine
(5hmC) are called the “fifth base” and the “sixth base” because
they are covalent modifications of the DNA that can be rec-ognized by nuclear proteins, and because they have distinct functions in regulating gene expression.88
5mC in the promoters of DNA tends to turn off
expres-sion of the gene by either binding methyl-binding proteins which recruit histone deacetylases and other inhibitors of transcription, or by blocking transcription factors, such as AP1, from binding to the promoter.89–91 The human genome
has 70% to 80% methylation of all of its CpGs, but most of these CpGs are in transposons that are methylated to prevent their expression, and in gene bodies and inter-genic regions that do not affect transcription of the gene ( Figure 4). The promoters of more than half the human genes have “CpG islands”, which have a relative enrich-ment of CpGs (ie, GC content) that are under methylated relative to the rest of the genome. In fact, the degree of methylation in the CpG island is inversely proportional to its degree of expression, ie, the more under methylated, the higher the gene expression.
The pattern of DNA methylation throughout a cell, which differs from tissue to tissue, is called the DNA methylome.92–95 The DNA methylome also differs from
person to person, but is nearly identical in newborn identical twins.96–102 However, as the twins age, the DNA methylomes
drift further and further apart, presumably because the DNA methylome may reflect the different environments that the twins inhabit during their lifetimes.
DNA hydroxymethylation was discovered in 2009 by 2 laboratories – Anjana Rao’s laboratory at Harvard103
and Nat Heinz’s laboratory at the Rockefeller Institute.88
These laboratories found 5hmC at relatively high levels
in embryonic stem cells (ESC) and in Purkinje cells, which are among the largest neurons in the mamma-lian brain. One hypothesis is that 5hmC is how 5mC gets
“de- methylated” by the enzyme TET (ten-eleven trans-location) which converts 5mC to 5hmC by an oxidation
reaction.103 There is no known enzyme that converts 5hmC to C, nor are there any known 5hmC binding proteins,
but 5hmC modified DNA cannot bind to methyl binding
proteins or DNA methyl transferases (Dnmts), so that they would lead to “passive” de-methylation as the DNA replicates several times.90
One can analyze the DNA methylome or DNA hydroxym-ethyome using second and third-generation DNA sequencing technologies. The chemical bisulfite (BS) converts Cs to Us but does not affect 5mCs efficiently. Therefore, in the
second-generation BS-Seq technique, one converts the entire genome Cs to Us with BS and then shotgun sequences the entire genome. In the third-generation DNA sequencing technique, as described in an earlier section, one can directly sequence the 5mCs and 5hmCs based on the physical and chemical
prop-erties of these bases.67
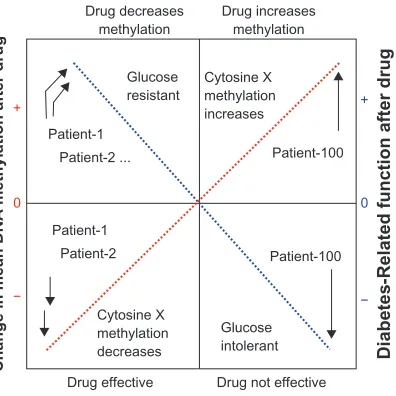
How does one perform QTmC and QThmC? One can
identify quantitative differences in DNA methylation and hydroxymethylation at all of the cytosines in a large popu-lation, such as a large elderly diabetic population for the purposes of this review. One can then perform regression
Glucose resistant
Glucose intolerant Cytosine X methylation increases
Cytosine X methylation decreases Drug decreases
methylation
Drug increases methylation
Patient-1 Patient-2 ...
Patient-1 Patient-2
Patient-100
Patient-100
Drug effective Drug not effective
Change in mean DNA methylation after drug
+
0
−
Diabetes-Related function after drug
+
0
−
Figure 4 Quantitative trait methylation (QTM) associated with diabetes. Red, DNA methylation changes arranged in order of most negative change to most positive change after dietary intervention in 100 patients. Blue, diabetes related function (such as glucose tolerance) arranged in order after dietary intervention. A one-to-one correspondence between the patients in the red and blue lines represents a perfect (100%) correlation.
Nutrition and Dietary Supplements downloaded from https://www.dovepress.com/ by 118.70.13.36 on 25-Aug-2020
Dovepress
Ruden and Lu
analysis, as described in the previous section, to identify DNA methylation and hydroxymethylation events, which are significantly correlated with phenotypic changes induced by a dietary compound, such as omega-3 fatty acid in the prior example (Figure 4).
Why is QTmC and QThmC information helpful? This
information is helpful because it can potentially identify tar-gets of the dietary compound in the genome. For example, it is known that nuclear hormone receptors can cause rapid methylation or demethylation of promoters.104–106
If one identifies 5mC or 5hmC changes in a nuclear hormone
binding site, then one could hypothesize that the nuclear hormone receptor is a direct or indirect target of the dietary compound. One could then use the quantitative degree of change in 5mC or 5hmC as a measure of the effectiveness of the
dietary compound on that elderly diabetic patient.
Metabolomic changes reflect diet
and vary according to genotype
In addition to the QTT, QTmC, and QThmC approaches
described earlier, one can also analyze the quantitative dif-ferences in metabolites after a dietary intervention. We call this approach “quantitative trait metabolomics” or QTM. The advantage of QTM is that one can directly correlate multiple metabolomic changes that occur when a person takes a dietary supplement in a large clinical trial.
QTMs are measured with a variety of techniques, but the most common technique is capillary electrophoresis followed by mass spectrometry (CE-MS). The metabo-lites from a tissue, such as whole blood or fat cells, are separated by capillary electrophoresis and then quantified and identified by mass spectrometry.107–112 Quantifying
the levels of the metabolites is difficult, but critical in the QTM approach because one needs to correlate changes in the metabolite with the phenotype being measured. In the example used throughout this review, an unknown metabo-lite can be correlated with changes in triglycerides (which are also metabolites) after omega-3 fatty acid ingestion for 1 month.
Why are QTMs important? QTMs are important because you might be able to identify a metabolite that leads directly to changes in triglyceride levels after ingesting a particular nutrient. One can then use the measure of the change in that metabolite as a direct functional readout in the efficiency of the nutrient in changing triglyceride levels. One might also design novel drugs based on that metabolite that efficiently change triglyceride levels in a manner than is customized for the individual elderly diabetic.
Stem cells will soon be used
in combination with nutritional
genomics to treat the elderly
diabeitic population
Induced pluripotent stem cells (iPSCs) were developed by Takahashi and Yamanaka in 2006 by introducing 4 stem cell genes into adult fibroblasts.113 This technology can
also be used in personalized nutrigenomics in the elderly diabetic population. The iPSCs can be made from a variety of somatic cell types, such as CD4+ blood cells,114–117 hair
root keratinocytes,118–120 or fibroblasts isolated from skin
plugs.121–124 The advantage of using iPSC over direct tissue
biopsies is that they can be converted to potentially any cell type in the body. For example, one can convert iPSC to neuroblasts by treating them with Noggin and other neuronal growth factors.125–127 This obviates the need to take biopsies
of the patients’ brains, which would be ethical only if the patient had needed brain surgery for some other ailment.
The iPSC from thousands of elderly diabetic patients can potentially be converted to any cell type in the body, and used to conduct QTT, QTmC, QThmC, and QTM experiments to identify how a particular nutrient or nutritional supplement affects transcription, DNA methylation or hydroxymethyla-tion, or the metabolome in that tissue. This will allow a doctor to understand how a particular nutrient affects any tissue in the body at the individual patient level.
Where does the future lie?
In this review, we discuss how nutritional genomics brought about by inexpensive whole genome sequencing will soon lead to a revolution in treating the elderly diabetic population. We should discover how the SNPs in a person could cause a change in susceptibility to a drug or a diet. The great potential of these techniques lies not only their individual power, but in their combined synergistic power when used simultaneously in a massive multidimensional experiment.
Once these experiments are conducted on a large elderly diabetic population with know genomic sequences and known DNA methylation patterns, then one can apply this knowledge to predict the effects on a patient in a test group, which was not part of the so-called “training group”.128 In other words,
a doctor can potentially send his patient’s tissue sample to a bioiformatics/sequencing laboratory and obtain a diet and drug regimen that is personalized and optimized for that patient. This is the future of personalized medicine and nutrigenomics in the elderly diabetic population.
Nutrition and Dietary Supplements downloaded from https://www.dovepress.com/ by 118.70.13.36 on 25-Aug-2020
Dovepress Personalized nutrigenomics for the aging diabesity population
Acknowledgments
This work was supported by the Environmental Health Sciences Center in Molecular and Cellular Toxicology with Human Applications Grant P30 ES06639 at Wayne State University, and NIH R01 grants (ES012933 and CA105349) to DMR.
Disclosure
The authors declare no conflicts of interest.
References
1. Rauseo A, Pacilli A, Palena A, De Cosmo SA. Management of type 2 diabetes in geriatric patients. J Nephrol. 2010;23(Suppl 15):S72–S79. 2. Bell JT, Timpson NJ, Rayner NW, et al. Genome-wide association scan
allowing for epistasis in type 2 diabetes. Ann Hum Genet. 2010;75: 10–19.
3. De Cosmo S, Minenna A, Zhang YY, et al. Association of the Q121 variant of ENPP1 gene with decreased kidney function among patients with type 2 diabetes. Am J Kidney Dis. 2009;53:273–280.
4. De Cosmo S, Prudente S, Andreozzi F, et al. Glutamine to arginine substitution at amino acid 84 of mammalian tribbles homolog TRIB3 and CKD in whites with type 2 diabetes. Am J Kidney Dis. 2007;50: 688–689.
5. Tokushige K, Hashimoto E, Noto H, et al. Influence of adiponectin gene polymorphisms in Japanese patients with non-alcoholic fatty liver disease. J Gastroenterol. 2009;44:976–982.
6. Tonjes A, Koriath M, Schleinitz D, et al. Genetic variation in GPR133 is associated with height: genome wide association study in the self-contained population of Sorbs. Hum Mol Genet. 2009;18:4662–4668. 7. Wu CK, Tsai CT, Chang YC, et al. Genetic polymorphisms of the angio-tensin II type 1 receptor gene and diastolic heart failure. J Hypertens. 2009a;27:502–507.
8. Wu X, Niu N, Brismar K, et al. Apolipoprotein M promoter poly-morphisms alter promoter activity and confer the susceptibility to the development of type 1 diabetes. Clin Biochem. 2009b;42:17–21. 9. Zhang D, Ma J, Brismar K, Efendic S, Gu HF. A single nucleotide
polymorphism alters the sequence of SP1 binding site in the adiponectin promoter region and is associated with diabetic nephropathy among type 1 diabetic patients in the genetics of kidneys in diabetes study.
J Diabetes Complications. 2009;23:265–272.
10. Zhou J, Xu B. Recent Patents of Nanopore DNA Sequencing Technol-ogy: Progress and Challenges. Recent Pat DNA Seq. 2010b; Nov 15. [Epub ahead of print].
11. Beyan H, Drexhage RC, van der Heul Nieuwenhuijsen L, et al. Monocyte gene-expression profiles associated with childhood-onset type 1 diabetes and disease risk: a study of identical twins. Diabetes. 2010;59:1751–1755.
12. Biegstraaten M, van Schaik IN, Aerts JM, et al. A monozygotic twin pair with highly discordant Gaucher phenotypes. Blood Cells Mol Dis. 2011;46:39–41.
13. Hannukainen JC, Borra R, Lindeborg K, et al. Liver and pancreatic fat content and metabolism in healthy monozygotic twins with discordant physical activity. J Hepatol. 2010; Sep 19. [Epub ahead of print]. 14. Thomsen SF, Duffy DL, Kyvik KO, Skytthe A, Backer V.
Relation-ship between type 1 diabetes and atopic diseases in a twin population.
Allergy. 2010; Dec 1. [Epub ahead of print].
15. Xian H, Scherrer JF, Franz CE, et al. Genetic vulnerability and pheno-typic expression of depression and risk for ischemic heart disease in the Vietnam era twin study of aging. Psychosom Med. 2010;72:370–375. 16. Albu JB, Heilbronn LK, Kelley DE, et al. Metabolic changes following
a 1-year diet and exercise intervention in patients with type 2 diabetes.
Diabetes. 2010;59:627–633.
17. Chen L, Caballero B, Mitchell DC, et al. Reducing consumption of sugar-sweetened beverages is associated with reduced blood pres-sure: a prospective study among United States adults. Circulation. 2010;121:2398–2406.
18. Colagiuri S, Vita P, Cardona-Morrell M, et al. The Sydney Diabetes Prevention Program: a community-based translational study. BMC Public Health. 2010;10:328.
19. Cooper-DeHoff RM, Wen S, Beitelshees AL, et al. Impact of abdomi-nal obesity on incidence of adverse metabolic effects associated with antihypertensive medications. Hypertension. 2010;55:61–68. 20. Luley C, Blaik A, Reschke K, Klose S, Westphal S. Weight loss in
obese patients with type 2 diabetes: effects of telemonitoring plus a diet combination – The Active Body Control (ABC) Program. Diabetes Res Clin Pract. 2010; Dec 16. [Epub ahead of print].
21. Wright JR Jr. Almost famous: E. Clark Noble, the common thread in the discovery of insulin and vinblastine. CMAJ. 2002;167:1391–1396. 22. Lawrence RD. Interactions of fat and carbohydrate metabolism-new
aspects and therapies: (Section of Therapeutics and Pharmacology).
Proc R Soc Med. 1941;35:1–10.
23. Cernea S, Dobreanu M, Raz I. Prevention of type 1 diabetes: today and tomorrow. Diabetes Metab Res Rev. 2010;26:602–605.
24. Smushkin G, Vella A. What is type 2 diabetes? Medicine. 2010;38: 597–601.
25. Bogan JS, Kandror KV. Biogenesis and regulation of insulin- responsive vesicles containing GLUT4. Curr Opin Cell Biol. 2010;22: 506–512.
26. Flanagan SE, Clauin S, Bellanne-Chantelot C, et al. Update of mutations in the genes encoding the pancreatic beta-cell K(ATP) channel subunits Kir6.2 (KCNJ11) and sulfonylurea receptor 1 (ABCC8) in diabetes mellitus and hyperinsulinism. Hum Mutat. 2009;30:170–180. 27. Vaidya HB, Goyal RK. Exploring newer target sodium glucose
trans-porter 2 for the treatment of diabetes mellitus. Mini Rev Med Chem. 2010;10:905–913.
28. Zaid H, Antonescu CN, Randhawa VK, Klip A. Insulin action on glucose transporters through molecular switches, tracks and tethers. Biochem J. 2008;413:201–215.
29. Mestroni L, Merlo M, Taylor MR, Camerini F, Sinagra G. Heart failure and personalized medicine. J Cardiovasc Medicine (Hagerstown). 2010; Sep 1. [Epub ahead of print].
30. Rosenson RS. New technologies personalize diagnostics and therapeutics. Curr Atheroscler Rep. 2010;12:184–186.
31. Ruden DM. Personalized medicine and quantitative trait transcripts.
Nat Genet. 2007;39:144–145.
32. Wilffert B, Swen J, Mulder H, Touw D, Maitland-Van der Zee AH, Deneer V. From evidence based medicine to mechanism based medicine. Reviewing the role of pharmacogenetics. Pharm World Sci. 2010; Nov 4. [Epub ahead of print].
33. Zaza G, Granata S, Sallustio F, Grandaliano G, Schena FP. Pharmacogenomics: a new paradigm to personalize treatments in nephrology patients. Clin Exp Immunol. 2010;159:268–280. 34. Barnes S. Nutritional genomics, polyphenols, diets, and their impact
on dietetics. J Am Diet Assoc. 2008;108:1888–1895.
35. Brown L, van der Ouderaa F. Nutritional genomics: food industry applications from farm to fork. Br J Nutr. 2007;97:1027–1035. 36. Costa V, Casamassimi A, Ciccodicola A. Nutritional genomics era:
opportunities toward a genome-tailored nutritional regimen. Journal of Nutritional Biochemistry. 2010;21:457–467.
37. DeBusk R. Diet-related disease, nutritional genomics, and food and nutrition professionals. J Am Diet Assoc. 2009;109:410–413. 38. McCarthy S, Pufulete M, Whelan K. Factors associated with knowledge
of genetics and nutritional genomics among dietitians. J Hum Nutr Diet. 2008;21:547–554.
39. Morin K. Knowledge and attitudes of Canadian consumers and health care professionals regarding nutritional genomics. Omics. 2009;13:37–41.
40. Reilly PR, Debusk RM. Ethical and legal issues in nutritional genomics.
J Am Diet Assoc. 2008;108:36–40.
Nutrition and Dietary Supplements downloaded from https://www.dovepress.com/ by 118.70.13.36 on 25-Aug-2020
Dovepress
Ruden and Lu
41. Royall D. Nutritional genomics unravelled. Can J Diet Pract Res. 2008; 69:168.
42. Ryan-Harshman M, Vogel E, Jones-Taggart H, et al. Nutritional genom-ics and dietetic professional practice. Can J Diet Pract Res. 2008;69: 177–182.
43. Vakili S, Caudill MA. Personalized nutrition: nutritional genomics as a potential tool for targeted medical nutrition therapy. Nutr Rev. 2007;65:301–315.
44. Xacur-Garcia F, Castillo-Quan JI, Hernandez-Escalante VM, Laviada-Molina H. Nutritional genomics: an approach to the environment interaction. Rev Med Chil. 2008;136:1460–1467. 45. Ruden DM, Rasouli P, Lu X. Potential long-term consequences of
fad diets on health, cancer, and longevity: lessons learned from model organism studies. Technol Cancer Res Treatt. 2007;6:247–254. 46. Atkins RC. Dr. Atkins’ New Diet Revolution. New York: Avon Books;
2002.
47. Agatston A. The South Beach Diet. New York: Random House; 2003.
48. Ye J, Cui X, Loraine A, et al. Methods for nutrigenomics and longevity studies in Drosophila: effects of diets high in sucrose, palmitic acid, soy, or beef. Methods Mol Biol. 2007;371:111–141.
49. MacDonald A, Gokmen-Ozel H, Daly A. Changing dietary practices in phenylketonuria. Turkish J Pediatr. 2009;51:409–415.
50. Ney DM, Gleason ST, van Calcar SC, et al. Nutritional management of PKU with glycomacropeptide from cheese whey. J Inherit Metab Dis. 2009;32:32–39.
51. Sarkissian CN, Gamez A, Scriver CR. What we know that could influence future treatment of phenylketonuria. J Inherit Metab Dis. 2009;32:3–9. 52. Van Spronsen FJ, Enns GM. Future treatment strategies in
phenylketonuria. Mol Genet Metab. 2010;99(Suppl 1):S90–S95. 53. Watson MS. Current status of newborn screening: decision-making
about the conditions to include in screening programs. Ment Retard Dev Disabil Res Rev. 2006;12:230–235.
54. Butler D. Human genome at ten: Science after the sequence. Nature. 2010;465:1000–1001.
55. Durbin RM, Abecasis GR, Altshuler DL, et al. A map of human genome variation from population-scale sequencing. Nature. 2010;467: 1061–1073.
56. Maxam AM, Gilbert W. A new method for sequencing DNA. Proc Natl Acad Sci U S A. 1977;74:560–564.
57. Sanger F, Nicklen S, Coulson AR. DNA sequencing with chain- terminating inhibitors. Proc Natl Acad Sci U S A. 1977;74:5463–5467.
58. Smith LM, Sanders JZ, Kaiser RJ, et al. Fluorescence detection in automated DNA sequence analysis. Nature. 1986;321:674–679. 59. Meyerson M, Gabriel S, Getz G. Advances in understanding cancer
genomes through second-generation sequencing. Nat Rev Genet. 2010; 11:685–696.
60. Zhang W, Dolan ME. Impact of the 1000 genomes project on the next wave of pharmacogenomic discovery. Pharmacogenomics. 2010;1:249–256.
61. Zhou HW, Li DF, Tam NF, et al. BIPES, a cost-effective high-through-put method for assessing microbial diversity. ISME J. 2010a; Oct 21. [Epub ahead of print].
62. Fan JB, Chee MS, Gunderson KL. Highly parallel genomic assays. Nat Rev Genet. 2006;7:632–644.
63. Eid J, Fehr A, Gray J, et al. Real-time DNA sequencing from single polymerase molecules. Science. 2009;323:133–138.
64. McCarthy A. Third generation DNA sequencing: pacific biosciences’ single molecule real time technology. Chem Biol. 2010;17:675–676. 65. Zhao J, Grant SF. Advances in whole genome sequencing technology.
Curr Pharm Biotechnol. 2010; Nov 4. [Epub ahead of print]. 66. Munzel M, Globisch D, Bruckl T, et al. Quantification of the sixth
DNA base hydroxymethylcytosine in the brain. Angewandte Chemie (International ed). 2010;49:5375–5377.
67. Flusberg BA, Webster DR, Lee JH, et al. Direct detection of DNA methylation during single-molecule, real-time sequencing. Nat Methods. 2010;7:461–465.
68. Chen Z, Jiang Y, Dunphy DR, et al. DNA translocation through an array of kinked nanopores. Nat Mat. 2010;9:667–675.
69. Clarke J, Wu HC, Jayasinghe L, Patel A, Reid S, Bayley H. Continuous base identification for single-molecule nanopore DNA sequencing.
Nat Nanotechnol. 2009;4:265–270.
70. Derrington IM, Butler TZ, Collins MD, et al. Nanopore DNA sequenc-ing with MspA. Proc Natl Acad Sci U S A. 2010;107:16060–16065. 71. Efcavitch JW, Thompson JF. Single-molecule DNA analysis. Annu Rev
Anal Chem (Palo Alto Calif). 2010;3:109–128.
72. Nelson T, Zhang B, Prezhdo OV. Detection of nucleic acids with graphene nanopores: ab initio characterization of a novel sequencing device. Nano Letters. 2010;10:3237–3242.
73. Zhou JB, Yang JK, Zhao L, Xin Z. Variants in KCNQ1, AP3S1, MAN2A1, and ALDH7A1 and the risk of type 2 diabetes in the Chinese Northern Han population: a case-control study and meta-analysis. Med Sci Monit. 2010;16:BR179–BR183.
74. Ron M, Weller JI. From QTL to QTN identification in livestock – winning by points rather than knock-out: a review. Anim Genet. 2007;38: 429–439.
75. Pauling L, Itano HA, Singer SJ, WElls IC. Sickle cell anemia, a molecu-lar disease. Science. 1949;110:543–548.
76. Cotsapas C, Prokunina-Olsson L, Welch C, et al. Expression analysis of loci associated with type 2 diabetes in human tissues. Diabetologia. 2010;53:2334–2339.
77. Holm K, Melum E, Franke A, Karlsen TH. SNPexp – A web tool for calculating and visualizing correlation between HapMap genotypes and gene expression levels. BMC Bioinformatics. 2010;11:600.
78. Montgomery SB, Sammeth M, Gutierrez-Arcelus M, et al. Transcrip-tome genetics using second generation sequencing in a Caucasian population. Nature. 2010;464:773–777.
79. Pickrell JK, Marioni JC, Pai AA, et al. Understanding mechanisms underlying human gene expression variation with RNA sequencing.
Nature. 2010;464:768–772.
80. Kulesh DA, Clive DR, Zarlenga DS, Greene JJ. Identification of interferon-modulated proliferation-related cDNA sequences. Proc Natl Acad Sci U S A. 1987;84:8453–8457.
81. Schena M, Shalon D, Davis RW, Brown PO. Quantitative monitoring of gene expression patterns with a complementary DNA microarray.
Science. 1995;270:467–470.
82. Hawkins RD, Hon GC, Ren B. Next-generation genomics: an integrative approach. Nat Rev Genet. 2010;11:476–486.
83. Nowrousian M. Next-generation sequencing techniques for eukaryotic microorganisms: sequencing-based solutions to biological problems.
Eukaryot Cell. 2010;9:1300–1310.
84. Van Vliet AH. Next generation sequencing of microbial transcrip-tomes: challenges and opportunities. FEMS Microbiology Lett. 2010;302:1–7.
85. Meyer SU, Pfaffl MW, Ulbrich SE. Normalization strategies for microRNA profiling experiments: a ‘normal’ way to a hidden layer of complexity? Biotechnol Lett. 2010;32:1777–1788.
86. Lagendre AM. Nouvelles méthodes pour la détermination des orbites des comètes; 1805.
87. Gauss CF. Theoria Motus Corporum Coelestium in Sectionibus Conicis Solem Ambientum. 1809.
88. Kriaucionis S, Heintz N. The nuclear DNA base 5-hydroxymeth-ylcytosine is present in Purkinje neurons and the brain. Science. 2009;324:929–930.
89. Klug M, Heinz S, Gebhard C, et al. Active DNA demethylation in human postmitotic cells correlates with activating histone modifications, but not transcription levels. Genome Biol. 2010;11:R63.
90. Wu SC, Zhang Y. Active DNA demethylation: many roads lead to Rome. Nat Rev Mol Cell Biol. 2010;11:607–620.
91. Zhu JK. Active DNA demethylation mediated by DNA glycosylases.
Annu Rev Genet. 2009;43:143–166.
92. Bediaga NG, Acha-Sagredo A, Guerra I, et al. DNA methylation epigenotypes in breast cancer molecular subtypes. Breast Cancer Res. 2010;12:R77.
Nutrition and Dietary Supplements downloaded from https://www.dovepress.com/ by 118.70.13.36 on 25-Aug-2020
Nutrition and Dietary Supplements
Publish your work in this journal
Submit your manuscript here: http://www.dovepress.com/nutrition-and-dietary-supplements-journal
Nutrition and Dietary Supplements is an international, peer-reviewed, open access journal focusing on research into nutritional requirements in health and disease, impact on metabolism and the identification and optimal use of dietary strategies and supplements necessary for nor-mal growth and development. The journal welcomes papers covering
original research, basic science, clinical & epidemiological studies, reviews and evaluations, guidelines, expert opinion and commentary, case reports and extended reports. The manuscript management system is completely online and includes a very quick and fair peer-review system, which is all easy to use.
Dovepress
Dove
press
Personalized nutrigenomics for the aging diabesity population
93. Fouse SD, Nagarajan RP, Costello JF. Genome-scale DNA methyla-tion analysis. Epigenomics. 2010;2:105–117.
94. Ji H, Ehrlich LI, Seita J, et al. Comprehensive methylome map of lineage commitment from haematopoietic progenitors. Nature. 2010;467:338–342.
95. Portela A, Esteller M. Epigenetic modifications and human disease.
Nat Biotechnol. 2010;28:1057–1068.
96. Ballestar E. Epigenetics lessons from twins: prospects for autoimmune disease. Clin Rev Allergy Immunol. 2010;39:30–41.
97. Baranzini SE, Mudge J, van Velkinburgh JC, et al. Genome, epigenome and RNA sequences of monozygotic twins discordant for multiple sclerosis. Nature. 2010;464:1351–1356.
98. Bliek J, Alders M, Maas SM, et al. Lessons from BWS twins: complex maternal and paternal hypomethylation and a common source of haematopoietic stem cells. Eur J Hum Genet. 2009;17:1625–1634. 99. Gravina S, Vijg J. Epigenetic factors in aging and longevity. Pflugers
Arch. 2010;459:247–258.
100. Harder A, Titze S, Herbst L, et al. Monozygotic Twins with Neurofibromatosis Type 1 (NF1) Display Differences in Methylation of NF1 Gene Promoter Elements, 5′ Untranslated Region, Exon and Intron 1. Twin Res Hum Genet. 2010;13:582–594.
101. Wong CC, Caspi A, Williams B, Craig IW, et al. A longitudinal study of epigenetic variation in twins. Epigenetics. 2010:5(6). [Epub ahead of print].
102. Yamazawa K, Kagami M, Fukami M, Matsubara K, Ogata T. Monozy-gotic female twins discordant for Silver-Russell syndrome and hypom-ethylation of the H19-DMR. J Hum Genet. 2008;53:950–955. 103. Tahiliani M, Koh KP, Shen Y, et al. Conversion of 5-methylcytosine to
5-hydroxymethylcytosine in mammalian DNA by MLL partner TET1.
Science. 2009;324:930–935.
104. Kangaspeska S, Stride B, Metivier R, et al. Transient cyclical methyla-tion of promoter DNA. Nature. 2008;452:112–115.
105. Kim MS, Kondo T, Takada I, et al. DNA demethylation in hormone-induced transcriptional derepression. Nature. 2009;461:1007–1012. 106. Metivier R, Gallais R, Tiffoche C, et al. Cyclical DNA methylation
of a transcriptionally active promoter. Nature. 2008;452:45–50. 107. Cubbon S, Antonio C, Wilson J, Thomas-Oates J. Metabolomic
appli-cations of HILIC-LC-MS. Mass Spectrom Rev. 2010;29:671–684. 108. Vinayavekhin N, Homan EA, Saghatelian A. Exploring disease
through metabolomics. ACS Chemical Biology. 2010;5:91–103. 109. Wang H, Tso VK, Slupsky CM, Fedorak RN. Metabolomics and
detection of colorectal cancer in humans: a systematic review. Future oncol (London, England). 2010;6:1395–1406.
110. Watson DG. The potential of mass spectrometry for the global profiling of parasite metabolomes. Parasitology. 2010;137:1409–1423. 111. Weckwerth W. Metabolomics: an integral technique in systems
biology. Bioanalysis. 2010;2:829–836.
112. Zhang A, Sun H, Wang Z, Sun W, Wang P, Wang X. Metabolomics: towards understanding traditional Chinese medicine. Planta Medica. 2010;76:2026–2035.
113. Takahashi K, Yamanaka S. Induction of pluripotent stem cells from mouse embryonic and adult fibroblast cultures by defined factors. Cell. 2006;126:663–676.
114. Brown ME, Rondon E, Rajesh D, et al. Derivation of induced pluri-potent stem cells from human peripheral blood T lymphocytes. PLoS One. 2010;5:e11373.
115. Giorgetti A, Montserrat N, Rodriguez-Piza I, et al. Generation of induced pluripotent stem cells from human cord blood cells with only two factors: Oct4 and Sox2. Nat Protoc. 2010;5:811–820.
116. Kunisato A, Wakatsuki M, Shinba H, Ota T, Ishida I, Nagao K. Direct generation of induced pluripotent stem cells from human nonmobilized blood. Stem Cells Dev. 2011;20:159–168.
117. Papapetrou EP, Sadelain M. Reconstructing blood from induced pluripotent stem cells. F1000 Med Rep. 2010;2, pii: 44.
118. Bilousova G, Chen J, Roop DR. Differentiation of mouse induced pluripotent stem cells into a multipotent keratinocyte lineage. J Invest Dermatol. 2010; Dec 9. [Epub ahead of print].
119. Nova A, Shtrichman R, Germanguz I, et al. Enhanced reprogram-ming and cardiac differentiation of human keratinocytes derived from plucked hair follicles, using a single excisable lentivirus. Cell Reprogram. 2010;12:665–678.
120. Raya A, Rodriguez-Piza I, Navarro S, et al. A protocol describing the genetic correction of somatic human cells and subsequent generation of iPS cells. Nat Protoc. 2010;5:647–660.
121. Araki R, Jincho Y, Hoki Y, et al. Conversion of ancestral fibroblasts to induced pluripotent stem cells. Stem Cells. 2010;28:213–220. 122. Jincho Y, Araki R, Hoki Y, et al. Generation of genome
integration-free induced pluripotent stem cells from fibroblasts of C57BL/6 mice without c-Myc transduction. J Biol Chem. 2010;285:26384–26389. 123. Rodriguez-Piza I, Richaud-Patin Y, Vassena R, et al. Reprogramming
of human fibroblasts to induced pluripotent stem cells under xeno-free conditions. Stem Cells. 2010;28:36–44.
124. Suhr ST, Chang EA, Tjong J, et al. Mitochondrial rejuvenation after induced pluripotency. PLoS One. 2010;5:e14095.
125. Gratsch TE, O’Shea KS. Noggin and chordin have distinct activities in promoting lineage commitment of mouse embryonic stem (ES) cells.
Dev Biol. 2002;245:83–94.
126. Mathieu C, Sii-Felice K, Fouchet P, et al. Endothelial cell-derived bone morphogenetic proteins control proliferation of neural stem/ progenitor cells. Mol Cell Neurosci. 2008;38:569–577.
127. Villa-Diaz LG, Pacut C, Slawny NA, Ding J, O’Shea KS, Smith GD. Analysis of the factors that limit the ability of feeder cells to maintain the undifferentiated state of human embryonic stem cells. Stem Cells Dev. 2009;18:641–651.
128. May HT, Horne BD, Ronnow BS, et al. Superior predictive abil-ity for death of a basic metabolic profile risk score. Am Heart J. 2009;157:946–954.
Nutrition and Dietary Supplements downloaded from https://www.dovepress.com/ by 118.70.13.36 on 25-Aug-2020