1856
Safety Assessment And Accident Prediction On
Expressways Using Vehicle Dynamic Simulation
Technique
Eko Deprianto, Ming Foong Soong, Rahizar Ramli, Ahmad Abdullah Saifizul
Abstract: Road safety assessment is crucial to reducing accidents because any preventive measure is only relevant and thus effective wh en there is understanding on the nature of accidents and the associated safety risks. Conventional safety assessment on roads is based on post-accident approach, for which the nature of accidents and safety risks are suggested from accident data. Such approach is obviously reactive rather than proactive, since this means accidents have already taken place when safety risk analysis is performed. This study proposes using vehicle dynamic simulation as the alternative, pre-accident method to assess safety, targeting at expressways. To verify the effectiveness of this proposal, the method was tested on three sections of a local major interstate expressway, known to be accident-prone, using road profiles generated virtually. Several simulation parameters were varied to emulate various combinations of vehicle, road and driver elements in the driving events. From simulation outcomes, it was determined that vehicle loss of control, which leads to road accidents, can be predicted by erratic response in certain vehicle dynamic response parameters, namely roll and lateral acceleration, together with inspection of lane departure from simulation visu als. The method was successful in replicating actual accidents at those known accident hotspots, in which the nature is related to lateral and longitudinal dynamics of vehicles that are normally encountered in free-flow traffic of expressways. This shows that vehicle dynamic simulation is an effective pre-accident method of assessing safety of an expressway. With this in mind, it is thus expected to be applicable to the pre-evaluation of safety of many newly-constructed expressways.
Index Terms: vehicle dynamic simulation, safety assessment, expressway, safety risk, road accident, road virtualization
—————————— ——————————
1 INTRODUCTION
Road accident is a worldwide matter that should be taken seriously as the occurrence of such traffic incident is almost always associated with injuries, if not fatalities. The fact that there is an increasing trend in the number of road accidents since the past two decades have consistently been emphasized in many studies [8], [9], [13] related to road safety, accident analysis and vehicle safety technology. According to the recent statistics by local road safety institute [4], a total of 476196 road accidents were recorded in 2014. Although not the most significant, road accidents involving expressways should never be taken lightly, for it is the accidents of this type, which are associated with high-speed and free-flow traffic condition, that most likely result
in severe injuries and even fatalities. In view of the severe
impact road accidents can have on human lives, countermeasures to road accidents have never been absent. For instance, speed limit imposition and traffic management are just some of the most common road safety measures. However, although these safety measures are generally accepted, it must be said that any implementation of road accident preventive measure at a specific location will only be relevant and consequently effective when there is a clear understanding on the nature of accidents and the associated safety risks at that location, and this insight can only be obtained by conducting safety assessment on roads. Road safety assessment is, therefore, crucial to reducing accident occurrences on roads [3]. This is especially important Conventionally, safety assessment on expressways, such as safety risk analysis, is based on post-accident approach. The nature of road accidents and the associated safety risks of an accident-prone location are deduced from accident statistics, as well as important
information obtained from various accident
reconstructions. However, while the effectiveness is
probably undeniable, post-accident approach can be seen as reactive and, more importantly, not proactive, since this means road accidents must have already taken place by the time safety assessment is carried out. In addition, methods based on post-accident approach basically offer no possibility of any pre-evaluation of safety of newly constructed expressways. This further highlights the non-proactive nature of post-accident approach. Of course, the assessment of safety of an expressway can be done
proactively by physically test driving the entire
expressway, but this is clearly inefficient in terms of time and cost considering the long stretch of an expressway, and this is not to mention the inherent lack of flexibility as certain extreme driving events which potentially lead to road accidents obviously cannot be emulated due to
safety concern. This study proposes using vehicle
dynamic simulation as the alternative, pre-accident method to assess safety of expressways. Conventionally, vehicle dynamic simulation is almost exclusively used for vehicle ride and handling performance evaluation [14], and consequently for design optimization of vehicles or vehicle suspensions [13], [15]. This proposed method involves an interesting use of vehicle dynamic simulation’s capability of emulating driving events under various vehicle, road and driver conditions to identify vehicle loss of control, which can be interpreted as the prediction of road accident. Judging from the conditions leading to predicted accidents, safety assessment can be carried out to determine the nature of accidents as well as the safety risks at certain accident-prone locations of an expressway. In this study, using an existing expressway as the test subject, this method was shown to successfully predict and even replicate road accidents at several known
accident hotspots, showing that vehicle dynamic
2 VIRTUALIZATION OF ROAD
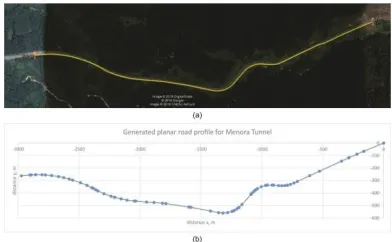
To provide an overall picture, the pre-accident safety assessment method through vehicle dynamic simulation proposed here is constituted by three main tasks, namely (i) virtualization of roads to be evaluated, (ii) selection and variation of vehicle dynamic simulation parameters which serve as representatives of vehicle, road and driver-related accident factors, and (iii) the safety risk analysis itself, the outcomes from which will lead to suggestions of effective safety measures. From the workflow shown above, the first step of this method is obviously the generation of virtual road profile, since road profile represents the actual road which is the foundation of the subsequent vehicle dynamic simulation. In this study, to verify the effectiveness of the proposed safety assessment method, an existing local major interstate expressway, namely the North-South Expressway (NSE) which is one of the most frequently used expressways in West Coast of Peninsular Malaysia, was chosen to be evaluated. Of the entire stretch covering a total of 772 km, three specific sections of the NSE were subjected to the safety assessment, and these were known by locations as (i) NSE N5 Menora Tunnel – Sungai Perak, (ii) NSE N5 Kuala Kangsar – Changkat Jering, and (iii) NSE Rawang. These sections of the said expressway were known to be accident-prone according to actual records from the expressway’s management. Secondarily, the combination of straight and curved geometries found in these selected sections, as can be seen later from the generated virtual road profiles (Figures 1 to 3), also made them suitable candidates to comprehensively verify the proposed safety assessment method. The details of these three sections, such as the length and the exact geographical location, are stated below. NSE N5 Menora Tunnel – Sungai Perak, expressway KM 258 – 254.6, length 3.4 kmNSE N5 Kuala Kangsar – Changkat Jering, expressway KM 234 – 228.5, length 5.5 km NSE Rawang, expressway KM 430 – 433, length 3.0 The virtualization of a road fundamentally requires road information of the section, particularly the geometrical data, to represent the road’s curvature and elevation which make up the road profile. The road geometry is typically represented numerically by coordinate data, a common one being the Global Positioning System (GPS) data. The GPS coordinates of a road section contain the longitudes, latitudes and altitudes of a series of positions that correspond to the section, and these can be translated into the more primitive Cartesian coordinates to serve as the road geometry or profile input of a virtual road model, which is recognizable in typical vehicle dynamic simulation software. There are many ways of obtaining this coordinate data of a road section, including physical measurement using surface mapping technologies like Light Detection and Ranging (LiDAR) [1], taking the recorded coordinates from a GPS tracking device, or obtaining the GPS coordinate data virtually from openly available sources like Google Earth (GE) application [5], [7], [10] which has been proven to be sufficiently accurate for road profiling. In this study, the GPS coordinates sourced from GE were used to generate road profiles of the three expressway sections identified earlier, because the other mentioned methods basically involve actual tracking along the sections which defeats the purpose of virtual simulation. In theory [13], [7], [10], GE uses Digital Elevation Model (DEM) data collected by Shuttle Radar Topography Mission
(SRTM) satellite, and the information can be obtained from the Keyhole Markup Language (KML) format. Three-dimensional geographic coordinates are used: the longitude and latitude are defined by World Geodetic System (WGS84), while the altitude is measured from WGS84 EGM96 Geoid Vertical Datum. For the three selected sections of NSE, the relevant GPS coordinates were taken and converted back to the Cartesian coordinates using the Haversine formula [18] to obtain the definitions of the three road profiles in three-dimensional space (x, y, and z-axes). These data are plotted in the x-y plane to illustrate the planar profiles of the three expressway sections (Figures 1 to 3).
Fig. 1. Illustration of: a – the planar view of NSE N5 Menora Tunnel – Sungai Perak, and; b – its generated road profile.
Fig. 2. Illustration of: a – the planar view of NSE N5 Kuala
Kangsar – Changkat Jering, and; b – its generated road profile.
Fig. 3. Illustration of: a – the planar view of NSE Rawang,
and; b – its generated road profile.
2.1 Road Profile Validation
1858
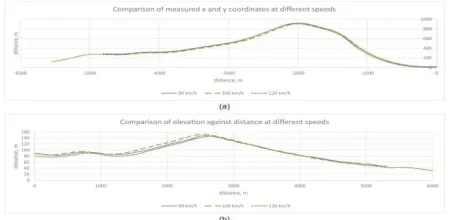
source of geographical data. However, considering that the accurate representation of the selected expressway sections is especially crucial to the correct prediction of vehicle responses during vehicle dynamic simulation, it was felt that a validation on at least one of the generated road profiles was needed. Following that, the virtually generated road profile of NSE N5 Kuala Kangsar – Changkat Jering was chosen to be validated against the corresponding actual road profile obtained from physically taken coordinate data using GPS device. The choice of considering NSE N5 Kuala Kangsar – Changkat Jering was logically due to it having the longest stretch of road compared to the other two sections. The GPS coordinate data collection was carried out through actual driving along the said expressway section using an instrumented vehicle. The instrumented vehicle was basically a typical passenger car that was equipped with an Inertial Measurement Unit (IMU) integrated with a GPS sensor module. This IMU-GPS unit was installed inside the vehicle cabin at a position as close as physically possible to the experimentally determined center of gravity of the vehicle. Meanwhile, the GPS antenna was mounted outside of the vehicle body, specifically on the top of vehicle, to prevent obstruction of signal by the vehicle body and therefore ensure the best possible signal reception for GPS coordinate tracking. Finally, the IMU-GPS unit was connected to a notebook-computer-based data acquisition system to complete the entire in-vehicle GPS data collection and storage system. The test drives and data collections were done manually along the 5.5 km section of NSE N5 Kuala Kangsar – Changkat Jering, for both North-bound and South-bound directions. Specifically, the GPS coordinates along the section were taken three times for each of the several driving speeds, namely 90 kmh-1, 100 kmh-1 and 120 kmh-1. Together with the consideration of two driving directions, this resulted in six drives for every driving speed. For each drive, the vehicle was driven from a starting point that was slightly prior to the section until the specified speed was attained. The vehicle was then maintained at the driving speed while data collection was in progress until the entire section was completed. Upon completion of test drives, the recorded GPS coordinate data was converted to Cartesian coordinate data, in the same way described previously, to obtain the actual road profile of NSE N5 Kuala Kangsar – Changkat Jering. Figure 4 shows this in the form of planar road profile and elevation profile, both obtained at the three tested driving speeds.
Fig. 4. Comparison of actual coordinate data of NSE N5 Kuala Kangsar – Changkat Jering for: a – planar road profile
and; b – elevation at different driving speeds.
Prior to any meaningful validation of virtual road profile, a
pre-comparison of the road profiles based on actual road data taken at the three driving speeds, as in Figure 4, was carried out to confirm the consistency of the recorded GPS data. It was observed that the planar road profiles resulted from the GPS coordinate data taken at the three speeds were very close among one another. The elevation profiles demonstrated slight variations across the speed range, but they were still considered close. Therefore, it can be said that the GPS coordinate data measurement using the in-vehicle IMU-GPS unit was repeatable, and the resulted actual road profile was reliable as the reference for the subsequent validation of virtually generated road profile. The virtual road profile of NSE N5 Kuala Kangsar – Changkat Jering that was generated from GE-sourced data was validated by checking it against the reference, actual road profile. This comparison, in terms of planar and elevation profiles, are shown in Figure 5.
Fig. 5. Comparison of: a – planar road profiles and; b –
elevations of NSE N5 Kuala Kangsar – Changkat Jering based on different sources of road data.
The comparison revealed that the planar road profiles based on the two sources of road data were very close to each other. Meanwhile, the elevation profile generated virtually from GE-sourced coordinate data demonstrated visible deviation from the actual elevation profile, although the deviation was still considered acceptable. However, it really should be noted that road elevation has more significant effect on vehicle ride, since it is related directly to the vertical vehicle dynamics, than vehicle handling which is the focus of vehicle dynamic simulation here as the safety assessment relies on identification of vehicle loss of control. This means that the planar road profile, which is related to lateral and longitudinal vehicle dynamics, is of primary importance. Considering the generally acceptable elevation profile and the very accurate planar road profile, it can be inferred that the virtual road profiles generated from GE’s GPS coordinate data are usable in this proposed safety assessment method.
2.2 Setup of vehicle dynamic simulation
relevant and effective recommendations on accident-preventive safety measures. Consequently, the intention of the vehicle dynamic simulation here is to emulate various real driving situations that typically occur on an expressway, particularly at the three expressway sections for this study, and observe any potential road accident occurrence that is presumably due to vehicle loss of control. The different driving situations can be achieved by varying some vehicle dynamic simulation parameters that can serve as representations of accident-related factors. Many factors within a driving situation can be related to accident causing. However, these can generally be separated into three major categories, namely (i) vehicular factors, (ii) road environmental factors, and (iii) driver or driving-related factors. This classification corresponds well with the fact that a typical driving event is made up of vehicle, road and driver elements [2]. To elaborate slightly further, the list that follows highlights some of the more prominent specific factors that are classified under these three categories.
Vehicular factors: vehicle classification, tire
property, vehicle’s braking capability, etc.
Road environmental factors: road geometry, road
surface traction, visibility, etc.
Driver or driving-related factors: driving behavior,
driver’s perception-reaction time, etc.
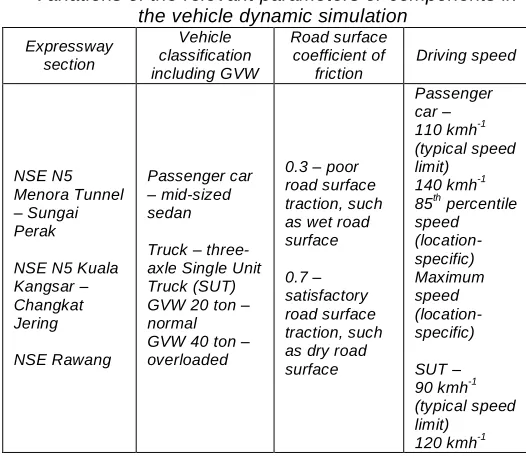
One can see from the above that vehicle, road and driver factors are many; however, within the context of vehicle dynamic simulation, some of these accident-related factors can be represented by simulation parameters while others cannot be incorporated in vehicle dynamic simulation. In this study, to test the comprehensiveness of the proposed pre-accident safety assessment method through vehicle dynamic simulation, a vehicle factor, a road factor, and a driver factor were incorporated in the safety assessment on the three accident-prone sections of NSE. After a consideration on the capability of vehicle dynamic simulation in representing these factors, the selected representative simulation parameters were: vehicle type including Gross Vehicle Weight (GVW), road surface coefficient of friction, and driving speed. The vehicle type and GVW can be seen as representing the vehicle classification and vehicle weight, or load for load-carrying vehicles. This, in turn, is related to the vehicle dynamic performance and vehicle load condition. Meanwhile, the road surface coefficient of friction generally represents the road condition during driving, because it defines the road surface traction. Lastly, the driving speed is basically the driver-maintained vehicle speed during driving, and it can be used to represent a specific driving behavior, that is, whether a driver obeys or violates the speed limit. This is especially interesting in the safety assessment of the selected accident hotspots of NSE, because speed limit violation is a common traffic offense for expressways considering the free-flow traffic nature. The variations of values or fields for these simulation parameters, including the road sections that have already been decided in Section 1, are detailed in Table 1.
Table 1
Variations of the relevant parameters or components in the vehicle dynamic simulation
Expressway section Vehicle classification including GVW Road surface coefficient of friction Driving speed NSE N5 Menora Tunnel – Sungai Perak
NSE N5 Kuala Kangsar – Changkat Jering NSE Rawang Passenger car – mid-sized sedan
Truck – three-axle Single Unit Truck (SUT) GVW 20 ton – normal GVW 40 ton – overloaded
0.3 – poor road surface traction, such as wet road surface
0.7 – satisfactory road surface traction, such as dry road surface
Passenger car – 110 kmh-1 (typical speed limit) 140 kmh-1 85th percentile speed (location-specific) Maximum speed (location-specific) SUT – 90 kmh-1 (typical speed limit) 120 kmh-1
1860
in the simulation to ensure the closest possible representation of actual driver speeding behavior. To summarize, the adopted speed values for passenger car at the three NSE sections are stated below.
NSE N5 Menora Tunnel – Sungai Perak: 105 kmh-1
(85th percentile), 110 1 (speed limit), 140 kmh-1, 163 kmh-1 (maximum)
NSE N5 Kuala Kangsar – Changkat Jering: 110
kmh-1 (speed limit), 112 kmh-1 (85th percentile), 140 kmh-1, 192 kmh-1 (maximum)
NSE Rawang: 110 kmh-1 (speed limit), 130 kmh-1
(85th percentile), 140 kmh-1, 189 kmh-1 (maximum)
The vehicle dynamic simulation for this safety assessment work was carried out using IPG CarMaker® (or the equivalent TruckMaker® module for cases involving the three-axle SUT), which is a commercial vehicle dynamic simulation software package. For all cases of simulation parameter variation, the vehicle was controlled, or maneuvered, by the default driver model of the simulation software, which basically comprised of closed-loop controllers for both longitudinal and lateral directions. The longitudinal controller ensured that the vehicle speed was maintained at the intended driving speed, while the lateral controller ensured that the vehicle stayed within the intended driving lane. These, which translated to speed and steering controls, were based on best effort basis, failing of which could therefore be interpreted as vehicle loss of control due to the combination of represented factors mentioned above. Finally, the default driver model’s standard (non-race-driver) parameter settings, for instance the small corner cutting coefficient value, were kept unchanged throughout all simulation cases to achieve consistent and close representation of regular road users across all three evaluated expressway sections.
3 SAFETY RISK ANALAYSIS
The several variations of the involved simulation parameters, not forgetting the three different sections of NSE, resulted in a total of 48 simulation cases covering a variety of driving situations, including both safe driving and risky driving. For each case, the simulation was executed until completion of the entire expressway section, or until occurrence of vehicle loss of control, at which point the simulation could not proceed further and had to be halted by the solver. The safety assessment on each expressway section was carried out through an analysis on the main simulation outcomes of whether the tested vehicle remained in control throughout the entire section or went out of control, when under certain combinations of simulation parameter variations. In the context of vehicle dynamic simulation, vehicle loss of control mainly refers to the deviation of a vehicle from its desired vehicle trajectory despite best effort from driver model. This includes entering adjacent lane or multiple lanes with either understeering or over-steering behaviors. Note that in some cases the vehicle completed the expressway section with only momentary and partial lane departure, but this should still be acknowledged. On the other hand, corrective movements due to driver model’s corrective maneuver, as long as within the vehicle’s intended driving lane, should not be seen as a loss of control. The simulation outcomes were recognized from manual inspection on the real-time
simulation visuals, as well as from observation on certain relevant vehicle dynamic response parameters, such as the vehicle’s lateral acceleration and roll. The former shows the response of vehicle in the lateral direction directly, while the latter is commonly accepted as an objective measurement of vehicle handling [17]. Based on the simulation outcomes for all cases, the association between the undesirable outcome of vehicle loss of control and the relevant combinations of simulation parameter variations was established for safety risk analysis. In short, vehicle type including GVW relates to the risk of vehicle performance and vehicle overloading, road surface coefficient of friction relates to the risk of non-ideal road surface traction, while driving speed relates to the risk of speeding. Tables 2, 3 and 4 summarize the simulation outcomes due to all cases for the three involved NSE sections, prior to the detailed assessment on each of these accident hotspots in Sections 3.1, 3.2 and 3.3.
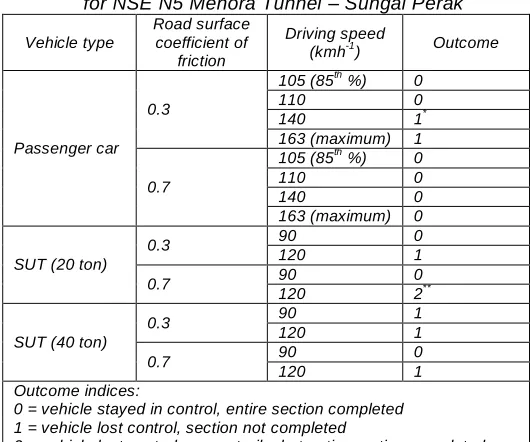
Table 2
Simulation outcomes due to variations of parameters for NSE N5 Menora Tunnel – Sungai Perak
Vehicle type
Road surface coefficient of
friction
Driving speed
(kmh-1) Outcome
Passenger car 0.3
105 (85th %) 0 110 0 140 1* 163 (maximum) 1
0.7
105 (85th %) 0 110 0 140 0 163 (maximum) 0
SUT (20 ton)
0.3 90 0 120 1
0.7 90 0 120 2**
SUT (40 ton)
0.3 90 1 120 1
0.7 90 0 120 1 Outcome indices:
0 = vehicle stayed in control, entire section completed 1 = vehicle lost control, section not completed
2 = vehicle lost control momentarily, but entire section completed
Additional Notes:
*
Additional trial simulation (not shown here) showed that vehicle was in control at coefficient of friction larger than 0.3.
**
Table 3
Simulation outcomes due to variations of parameters for NSE N5 Kuala Kangsar – Changkat Jering
Vehicle type
Road surface coefficient of
friction
Driving speed
(kmh-1) Outcome
+
Passenger car 0.3
110 0 112 (85th %) 0 140 0 192
(maximum) 1
*
0.7
110 0 112 (85th %) 0 140 0 192
(maximum) 0
SUT (20 ton)
0.3 90 0 120 0
0.7 90 0 120 2**
SUT (40 ton)
0.3 90 0 120 0
0.7 90 0 120 2** Outcome indices:
0 = vehicle stayed in control, entire section completed 1 = vehicle lost control, section not completed
2 = vehicle lost control momentarily, but entire section completed
Additional Notes:
*
Vehicle had both issues of difficulty going uphill and lateral loss of control; section not completed.
**
Almost unable to overcome uphill part of the section but no lateral issue.
+
The outcomes for this section were not exactly binary; all cases suffered from a drop in speed when overcoming the uphill part of section but to varying severities.
Table 4
Simulation outcomes due to variations of parameters for NSE Rawang
Vehicle type
Road surface coefficient of
friction
Driving speed
(kmh-1) Outcome
Passenger car 0.3
110 0 130 (85th %) 0 140 0 189 (maximum) 0
0.7
110 0 130 (85th %) 0 140 0 189 (maximum) 0
SUT (20 ton)
0.3 90 0 120 2* 0.7 90 2
*
120 0
SUT (40 ton)
0.3 90 0 120 2* 0.7 90 0 120 0 Outcome indices:
0 = vehicle stayed in control, entire section completed
2 = vehicle lost control momentarily, but entire section completed
Additional Notes:
*
Vehicle went slightly out of lane during long corner (occupying adjacent lane or partial lane departure), but entire section completed.
3.1 NSE N5 Menora Tunnel – Sungai Perak (KM 258- 254.6)
Of the three evaluated NSE sections, NSE N5 Menora Tunnel – Sungai Perak had the greatest number of vehicle-loss-of-control occurrences. For both passenger car and three-axle SUT, vehicle loss of control occurred as lateral or sideway skidding at the sharpest corner of this section, which is the position of KM 256.3 within the section’s range of KM 258 – 254.6, a position with the minimum radius of curvature. This exact position of lateral incident, as predicted from vehicle dynamic simulation, is actually close to some actual road accidents that have previously occurred at this NSE section, including a recent reported accident involving a heavy vehicle at KM 256.5 [16]. Although it is acknowledged that the specific cause of an accident probably varies from one to another and is also not necessarily related to vehicle dynamics, the close prediction of the position of potential accidents at this NSE section still generally supports the usefulness of this safety
assessment method. To give a generalized picture of NSE
N5 Menora Tunnel – Sungai Perak, summarizing from Table 2, it can be seen that there were more occurrences of vehicle-loss-of-control for SUT (under various GVWs) than for passenger car. The tested passenger car only went out of control under highly unfavorable conditions involving high driving speed and minimum road surface coefficient of friction. Meanwhile, a number of loss-of-control occurrences involving the tested SUT were observed from Table 2. Actually, to generalize even further, this trend was also applicable to the other evaluated NSE sections, when considering all simulation outcomes together (Tables 2, 3 and 4). This observation correlates to the usually better vehicle dynamic performance of a passenger car compared
to an SUT. An interesting observation from the simulation
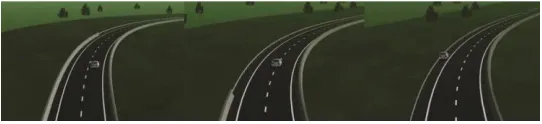
visuals is that, for lateral-loss-of-control occurrences, the tested passenger car went out of control by understeering, while the tested SUT went out of control by over-steering, for example as illustrated by a relevant simulation case involving NSE N5 Menora Tunnel – Sungai Perak (Figures 6 and 7). In fact, for these occurrences of lateral loss of control at NSE N5 Menora Tunnel – Sungai Perak, the tested passenger car tended to understeer and slide into the adjacent outer lane or even multiple lanes, while the tested SUT tended to over-steer and spin 180 degrees into other lanes, heading the opposite direction. Again, this can be generalized, as the observed behaviors were true for lateral loss of control involving the other evaluated NSE sections as well. This observation confirms that the tested vehicles responded typically during the vehicle dynamic simulation; for instance, a passenger car is usually designed to behave as slightly understeering at the limit of driving.
1862
Fig. 7. Over-steering behavior of the tested SUT at NSE N5 Menora Tunnel – Sungai Perak.
Apart from inspecting the simulation visual of every simulation case, the undesirable vehicle-loss-of-control occurrences were also indicated from the selected response parameters, namely roll and lateral acceleration of the passenger car and the SUT. These responses for some selected indicative cases, plotted against road distance from the starting point of this expressway section, are shown collectively in Figure 8.
Fig. 8. Selected: a – passenger car’s roll responses; b – its
lateral acceleration responses; c – SUT’s roll responses, and; d – its lateral acceleration responses for NSE N5
Menora Tunnel – Sungai Perak.
Looking at the two response parameters, it can be seen that roll and lateral acceleration are highly correlated. Meanwhile, when correlating the response plots with the simulation outcomes, it is obvious that a lateral-loss-of-control occurrence, such as those from this NSE section, can be identified by out-of-normal or erratic vehicle responses (highlights in Figure 8), especially when compared directly with the respective vehicle responses corresponding to the normal or in-control scenario. However, with the existing vehicle dynamic simulation, a limitation of using roll and lateral acceleration for the above purpose should be noted. In particular, the unsteady vehicle responses near the beginning should instead correspond to the initialization of the simulation. This initial response unsteadiness is likely due to the driver model’s attempt to stabilize the vehicle, since the simulation was started abruptly at a cut-out section from the entire expressway and with a preset speed. It is therefore suggested that the method can be perfected by adding an additional tangential road definition prior to the beginning of the evaluated expressway section to ensure smooth entering of vehicle into the desired section. Excluding this limitation, although there is no identifiable response signature that specifically points to vehicle sideway skidding, the erratic behavior in both roll and lateral acceleration can still be used to predict the scenario of a vehicle going out of control,
alongside the inspection on real-time simulation visuals. Together, these form the potential accident identification technique of this safety assessment method.
3.2 NSE N5 Kuala Kangsar – Changkat Jering (KM 234 – 228.5)
Moving on to NSE N5 Kuala Kangsar – Changkat Jering, as opposed to the other sections, the issue for this expressway section is mainly related to the longitudinal dynamics. For this NSE section, it is actually more appropriate to term the issue as beyond desirable longitudinal control instead of vehicle loss of control. Specifically, the description here refers to the scenario in which it was difficult or near impossible to overcome the uphill part of the section. In fact, for NSE N5 Kuala Kangsar – Changkat Jering, the simulation outcomes were not exactly binary (either able or unable to overcome the elevation); all simulation cases actually suffered from a drop in vehicle speed when overcoming the uphill part of this section, but expectedly to varying severities. To better illustrate this issue, several vehicle speed responses for the SUT (40 ton) and the passenger car are shown in Figure 9.
Fig. 9. Selected vehicle speed responses involving: a – SUT (40 ton) and; b – passenger car for NSE N5 Kuala Kangsar –
Changkat Jering.
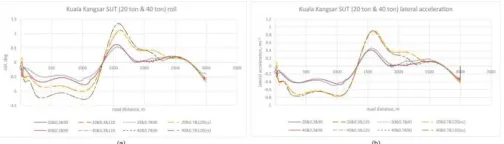
Fig. 10. Illustration of: a – SUT’s roll responses, and; b – its lateral acceleration responses for NSE N5 Kuala Kangsar –
Changkat Jering.
Meanwhile, Figure 11 shows some indicative roll and lateral acceleration responses of the passenger car for NSE N5 Kuala Kangsar – Changkat Jering. The observation for passenger car is almost the same. The main concern here is the speed reduction when going uphill. There was only one simulation case in which the tested passenger car actually slid out of lane to the side of the road with understeering, in addition to, of course, longitudinal speed reduction issue, and the lateral incident could not be saved. However, it should be noted that this lateral loss of control occurred only at the rarely seen maximum driving speed (192 kmh-1 as adopted from empirical data) in combination with poor road surface condition. Other than this, a special observation from Figure 11 that is related to accident identification is worth discussing. For the case of the same poor road surface condition but at a
driving speed of 140 kmh-1, the roll and lateral acceleration responses actually indicate a near-losing-control scenario based on the highlighted erratic characteristic, which the inspection on the related real-time simulation visual did not immediately reveal. The vehicle was still considered to be in control, since corrective movements within the intended driving lane was accepted. However, this interesting indication from the vehicle responses basically advocates the importance of using both inspection on simulation and observation on the relevant vehicle responses in the identification of potential accidents during safety assessment, rather than relying on either way alone.
Fig. 11. Selected: a – passenger car’s roll responses, and; b
– its lateral acceleration responses for NSE N5 Kuala Kangsar – Changkat Jering
To summarize, the major issue for this NSE section is still the difficulty in overcoming the uphill part of the section, which is likely caused by the weight of a vehicle and is therefore related to vehicle type. Although in the simulation the tested vehicles managed to complete the entire expressway section for all but one cases, this issue will become a safety concern
1864
Fig. 12. Illustration of: a – an overtaking simulation involving mixed-vehicle-classification traffic at NSE N5 Kuala Kangsar – Changkat
Jering, to emulate; b – an actually seen near-accident at this expressway section.
The overtaking simulation clearly described the safety concern due to the significant drop in vehicle speed experienced by heavy vehicles, in contrast to the slight reduction in speed for passenger cars. In the simulation, the trailing passenger car, at higher speed than the pair of heavy vehicles involving in overtaking, could not slowdown in time to avoid a rear-end collision with the leading and overtaking heavy vehicle, as highlighted in Figure 12. Therefore, it is the huge relative speeds among vehicles, which can be made even worse due to overloading of load-carrying vehicles like SUT that potentially leads to accidents at this expressway section.
3.3 NSE Rawang (KM 430 – 433)
Finally, for NSE Rawang, Table 4 shows that only the SUT experienced vehicle loss of control in the lateral direction. Based on the simulation outcomes, these lateral loss of
control occurrences were related to poor road surface traction and high driving speed. Conversely, the tested passenger car had no such issue and entirely remained in control under all the relevant combinations of road surface condition and driving speed. This can again be attributed to the generally superior vehicle dynamic performance of a passenger car relative to an SUT. However, for cases involving the loss of control of SUT, the vehicle actually went out of control only in the form of momentary partial lane departure during the long corner towards the end of the section. Figure 13 illustrates one of these lateral incidents, in which a small portion of the tested SUT were found to be on the outer, adjacent lane. Although the SUT still managed to complete the entire expressway section for these cases, the issue of partial-out-of-lane should not be dismissed, because this can potentially lead to sideway collision when there is traffic on the adjacent lane.
Fig. 13. The partial lane departure of SUT at NSE Rawang.
To further complement the above analysis on NSE Rawang, some selected roll and lateral acceleration responses for the SUT and passenger car are shown in Figure 14. Expectedly, due to the mildness of vehicle loss of control involving SUT at this NSE section, these occurrences are harder to be identified from the responses. When correlated to the simulation visuals, the slightly out-of-lane scenario during the long corner corresponded to the highlighted part of the responses in Figure 14. However, it is obviously not as identifiable as the erratic responses for the other two
evaluated NSE sections. This again highlights the need of employing multiple ways of identifying potential accident occurrences in this simulation-based safety assessment method on expressways. From Figure 14, an additional note is that the initial unsteady response for passenger car involving poor road surface condition and high driving speed of 189 kmh-1 should be seen as the consequence of initialization of simulation, because the relevant simulation visual did not show any sign of lane departure or total loss of control.
Fig. 14. Selected: a – SUT’s roll responses; b – its lateral acceleration responses; c – passenger car’s roll responses, and; d – its lateral acceleration responses for NSE Rawang.
potential accident due to vehicle loss of control provokes the thought that actual accidents involving passenger cars at this expressway section are likely due to causes beyond the three factors considered in this vehicle dynamic simulation.
These accident-related factors include unexpected
malfunctions such as tire failure and brake failure, road visibility, and driver’s perception-reaction time. This forms the limitation of the safety assessment method proposed here, because these factors are difficult to be incorporated directly in a vehicle dynamic simulation. Still, within the capability of vehicle dynamic simulation in representing vehicle classification (including GVW), road surface traction and driver’s behavior in obeying speed limit, the safety analysis on these accident-prone sections of NSE has effectively determined the nature and causes of potential accidents at these sections. A summary of the safety risks and some relevant suggestions on safety measures are given in the following section.
3.4 Recommendations on Safety Measures
Based on the analysis on NSE N5 Menora Tunnel – Sungai Perak, NSE N5 Kuala Kangsar – Changkat Jering and NSE Rawang, the safety risks associated with the nature of accidents can be pinpointed, and a number of corresponding safety measures can be recommended to mitigate these safety risks, or at least to attempt to reduce the likelihood of road accident occurrences at these accident hotspots. Considering that each of these expressway sections involves different accident nature and different risks, the safety
measures suggested here are therefore location-specific.For
NSE N5 Menora Tunnel – Sungai Perak where the
number of vehicle-loss-of-control occurrences was the greatest of the three sections, especially when involving SUT, it has been observed that the nature of potential accidents involves the loss of lateral control near the sharp cornering position where the radius of curvature is minimum. Judging from the several occurrences as stated in Table 2, in which vehicle loss of control occurred at high driving speed and low road surface coefficient of friction, the safety risks for this location should include speeding as well as less-than-ideal road surface traction. Consequently, recommendations for this expressway section should aim at tackling these issues, such as (i) improving existing measures for drivers to reduce driving speed, including variable speed limits (especially for heavy vehicles because in one case the 40 ton SUT suffered from a loss of control at 90 kmh-1), and (ii) employing anti-skid pavement coating (Silva, 2016), particularly at the small-radius sharp corner, to achieve acceptable road surface traction even during undesirable
wet road condition. For NSE N5 Kuala Kangsar –
Changkat Jering, although in one occasion relevant to passenger car there was lateral loss of control, that was only under extreme conditions involving maximum driving speed and poor road surface traction. The main issue for this section, as demonstrated by the predicted accident outlined in Fig. 12, is the different severities in vehicle speed reduction, as a passenger car which suffers less speed drop and remains relatively faster cannot brake safely to avoid a leading but much slower heavy vehicle. From what has been analyzed, the safety-related risk here is vehicle weight (overweight or overloading) which, to a certain extent, relates to vehicle classification also.
Although the problem of overloaded load-carrying vehicles can only be solved through traffic law enforcement, efforts on reducing mixed-vehicle traffic at this expressway section can still be done. The recommendations here are generally towards the direction of classifying light and heavy vehicles into different lanes, including (i) having an additional, dedicated lane for heavy vehicles together with (ii) prohibition on overtaking moves involving vehicle classifications with high GVWs at the uphill part of the section, or (iii) redirecting heavy vehicles to use
alternative routes.Finally, for NSE Rawang, the nature of
potential accidents at this expressway section is the slight loss of lateral control, or specifically venturing out-of-lane partially during the long corner part of the section. The accident nature of NSE Rawang is actually quite similar to that of NSE N5 Menora Tunnel – Sungai Perak; however, the vehicle loss of control was much gentler at this expressway section, as it was only in the form of partial lane departure and the vehicle could still complete the entire section. Furthermore, from Table 4, only SUT
suffered from this problem. Similarly, the
recommendations proposed here are meant for
overcoming both issues of driving speed and road surface traction. These include (i) measures for drivers to reduce driving speed, for instance the imposition of a lower speed limit for heavy vehicles (the passenger car did not show apparent lateral dynamic issue for the entire tested driving speed range), and (ii) improving road or lane markings, for example through the use of reflectors, so that drivers can recognize slight lane departure easily and can therefore apply corrective maneuvers immediately. For this latter issue, it is worth to mention that while the use of high traction pavement will definitely help, improvement to road markings is thought to be sufficient for NSE Rawang considering the mildness of the lane departure at this expressway section.
4 CONCLUSION
1866
the safety of newly constructed expressways is particularly promising.
5 REFERENCES
[1] Hui, Z., Hu, Y., Jin, S., & Yevenyo, Y. Z. (2016). Road
centerline extraction from airborne LiDAR point cloud based on hierarchical fusion and optimization. ISPRS Journal of Photogrammetry and Remote Sensing, 118, 22-36.
[2] IPG Automotive. (2014). IPG documentation
CarMaker® user’s guide version 4.5.4. Karlsruhe, Germany: IPG Automotive GmbH.
[3] Jakimavicius, M. (2018). Analysis and assessment of
Lithuanian road accidents by AHP method. The Baltic Journal of Road and Bridge Engineering, 13(3), 238-260.
[4] Malaysian Institute of Road Safety Research (MIROS).
(2016). General road accident data in Malaysia
(1997-2014). Retrieved from
https://www.miros.gov.my/1/page.php?id=17&k=accide nt%20statistic
[5] Mohammed, N. Z., Ghazi, A., & Mustafa, H. E. (2013).
Positional accuracy testing of Google Earth. International Journal of Multidisciplinary Science and Engineering, 4(6), 6-9.
[6] Noon, R. K. (1992). Introduction to forensic engineering.
Florida: CRC Press.
[7] Rusli, N., Majid, M. R., & Din, A. H. M. (2014). Google
Earth’s derived digital elevation model: A comparative assessment with Aster and SRTM data. Earth and Environmental Science, 18, 012065, 1-6.
[8] Saifizul, A. A., Yamanaka, H., & Karim, M. R. (2011).
Empirical analysis of gross vehicle weight and free flow speed and consideration on its relation with differential speed limit. Accident Analysis and Prevention, 43(3), 1068-1073.
[9] Sharizli, A. A., Ramli, R., Karim, M. R., & Saifizul, A. A.
(2015). New method for distance-based close following safety indicator. Traffic Injury Prevention, 16(2), 190-195.
[10]Sharma, A., & Gupta, D. (2014). Derivation of
topographic map from elevation data available in Google Earth. Civil Engineering and Urban Planning: An International Journal (CiVEJ), 1(1), 14-21.
[11]Silva, J. E. D. (2016, January 23). Tech halves crash
rate. The Star Online. Retrieved from
http://www.thestar.com.my/news/nation/2016/01/23/tec h-halves-crash-rates-plus-antiskid-pavement-a-most-effective-safety-measure/
[12]Soltani, M., Moghaddam, T. B., Karim, M. R., & Sulong,
N. H. R. (2013). Analysis of developed transition road safety barrier systems. Accident Analysis and Prevention, 59, 240-252.
[13]Soong, M. F., Ramli, R., & Saifizul, A. (2017). Between
simplicity and accuracy: Effect of adding modeling details on quarter vehicle model accuracy. PLoS One, 12(6), e0179485, 1-23.
[14]Tey, J. Y., Ramli, R., Abidin, M. A. Z., Alias, A., & Dzakaria, A. (2013). Design optimization of full vehicle suspension based on ride and handling performance. In Proceedings of the FISITA 2012 World Automotive Congress, China, (pp. 75-86).
[15]Tey, J. Y., Soong, M. F., & Ramli, R. (2014). Optimized
suspension kinematic profiles for handling performance
using 10-degree-of-freedom vehicle model.
Proceedings of the Institution of Mechanical Engineers, Part K: Journal of Multi-body Dynamics, 228(1), 82-99.
[16]The Sun Daily. (2016, December 10).Tanker lorry crash
causes traffic congestion near Menora Tunnel. The Sun
Daily. Retrieved from
http://www.thesundaily.my/news/2090745
[17]Uys, P. E., Els, P. S., & Thoresson, M. J. (2006). Criteria
for handling measurement. Journal of Terramechanics, 43(1), 43-67.
[18]Veness, C. (2002). Calculate distance, bearing and
more between latitude / longitude points. Retrieved from http://www.movable-type.co.uk/scripts/latlong.html
[19]Zamzamzadeh, M., Saifizul, A., Ramli, R., & Soong, M.