Artical
Comparative analysis of surface topography of custom CAD/CAM zirconia abutments by means of optical profilometry
Dr. Peter Gehrke
Praxis Prof. Dr. Dohm & Kollegen
Bismarckstraße 27
D-67059 Ludwigshafen
E-mail: [email protected]
Office telephone: (0621) 68124444
Dr. Wolfgang Kaiser
Kaiserstraße 14
D-90403 Nürnberg
ZT Carsten Fischer
Sirius Ceramics
Lyoner Strasse 44-48
D-60528 Frankfurt
Prof. Dr. Günter Dhom
Praxis Prof. Dr. Dohm & Kollegen
Bismarckstraße 27
D-67059 Ludwigshafen
Abstract
Objective: CAD/CAM generated ceramic implant abutments have recently attracted interest due to their superior customization possibilities and aesthetic advantages. Despite their
widespread clinical use, little information is currently available on their surface topography,
however. The transmucosal portion of the abutment shoulder is of particular interest, as it ideally
supports soft tissue but minimizes mechanical plaque retention. The aim of this in vitro study was to topographically characterize the trans- and subgingival roughness of CAD/CAM zirconia
abutments from different manufacturers and compare them with zirconia stock abutments.
Material and Method: The surface topography of eight CAD/CAM zirconia implant abutments (tests) and two prefabricated zirconia stock abutments (controls) was determined using focus
variation microscopy. Two points on the abutment shoulder were subjected to profilometric
examination. 2D and 3D parameters of roughness were obtained and compared.
Results: The surface roughness of all the test abutments exceeded the recommended threshold of Ra = 0.2 µm and therefore exhibited an increased risk of mechanical plaque
retention. Obvious differences in surface structure were apparent, allowing conclusions to be
drawn about the manufacturing method and subsequent reworking processes.
Conclusion: Manually reworking the trans- and submucosal area of the investigated CAD/CAM zirconia abutments appears necessary to fulfil the conditions for optimal surface topography.
The Sa value as arithmetic mean, taking the maximum height (Sz value) and surface excess
(Sdr) into account, is an essential parameter for assessing the surface topography of implant
abutments.
Introduction
An intact soft-tissue transition zone between the oral cavity and peri-implant bone is crucial for
the long-term prognosis of an implant restoration.1 Since implant abutments are a part of the
superstructure that is in direct contact with peri-implant tissues, their biocompatibility, material
structure, surface quality, and shape influence the soft-tissue reaction directly.2,3 Recent
developments in the area of computer-aided design and manufacture (CAD/CAM) enable
fabrication of custom implant abutments made of titanium and zirconia ceramic. Custom
CAD/CAM abutments allow correction of axial divergence between the implant and
corresponding crown. The line of the crown margin can be adjusted to the line of the soft tissue,
and the requirement for an anatomic emergence profile and controllable cement gap in a single
implant-supported restoration can be met individually.4-6
Because of the biocompatibility and minor color change in the peri-implant mucosa, CAD/CAM
abutments made of zirconia are used increasingly in the aesthetically important anterior
region.7,8 In addition to the different possibilities for connecting the implant and abutment, it is
possible to use prefabricated stock- or individually milled CAD/CAM zirconia abutments, both of
which today are available in one- and two-piece designs.9-11 One-piece abutments, including
the connection geometry, are milled entirely using the CAD/CAM process. Two-piece (hybrid)
abutments consist of a prefabricated titanium adhesive base to which a custom CAD/CAM
zirconia sleeve produced in the laboratory is bonded. For optimal results, the surface
morphology of custom zirconia abutments should promote soft-tissue adherence while at the
same time minimizing plaque retention in order to avoid inflammatory processes. Accordingly,
high demands must be made of the surface quality of such abutments. The initial bacterial
adhesion of the trans- and submucosal abutment surface is directly dependent on its surface
roughness.12 Studies confirm that a roughness of Sa= 0.2 μm can be accepted as a threshold;
roughness should not be critically below this threshold to facilitate soft-tissue adherence and
avoid loss of attachment.
Homogeneous, structure polished zirconia surfaces are regarded as biocompatible and
plaque-resistant. They form the foundation for optimal soft-tissue adaptation and prevent bacterial
adhesion.8,14,15 Under periprosthetic, functional and hygiene aspects, the structure and
morphology of the abutment surface represent a crucial criterion for the long-term success of an
implant restoration.16-19 To date there is no reliable information regarding the effect on
peri-implant soft tissue of the surface quality, topography, and roughness of CAD/CAM zirconia
implants produced industrially or in the laboratory. Minimal standards on the degree of
roughness and microgeometry that may be adequate or necessary for healthy soft-tissue
adaptation have not yet been developed. Prefabricated standard implant abutments usually
follow a defined production protocol to meet established quality criteria.20 Whether custom
CAD/CAM abutments meet comparable quality criteria is not currently known.
The aim of the present study was therefore to characterize the surface topography of the trans-
and submucosal zone of CAD/CAM zirconia ceramic abutments following processing and
delivery by means of profilometry (focus variation microscopy).
Material and Method
For this in vitro study, eight CAD/CAM zirconia abutments produced by different manufacturers (test abutments) (samples 1-8; Fig. 1) were compared with two prefabricated zirconia stock
abutments (control abutments) (samples 9 and 10; Fig. 2). The following CAD/CAM systems
Test abutments
One-piece zirconia abutments
Sample 1. Atlantis (Dentsply Implants, Mannheim, Germany): CAD/CAM zirconia abutment
including connection geometry for Astra OsseoSpeed implant.
Sample 2. Bego CADAbut (Bego Medical, Bremen, Germany): CAD/CAM zirconia abutment
including connection geometry for Semados implant.
Sample 3: BellaTek (BIOMET 3i, Florida, USA) CAD/CAM zirconia abutment including
connection geometry for 3i implant.
Sample 4. Cares (Institut Straumann AG, Basel, Switzerland): CAD/CAM zirconia abutment
including connection geometry for Straumann Bone Level implant.
Sample 5. Compartis (Dentsply Degudent, Hanau, Germany): zirconia abutment including
connection geometry for Ankylos C implant.
Sample 6. Procera (Nobel Biocare, Zürich, Switzerland): CAD/CAM zirconia abutment including
connection geometry for Nobel Active Implant.
Two-piece zirconia abutments (hybrid abutments)
Sample 7: Dedicam (Camlog GmbH, Wimsheim, Germany): CAD/CAM zirconia sleeve on
titanium insert with connection geometry for CAMLOG implant.
Sample 8: Zfx (Zimmer Dental GmbH, Freiburg, Germany): CAD/CAM zirconia sleeve on
Control abutments
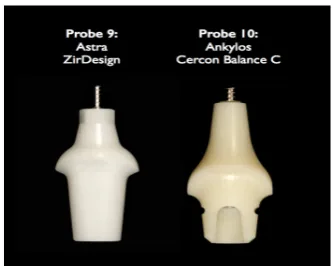
Sample 9: Astra ZirDesign (Dentsply Implants, Mannheim, Germany): prefabricated zirconia
stock abutment including connection geometry for Astra OsseoSpeed Implant.
Sample 10: Ankylos Cercon Balance C (Dentsply Implants, Mannheim, Germany): prefabricated
zirconia stock abutment including connection geometry for Ankylos C implant.
Sample production
For the present study, the master model came from a clinical case in which an implant
restoration had replaced the left maxillary central incisor. The emergence profile of the
peri-implant mucosa had been conditioned by a temporary peri-implant supported single crown. Eight
replicas of this master model were made in plaster, and each was adjusted in a parallelometer
so that the planned implant analogs from the different manufacturers could be aligned in the
same vertical and horizontal position. This ensured that the fabrication conditions for the
CAD/CAM abutments were identical despite different connection geometries.
After drilling a central hole in the planned implant position, the corresponding implant analog
from each respective manufacturer was positioned and plastered. Eight master models were
therefore produced in which the relationship of the implant shoulder to the emergence profile
was identical. To ensure that the abutment samples from different CAM systems on different
implant types were comparable, a standardized wax-up of the abutment was made of try-in
resin (with eight different connection geometries) (Figs. 3a & b). The specifications for the outer
geometry of the one- and two-piece CAD/CAM abutments were identical and designed so that
the planned crown margin was just below the mucosa and followed its anatomically curved line
(Figs. 4 a & b). For the one-piece CAD/CAM abutments, the different manufacturers were
commissioned to produce a custom zirconia abutment, taking the emergence profile into
zirconia sleeves were gritblasted in the laboratory (aluminum oxide particles 50μm; 2 bar/ 0.25
MPa; 20 seconds; distance 10 mm) and cleaned with alcohol. The titanium inserts were then
moistened with a metal primer solution (GC MetalPrimer II, GC EUROPE N.V, Leuven,
Belgium), while a bonding material (Monobond Plus, Ivoclar Vivadent GmbH, Schaan,
Liechtenstein) was applied to the basal parts of the CAD/CAM zirconia sleeves. All hybrid
abutments were bonded with a composite cement (Multilink Hybrid Abutment, Ivoclar Vivadent
GmbH, Schaan, Liechtenstein) in the laboratory, according to the manufacturer's instructions.
Excess adhesive was then removed, followed by polishing of the luting joint with silicone
polishers and polishing paste.9 The zirconia stock abutments of the control group (Astra
ZirDesign and Ankylos Cercon Balance C; both from Dentsply Implants, Mannheim, Germany)
were removed from the manufacturer's original packaging and underwent profilometric
examination immediately.
Profilometry
Profilometry was performed by means of a focus-variation system (Infinite Focus Standard G4,
Alicona Imaging GmbH, Graz, Austria), in which form and roughness can be measured in one
procedure. Focus-variation microscopy is a method for contact-free measurement of surfaces
using optical devices with a low depth of focus. Depending on the surface topography, only
limited regions are shown sharply, while the object being examined is scanned vertically. The
actual depth can be found for each measurement point through differences in the depth of focus
and the distance at which a certain measurement point is shown in sharp focus. With this
system, surfaces in the micrometer and nanometer range can be measured. Two-dimensional
(2D) and three-dimensional (3D) representations are possible. However, 2D measurement does
not always suffice to describe the functionality of a surface exactly, especially if the surface has
randomly distributed structural elements. To obtain a 3D representation, the depth of focus is
these values results in a graphic surface relief of the investigated implant abutment. This is an
area-based method.
Experiment design
The zirconia test abutments first underwent macroscopic visual inspection. The emergence
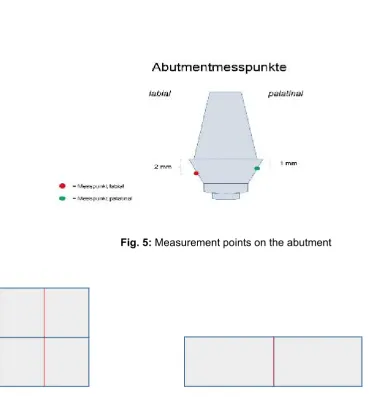
profile, shoulder line, and overall impression were evaluated. For microscopic examination, two
measurement points on the trans- and submucosal part of the abutment surface were defined,
both of which were in the region of the biological width. The first measurement point was on the
labial side of the abutment, 2mm below the prosthetic shoulder. The second measurement point
was on the palatal side of the abutment, 1mm below the prosthetic shoulder (Fig. 5).
The emphasis in the profilometry was on 2D and 3D measurement of the surface roughness. To
evaluate this, the raw measurement data signals were first processed technically. The surface
of the abutment was broken down into single points that delivered information about the surface
form and waviness. The first step was to remove the form via a so-called F operator and then
the short-wave deviations via a low-pass filter (S filter). With the resulting S-F surface, the form
deviations and waviness, which, unlike roughness, give low-frequency signals, are removed via
a special high-pass filter (L filter). The different parameters of roughness could then be
calculated from the resulting S-L surface. The mean roughness (Ra) and total height of the
roughness profile (Rt) were determined from the 2D measurement as amplitude parameters.
The spatial parameters obtained from the 3D measurement were the mean surface roughness
(Sa), the maximum height of the selected surface (Sz), and the relative rough surface (Sdr).
Before performing the actual measurement, the form deviation of the selected implant abutment
was reduced to one surface by using a third- and fourth-order polynomial calculation (cubic and
quadratic function). The threshold wavelength lambda C was then set to 250 µm. Values with a
filter. A 20x lens was used in the subsequent measurements. (For technical details see Table
1.) This yielded a measurement area with a height of 0.544 mm and width of 0.715 mm. Two
contiguous areas were measured per side. Since the macroscopic shape of the different test
abutments showed pronounced differences in the subgingival region, some of the areas to be
measured were positioned one on top of the other and some next to each other. The segment
for determining the R values (Ra, Rt) was drawn vertically through the established area and
corresponded to the red line in Fig. 6. The S values (Sa, Sz, Sdr) were obtained from the total
area comprising the individual areas.
Results
Figures 7 through 10 display the true- and false-color images of the labial and palatal sides of
the eight test abutments. Tables 1 through 9 present the findings for Ra, Rt, the Ra/Rt ratio and
difference, Sa, Sz, Sdr, and the Sz/Sa ratio and difference. Table 10 summarizes all the 2D and
3D measurements.
Discussion
The surface structure and roughness of the marginal implant neck and their influence on the
adaptation of the peri-implant soft tissue are the subject of numerous studies.15,21-23 Studies of
the surface structure of stock or CAD/CAM customized zirconia implant abutments, however,
are only fragmentary.24,25 The aim of the present study, therefore, was to characterize the
surface topography of the trans- and submucosal zone of CAD/CAM zirconia ceramic
abutments by means of focus-variation microscopy. The surface topography was usually
assessed through the parameters of form, waviness, and roughness, with form, also called the
profile, representing the coarsest and roughness the finest unevenness. Waviness and
roughness are often combined under the term texture.2
The accuracy of roughness determination depends on the degree to which errors of the form
and waviness parameters can be removed. However, there is still no generally accepted
standard as to where the parameter of roughness ends and waviness begins. Wennerberg and
Albrektsson have proposed guidelines on the topographic analysis of roughness and
microgeometry for the standardized examination of titanium implants.26 They classify implant
surfaces with Sa values of 0.5-1.0 µm as smooth, Sa values between 1-2 µm as moderately
rough, and Sa values over 2 µm as rough. How useful this classification is for ceramic implant
abutments also depends directly on the range of roughness to be found in vivo.27
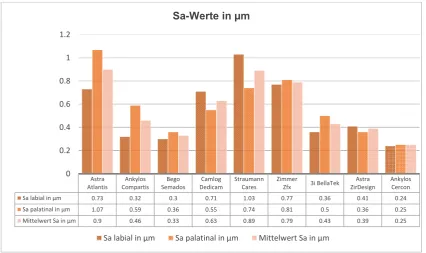
Six of eight CAD/CAM test ceramic abutments -- 3i BellaTek (0.43 µm), Ankylos Compartis
(0.46 µm), Camlog Dedicam (0.63 µm), Zimmer Zfx (0.79 µm), Straumann Cares (0.89 µm) and
Astra Atlantis (0.9 µm) -- demonstrated a Sa value of less than 1 µm. These Sa values
correspond to a smooth surface, according to Wennerberg and Albrektsson's classification,
which was proposed in principle for endosteal implant surfaces. By contrast, the Procera
abutment was in the rough surface range, with an Sa value of 2.22 µm. Whether the Procera
abutment involved a single case or whether the greater roughness can be attributed to the
manufacturing process could be only partially explained by a systematic examination of the
series, as each determination of roughness always refers only to a limited part of the total
surface. With its mean Sa value of 0.33 µm, the Bego Semados abutment ranked between the
two prefabricated abutments (Ankylos Cercon 0.25 µm and Astra ZirDesign 0.39 µm). All
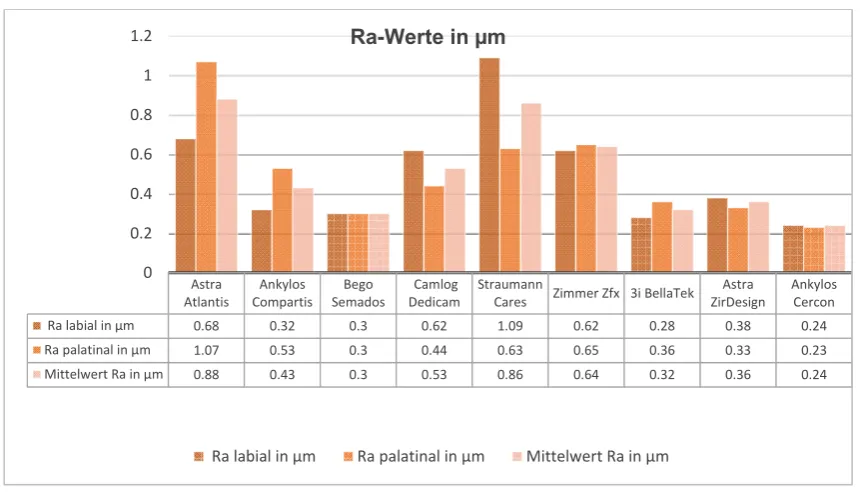
investigated CAD/CAM implant abutments exceeded the roughness threshold of Ra = 0.2 µm
proposed by Bollen et al. for abutment surfaces13 and thus showed an increased risk of
mechanical plaque retention. (The prefabricated Ankylos Cercon abutment came closest to this
value with an Ra value of 0.24 µm.) The results demonstrate that further manual processing of
the transmucosal area of the tested CAD/CAM zirconia abutments in the laboratory would be
Recent data have thrown into question the reliability of Ra values for determining the surface
roughness of implant abutments. Instead the Sa value has become established as the basis for
assessing surface roughness. However, this is a mean that does not permit a conclusion about
the maximum heights or depths of the surface and the frequency of their occurrence. The Sz
and Sdr values can deliver additional information. As the present investigations show, the
maximum heights of the measured surface (Sz value) range from 7.1 times (Astra Atlantis) to 15
times (Camlog Dedicam) the arithmetic means of the Sa. The Nobel Procera abutment, with a
9.4-fold value, was also in this range. The difference (with the exception of the Nobel Procera at
18.6 µm) between maximum height (Sz) and arithmetic mean (Sa) was between 3.1 µm
(Ankylos Cercon) and 8.8 µm (Camlog Dedicam). Since the maximum height can also be
influenced by impurities on the surface, its validity can only be evaluated to a limited degree.
The Sdr value of a surface should therefore be included when assessing it. This represents the
relationship of the excess of the true area to the projected area as a percentage. This value can
provide evidence about the frequency of unevennesses (heights and depths) when additional
information is available from the Sz value.
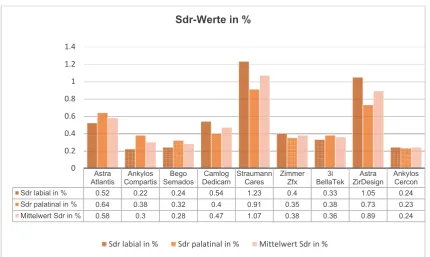
It was seen that the prefabricated Astra ZirDesign abutment, with an excess of 0.89% (Sa 0.39
µm, Sz 4.93 µm), was markedly over the excess of many other abutments, with greater Sa and
Sz values. The Camlog Dedicam abutment, by contrast, had an Sdr of only 0.49% (Sa 0.63 µm,
Sz 9.42 µm). It can therefore be assumed that there was a greater frequency of unevennesses
in the tested Astra ZirDesign abutment. Comparison of the different roughness parameters
shows that statement of a single parameter has only limited validity as regards the surface
texture. The Sa value as arithmetic mean possibly represents the most important parameter for
assessment. To obtain a more detailed overview of the surface characteristics, however,
inclusion of the maximum height (Sz) and area excess (Sdr) appears useful. Consequently,
parameters Sa, Sz, and Sdr. A guide to assessment of the surface roughness of ceramic
abutments might look like Table 12.
With the aid of focus-variation microscopy, too, evidence about the possible CAD/CAM
production process or possible further processing of the abutment can be obtained. The surface
structures of the 3i BellaTek, Bego Semados, Zimmer Zfx, and Ankylos Compartis CAD/CAM
zirconia abutments showed major shared features, indicating a similar production process. The
different roughnesses could be attributable to the use of different diamond grits. The Astra
Atlantis and the Nobel Procera abutment are manufactured according to a similar method but
other processing instruments apparently were used. In the case of the CAD/CAM zirconia
abutment from Nobel Procera, it can be assumed that coarser diamond grit was used during
production, which would explain the greater surface roughness compared with the other test
abutments. A different processing tool must have been used for the Straumann Cares abutment
because of the assessible surface structure. The Camlog Dedicam abutment has the most
unusual surface morphology. Erosions are seen, which suggest deliberate secondary
processing. Grit blasting of the basal aspect of the CAD/CAM zirconia coping was possibly
carried out prior to luting the coping to the titanium base in the laboratory. Since computer-aided
construction and manufacture of custom implant abutments obviously involves different
manufacturing and processing variations in specific systems, it appears reasonable to introduce
a more precise definition that describes and differentiates the respective production process.
Kapos and Evans have proposed the term "Complete CAD/CAM Product" for this, meaning that
Competing Interest
PG, WK and CF state that there are no conflicts of interest.
Authors' Contributions
PG, WK and CF contributed to the design of the study. PG and WK contributed to study
selection and data extraction. All authors read, revised, and approved the final manuscript.
Acknowledgements
The authors gratefully acknowledge Mr. Florian Tebbel for his contribution to data analysis and
References
1. Brito C, Tenenbaum HC, Wong BK, Schmitt C, Nogueira-Filho G. Is keratinized mucosa
indispensable to maintain peri-implant health? A systematic review of the literature. J Biomed
Mater Res B Appl Biomater 2014;102(3):643-650.
2. Rompen E, Domken O, Degidi M, Pontes AE, Piattelli A. The effect of material
characteristics, of surface topography and of implant components and connections on soft
tissue integration: a literature review. Clin Oral Implants Res 2006;17(Suppl 2):55–67.
3. Baharloo B, Textor M, Brunette DM. Substratum roughness alters the growth, area and focal
adhesions of epithelial cells, and their proximity to titanium surfaces. J Biomed Mater Res A
2005;74(1):12-22.
4. Nakamura K, Kanno T, Milleding P, Ortengren U. Zirconia as a dental implant abutment
material: a systematic review. Int J Prosthodont 2010;23:299–309.
5. Zembic A, Sailer I, Jung RE, Hämmerle CH. Randomized-controlled clinical trial of
customized zirconia and titanium implant abutments for single-tooth implants in canine and
posterior regions: 3-year results. Clin Oral Implants Res 2009;20:802-808.
6. Sailer I, Philipp A, Zembic A, Pjetursson BE, Hämmerle CH, Zwahlen M. A systematic review
of the performance of ceramic and metal implant abutments supporting fixed implant
reconstructions. Clin Oral Implants Res 2009;20(Suppl 4):4–31.
7. Sailer I, Zembic A, Jung RE, Hammerle CH, Mattiola A. Single-tooth implant reconstructions:
esthetic factors influencing the decision between titanium and zirconia abutments in anterior
regions. Eur J Esthet Dent 2007;2:296–310.
8. Degidi M, Artese L, Scarano A, Perrotti V, Gehrke P, Piattelli A. Inflammatory infiltrate,
microvessel density, nitric oxide synthase expression, vascular endothelial growth factor
expression, and proliferative activity in peri-implant soft tissues around titanium and zirconium
oxide healing caps. J Periodontol 2006;77(1):73-80.
zirconia implant abutments. Clin Implant Dent Relat Res 2014;16(6):920-925.
10. Sailer I, Sailer T, Stawarczyk B, Jung RE, Hämmerle CH. In vitro study of the influence of
the type of connection on the fracture load of zirconia abutments with internal and external
implant-abutment connections. Int J Oral Maxillofac Implants 2009;24:850–858.
11. Truninger TC, Stawarczyk B, Leutert CR, Sailer TR, Hammerle CH, Sailer I. Bending
moments of zirconia and titanium abutments with internal and external implant-abutment
connections after aging and chewing simulation. Clin Oral Implants Res 2012;23:12–18.
12. Quirynen M, Bollen CM, Papaioannou W, Van Eldere J, van Steenberghe D. The influence
of titanium abutment surface roughness on plaque accumulation and gingivitis: short-term
observations. Int J Oral Maxillofac Implants 1996;11:169–178.
13. Bollen CML, Papaioannou W, Van Eldere J, Quirynen M, Van Steenberghe D. The influence
of abutment surface roughness on plaque accumulation and peri-implant mucositis. Clin Oral
Impl Res 1996;7:201-211.
14. Linkevicius T, Apse P. Influence of abutment material on stability of peri-implant tissues: a
systematic review. Int J Oral Maxillofac Implants 2008;23:449–456.
15. Nothdurft FP, Fontana D, Ruppenthal S, May A, Aktas C, Mehraein Y, et al. Differential
behavior of fibroblasts and epithelial cells on structured implant abutment materials: A
comparison of materials and surface topographies. Clin Implant Dent Relat Res 2014 Jul 26.
doi: 10.1111/cid.12253. [Epub ahead of print].
16. Berglundh T, Lindhe J, Ericsson I, Marinello CP, Liljenberg B, Thomsen P. The soft tissue
barrier at implants and teeth. Clin Oral Implants Res 1991;2:81-90.
17. Teughels W, Van Assche N, Sliepen I, Quirynen M. Effect of material characteristics and/or
surface topography on biofilm development. Clin Oral Implants Res 2006;17(Suppl 2):68–81.
18. Kasemo B, Lausmaa J. Biomaterial and implant surfaces: on the role of cleanliness,
contamination and preparation procedures. J Biomed Mater Res 1988;22(A2 Suppl):145-158.
stock abutments versus CAD/CAM abutments: a radiographic and scanning electron
microscopy study. Ann Stomatol (Roma)2010;1(3-4):9-13.
20. Albrektsson T, Wennerberg A. Oral implant surfaces: Part 1— Review focusing on
topographic and chemical properties of different surfaces and in vivo responses to them. Int J
Prosthodont 2004;17:536–543.
21. Berglundh T, Lindhe J, Ericsson I, Marinello CP, Liljenberg B, Thomsen P. The soft tissue
barrier at implants and teeth. Clin Oral Implants Res 1991;2:81-90.
22. Mustafa K, Silva Lopez B, Hiltenby K, Wennerberg A, Arvidson K. Attachment and
proliferation of human oral fibroblasts to titanium surfaces blasted with TiO2 particles. A
scanning electron microscopic and histomorphometric analysis. Clin Oral Impl Res
1998;9:195-207.
23. Lauer G, Wiedemann-Al-Ahmed M, Otten JE, Hübner U, Schmelzeisen R, Schilli W. The
titanium surface texture effects adherence and growth of human gingival keratocytes and
human maxillary osteoblast-like cells in vitro. Biomaterials 2001;22:2799-2809.
24. Mustafa K, Oden A, Wennerberg A, Hultenby K, Arvidson K. The influence of surface
topography of ceramic abutments on the attachment and proliferation of human oral fibroblasts.
Biomaterials 2005;26(4):373-381.
25. Pae A, Lee H, Kim HS, Kwon YD, Woo YH. Attachment and growth behaviour of human
gingival fibroblasts on titanium and zirconia ceramic surfaces. Biomed Mater 2009;4(2):025005.
doi: 10.1088/1748-6041/4/2/025005. Epub 2009 Feb 11.
26. Wennerberg A, Albrektsson T. Suggested guidelines for the topographic evaluation of
implant surfaces. Int J Oral Maxillofac Implants 2000;15(3):331-344.
27. Albrektsson T, Wennerberg A. Oral implant surfaces: Part 1--review focusing on topographic
and chemical properties of different surfaces and in vivo responses to them. Int J Prosthodont
28. Kapos T, Evans C. CAD/CAM technology for implant abutments, crowns, and
superstructures. Int J Oral Maxillofac Implants 2014;29 Suppl:117-136.
Figure Legends
Fig. 1: Overview of the one- and two-piece CAD/CAM zirconia test abutments
Fig. 2: Prefabricated control abutments
Figs. 3a & b: CAD abutment construction in position 21 generated from a standardized wax-up of the respective abutment made of try-in resin. Labial and occlusal view in
Abutment-DesignerTM Degudent/ 3 Shape.
Figs. 4a & b: Milled CAD/CAM zirconia abutment in position 21 on master model, labial and occlusal views
Fig. 5: Measurement points on the abutment
Fig. 6: Measurement segments for determining the R values (Ra, Rt): vertical red line.
Fig. 7: True-color display of all eight individual CAD/CAM ZrO2 abutments from the labial side Fig. 8: True-color display of all eight individual CAD/CAM ZrO2 abutments from the palatal side Fig. 9: False-color images of all eight individual CAD/CAM ZrO2 abutments from the labial side Fig. 10: False-color images of all eight individual CAD/CAM ZrO2 abutments from the palatal side
Fig. 2: Prefabricated control abutments
Figs. 3a & b: CAD abutment construction in position 21 generated from a standardized wax-up of the respective abutment made of try-in resin. Labial and occlusal view in
Abutment-DesignerTM Degudent/ 3 Shape.
Fig. 5: Measurement points on the abutment
Fig. 7: True-color display of all eight individual CAD/CAM ZrO2 abutments from the labial side
Fig. 9: False-color images of all eight individual CAD/CAM ZrO2 abutments from the labial side
Table 1: Ra values with Nobel Procera abutment
Because of the much greater roughness of the Nobel Procera abutments (two to nine times
greater), for greater clarity it was not included in the following graph of the individual results.
Table 2: Ra values without Nobel Procera abutment
Astra Atlantis Ankylos Compartis Bego Semados Camlog Dedicam Nobel Procera Straumann
Cares Zimmer Zfx 3i BellaTek Astra ZirDesign
Ankylos Cercon Ra labial in µm 0.68 0.32 0.3 0.62 2.22 1.09 0.62 0.28 0.38 0.24 Ra palatinal in µm 1.07 0.53 0.3 0.44 1.95 0.63 0.65 0.36 0.33 0.23
Mittelwert Ra in µm 0.88 0.43 0.3 0.53 2.09 0.86 0.64 0.32 0.36 0.24
0 0.5 1 1.5 2
2.5 Ra-Werte in µm mit Nobel Procera
Ra labial in µm Ra palatinal in µm Mittelwert Ra in µm
Astra Atlantis Ankylos Compartis Bego Semados Camlog Dedicam Straumann
Cares Zimmer Zfx 3i BellaTek Astra ZirDesign
Ankylos Cercon
Ra labial in µm 0.68 0.32 0.3 0.62 1.09 0.62 0.28 0.38 0.24
Ra palatinal in µm 1.07 0.53 0.3 0.44 0.63 0.65 0.36 0.33 0.23
Mittelwert Ra in µm 0.88 0.43 0.3 0.53 0.86 0.64 0.32 0.36 0.24
0 0.2 0.4 0.6 0.8 1
1.2 Ra-Werte in µm
Table 3: Rt values without Nobel Procera abutment
Table 4: Rt/Ra ratio with Nobel Procera abutment/ 2D measurements, Rt/Ra ratio, Rt – Ra difference
Astra
Atlantis CompartisAnkylos SemadosBego DedicamCamlog StraumannCares ZimmerZfx 3i BellaTek ZirDesignAstra AnkylosCercon
Rt labial in µm 3.48 2.23 2.08 3.75 6.55 4.33 1.91 3.43 1.45
Rt palatinal in µm 5.22 3.18 1.94 3.47 4.8 4.4 2.46 2.22 1.38
Mittelwert Rt in µm 4.35 2.71 2.01 3.61 5.67 4.37 2.2 2.83 1.42
0 1 2 3 4 5 6 7
Rt-Werte in µm
Rt labial in µm Rt palatinal in µm Mittelwert Rt in µm
Astra Atlantis Ankylos Compartis Bego Semados Camlog Dedicam Nobel Procera Straumann Cares Zimmer
Zfx 3i BellaTek Astra ZirDesign
Ankylos Cercon
Mittelwert Rt in µm 4.35 2.71 2.01 3.61 10.2 5.67 4.37 2.2 2.83 1.42
Mittelwert Ra in µm 0.88 0.43 0.3 0.53 2.09 0.86 0.64 0.32 0.36 0.24
Quotient Rt/Ra 4.94 6.3 6.7 6.81 4.88 6.59 6.83 6.88 7.86 5.92
0 2 4 6 8 10 12 Quotient Rt/Ra
Table 5: Rt –Ra difference with Nobel Procera abutment
3D measurement data: Sa, Sz, Sdr
Table 6: Sa values without Nobel Procera abutment
Astra Atlantis Ankylos Compartis Bego Semados Camlog Dedicam Nobel Procera Straumann Cares Zimmer
Zfx 3i BellaTek Astra ZirDesign
Ankylos Compartis
Mittelwert Rt in µm 4.35 2.71 2.01 3.61 10.2 5.67 4.37 2.2 2.83 1.42
Mittelwert Ra in µm 0.88 0.43 0.3 0.53 2.09 0.86 0.64 0.32 0.36 0.24
Differenz Rt-Ra in µm 3.47 2.28 1.71 3.08 8.11 4.81 3.73 1.88 2.47 1.18
0 2 4 6 8 10 12
Differenz Rt - Ra
Mittelwert Rt in µm Mittelwert Ra in µm Differenz Rt-Ra in µm
Astra Atlantis Ankylos Compartis Bego Semados Camlog Dedicam Straumann Cares Zimmer
Zfx 3i BellaTek Astra ZirDesign
Ankylos Cercon
Sa labial in µm 0.73 0.32 0.3 0.71 1.03 0.77 0.36 0.41 0.24
Sa palatinal in µm 1.07 0.59 0.36 0.55 0.74 0.81 0.5 0.36 0.25
Mittelwert Sa in µm 0.9 0.46 0.33 0.63 0.89 0.79 0.43 0.39 0.25
0 0.2 0.4 0.6 0.8 1 1.2
Sa-Werte in µm
Table 7: Sz values without Nobel Procera abutment
Table 8: Sdr values in % without Nobel Procera abutment Astra Atlantis Ankylos Compartis Bego Semados Camlog Didicam Straumann Cares Zimmer Zfx 3i BellaTek Astra ZirDesign Ankylos Cercon
Sz labial in µm 6.22 3.76 3.77 10.05 9.57 7.45 4.82 5.58 3.12
Sz palatinal in µm 6.53 6.42 4.76 8.78 7.92 9.4 6.91 4.28 3.56
Mittelwert Sz in µm 6.38 5.09 4.27 9.42 8.75 8.43 5.87 4.93 3.34
0 2 4 6 8 10 12
Sz-Werte in µm
Sz labial in µm Sz palatinal in µm Mittelwert Sz in µm
Astra
Atlantis CompartisAnkylos SemadosBego DedicamCamlog StraumannCares ZimmerZfx BellaTek3i ZirDesignAstra AnkylosCercon
Sdr labial in % 0.52 0.22 0.24 0.54 1.23 0.4 0.33 1.05 0.24
Sdr palatinal in % 0.64 0.38 0.32 0.4 0.91 0.35 0.38 0.73 0.23
Mittelwert Sdr in % 0.58 0.3 0.28 0.47 1.07 0.38 0.36 0.89 0.24
0 0.2 0.4 0.6 0.8 1 1.2 1.4
Sdr-Werte in %
3D measurement data: Sz/Sa ratio, Sz – Sa difference
Table 9: Sz/Sa ratio with Nobel Procera abutment
Table 10: Sz –Sa difference with Nobel Procera abutment Astra
Atlantis CompartisAnkylos SemadosBego DedicamCamlog ProceraNobel StraumannCares ZimmerZfx 3i BellaTek ZirDesignAstra AnkylosCercon Mittelwert Sz in µm 6.38 5.09 4.27 9.42 29.84 8.75 8.43 5.87 4.93 3.34 Mittelwert Sa in µm 0.9 0.46 0.33 0.63 2.22 0.89 0.79 0.43 0.39 0.25 Quotient Sz/Sa 7.09 11.07 12.94 14.95 9.39 9.83 10.67 13.65 12.64 13.36
0 5 10 15 20 25 30 35
Quotient Sz/Sa
Mittelwert Sz in µm Mittelwert Sa in µm Quotient Sz/Sa
Astra
Atlantis CompartisAnkylos SemadosBego DedicamCamlog ProceraNobel StraumannCares ZimmerZfx BellaTek3i ZirDesignAstra AnkylosCercon Mittelwert Sz in µm 6.38 5.09 4.27 9.42 29.84 8.75 8.43 5.87 4.93 3.34 Mittelwert Sa in µm 0.9 0.46 0.33 0.63 2.22 0.89 0.79 0.43 0.39 0.25 Differenz Sz-Sa in µm 5.48 4.63 3.94 8.79 18.62 7.86 7.64 5.44 4.54 3.09
0 5 10 15 20 25 30 35
Differenz Sz - Sa
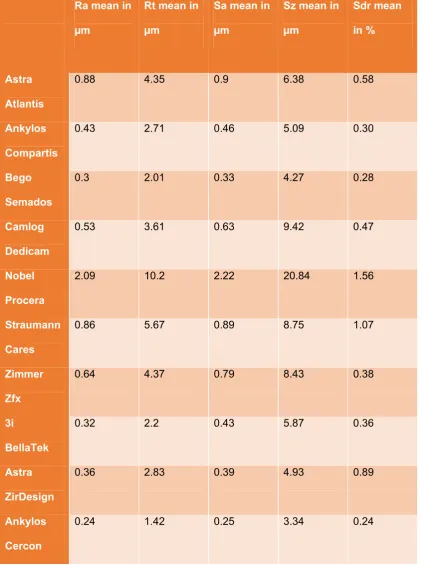
Ra mean in
µm
Rt mean in
µm
Sa mean in
µm
Sz mean in
µm
Sdr mean
in %
Astra
Atlantis
0.88 4.35 0.9 6.38 0.58
Ankylos
Compartis
0.43 2.71 0.46 5.09 0.30
Bego
Semados
0.3 2.01 0.33 4.27 0.28
Camlog
Dedicam
0.53 3.61 0.63 9.42 0.47
Nobel
Procera
2.09 10.2 2.22 20.84 1.56
Straumann
Cares
0.86 5.67 0.89 8.75 1.07
Zimmer
Zfx
0.64 4.37 0.79 8.43 0.38
3i
BellaTek
0.32 2.2 0.43 5.87 0.36
Astra
ZirDesign
0.36 2.83 0.39 4.93 0.89
Ankylos
Cercon
0.24 1.42 0.25 3.34 0.24
Sa value Assessment parameter
Smooth
surface Sa < 0.2 µm Insufficient connective tissue adherence (too smooth)
Moderately
rough
surface
Sa 0.21-0.4 µm Tolerance range for optimal surface roughness
Rough
surface Sa >0.41 µm
Risk of plaque accumulation is greater than the
advantage of stable connective tissue adherence