Patron: Her Majesty The Queen Rothamsted Research Harpenden, Herts, AL5 2JQ
Telephone: +44 (0)1582 763133 Web: http://www.rothamsted.ac.uk/
Rothamsted Research is a Company Limited by Guarantee Registered Office: as above. Registered in England No. 2393175. Registered Charity No. 802038. VAT No. 197 4201 51. Founded in 1843 by John Bennet Lawes.
Rothamsted Repository Download
A - Papers appearing in refereed journals
Kendall, I. P., Lee, M. R. F. and Evershed, R. P. 2018. The effect of
trophic level on individual amino acid
δ15N
values in a terrestrial
ruminant food web. STAR: Science and Technology of Archaeological
Research. 3 (1), pp. 135-145.
The publisher's version can be accessed at:
•
https://dx.doi.org/10.1080/20548923.2018.1459361
The output can be accessed at:
https://repository.rothamsted.ac.uk/item/847w3
.
© 3 May 2018, Rothamsted Research. Licensed under the Creative Commons CC BY.
Full Terms & Conditions of access and use can be found at
http://www.tandfonline.com/action/journalInformation?journalCode=ysta20
STAR: Science & Technology of Archaeological Research
ISSN: (Print) 2054-8923 (Online) Journal homepage: http://www.tandfonline.com/loi/ysta20
The effect of trophic level on individual amino acid
δ
15
N values in a terrestrial ruminant food web
Iain P. Kendall, Michael R.F. Lee & Richard P. Evershed
To cite this article: Iain P. Kendall, Michael R.F. Lee & Richard P. Evershed (2018): The effect of trophic level on individual amino acid δ15N values in a terrestrial ruminant food web, STAR: Science & Technology of Archaeological Research, DOI: 10.1080/20548923.2018.1459361
To link to this article: https://doi.org/10.1080/20548923.2018.1459361
© 2018 The Author(s). Published by Informa UK Limited, trading as Taylor & Francis Group
Published online: 03 May 2018.
Submit your article to this journal
Article views: 94
View related articles
The effect of trophic level on individual amino acid
δ
15N values in a terrestrial
ruminant food web
Iain P. Kendalla, Michael R.F. Leeb,cand Richard P. Eversheda
a
Organic Geochemistry Unit, School of Chemistry, University of Bristol, Bristol BS8 1TS, UK;bBristol Veterinary School, University of Bristol, Langford BS40 5DU, UK;cRothamsted Research, North Wyke, Okehampton EX20 2SB, UK
ABSTRACT
Bulk collagenδ15N analysis is widely used to investigate past diet and trophic positions, but these values average the δ15N values of the constituent amino acids. Compound–specific
isotope analysis of amino acids (AAs) can help elucidate the complex metabolic effects underpinning bulkδ15N values. Although trophic level effects on individual AA δ15N values have been investigated in aquatic and terrestrial invertebrate food webs, most archaeological applications involve terrestrial herbivores, hence a greater understanding of these effects between diet and consumer in this food chain is required. The North Wyke Farm Platform provided baseline nitrogen isotope information for cattle grazing on a Lolium perenne -dominated pasture. Bulk dentineδ15N values show a shift expected for a one trophic level increase, but obscure insight into the underlying metabolic processes that cause this change in value. However, determination of AAδ15N values of hydrolysable plant protein and cattle tooth dentine clarifies the trophic effect on consumer AAδ15N values. The observed trophic
shift in the studied system is different from previously studied food webs, with a trophic enrichment factor, based on the δ15N values of glutamate and phenylalanine, of 4.0‰ compared to 7.6‰commonly used in ecological and archaeological studies. This emphasises the need to understand the trophic shifts in the particular food web being investigated in order to apply isotopic investigations in archaeological contexts.
ARTICLE HISTORY
Received 31 May 2017 Accepted 15 March 2018
KEYWORDS
Nitrogen isotopes; controlled diet; dentine collagen;Lolium
perenne; cattle
Introduction
The nitrogen isotopic signature of an organism’s tis-sues is related to theδ15N value of its diet, with consu-mer15N generally being enriched by ca. 3-5‰relative to diet (DeNiro and Epstein 1981, Minagawa and Wada 1984, Schoeninger and DeNiro 1984). The enrichment is believed to result from nitrogen isotopic fractionations involving the transamination and dea-mination of nitrogen-containing biosynthetic inter-mediates in the consumer. The diet-consumer enrichment has been used to determine the trophic position of organisms within a food web: if theδ15N values of the primary producers at the base of the food web and of the consumer are known, then the trophic level can be calculated based on the number of diet-consumer fractionations between the consumer and producer δ15N values. Although the average trophic Δ15N value, i.e. the difference between diet and consumerδ15N values, of 3.4‰is often used for trophic level calculations, a wide range of trophic enrichment Δ15N values have been documented, ran-ging from -2.1‰ to + 9.2‰ (DeNiro and Epstein
1981, Post 2002, McCutchan et al. 2003, Vanderklift and Ponsard 2003, Spence and Rosenheim 2005, Caut et al.2009).
Interpretations of bulk isotopic values in ecology and archaeology may be hindered by an incomplete understanding of the complex biochemical pathways and mechanisms which control nitrogen stable isotope ratios. For example, manuring of crops consumed by prehistoric humans or their animals may lead to an apparent trophic level effect (Bogaard et al. 2007). Aridity (Heaton1987) and nutritional stress (Hobson et al.1993) can also lead to changes in nitrogen isotope ratios. Investigation of nitrogen stable isotope values at the individual amino acid (AA) level can improve understanding of the isotope signals of various nitro-gen-containing biomolecules, and allows access to stable isotope information inaccessible to bulk methods. For example, manuring has been shown to cause a consistent increase in δ15N values across all AAs (Styring et al. 2014), which distinguishes this from trophic level effects whereδ15N values are seen to vary much more widely at the AA level, reflecting isotopic fractionations at specific points in protein bio-synthetic pathways (e.g. Hare et al.1991, McClelland and Montoya2002).
Additionally, differences in animal physiology can have a significant effect on AA δ15N values. For example, while excess nitrogen in mammals is mainly
© 2018 The Author(s). Published by Informa UK Limited, trading as Taylor & Francis Group
This is an Open Access article distributed under the terms of the Creative Commons Attribution License (http://creativecommons.org/licenses/by/4.0/), which permits unrestricted use, distribution, and reproduction in any medium, provided the original work is properly cited.
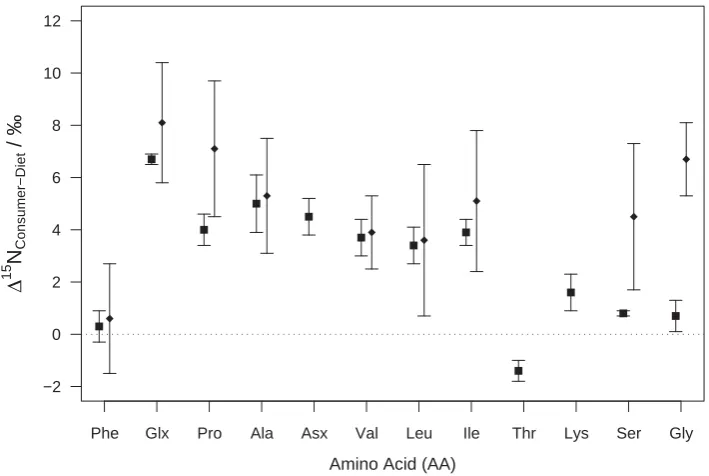
excreted as urea, some reptiles such as tortoises can excrete both urea and uric acid. The different metabolic pathways involved in producing uric acid are thought to be the cause of the lower glutamate δ15N values observed in these animals compared to mammals (Styring et al. 2010). A similar difference has been seen in penguins, which can directly excrete excess N as ammonia as well as uric acid (McMahon et al.2015). McClelland and Montoya (2002) determinedδ15N values of AAs from organisms in a marine food web. They observed that for some AAs, such as glutamic acid (Glu) and aspartic acid (Asp) – the ‘trophic group’ AAs – an increase in trophic level leads to a large enrichment in their δ15N values. For others, such as phenylalanine (Phe), glycine (Gly), serine (Ser) and tyrosine (Tyr) – the‘source group’ AAs – δ15N values remain essentially unchanged (Popp
et al.2007). Similar findings have been observed for terrestrial food webs (Chikaraishi et al. 2011), although the AAs in each group vary (Figure 1).
The differences in nitrogen isotope fractionations between different classes of organisms discussed above are believed to be due to differences in the meta-bolic pathways of these AAs (see O’Connell 2017). Transamination reactions, which involve breaking and formation of C-N bonds and therefore introduce kinetic isotope effects, result in the newly formed AAs being depleted in 15N, while the remaining AA pool will become enriched. The δ15N values of AAs involved in a greater number of transamination reac-tions will be more affected. For example, Phe is an essential AA in mammals, and is converted to Tyr as the major initial metabolic step (Bender1975), a pro-cess that does not involve breaking or making a C-N
bond. On the other hand, Glu plays a central role in AA biosynthesis, as the major initial metabolic step involves a transamination reaction, with the amino group donated to α–ketoacids to form other amino acids. Glu is also involved in nitrogen excretion, where deamination of Glu is the first step of urea for-mation (Bender1975).
These differences between source group and trophic group amino acids have been used in trophic level studies to estimate the trophic positions of organisms using the following equation:
TLGlx−Phe=
D15N
Glx−Phe +b
TEF +1% (Eq.1)
Where Δ15NGlx-Pheis the difference in δ15N values of
Glx and Phe in the tissue being studied,βis the differ-ence inδ15N values of Glx and Phe in the primary pro-ducers of the food chain, and TEF (the trophic enrichment factor, also known as the trophic discrimi-nation factor, TDF) is the15N-enrichment of Glx rela-tive to Phe with increasing trophic level. Based on AA δ15N values in marine photoautotrophs and
consu-mers, Chikaraishi et al. (2009) observed little variability in the determinedβvalue of -3.4‰and TEF of 7.6‰. However, these values are not universal across all taxa, or between different trophic level shifts. The value ofβ depends upon the ecosystem being studied, with β values of + 8.4‰ in C3-based terrestrial systems, or
-0.4‰ in C4 systems, determined by Chikaraishi
et al. (2010). Although these values were also found to correctly predict the trophic position of plants and insects in a terrestrial food web (Chikaraishi et al.
2011), studies of carnivorous aquatic species, such as
Phe Glx Pro Ala Asx Val Leu Ile Thr Lys Ser Gly
−2 0 2 4 6 8 10 12
Amino Acid (AA)
Δ
15
NConsumer−Diet
/ ‰
Figure 1.Differences between consumer and diet amino acidδ15N values in an aquatic (squares, n = 2; McClelland and Montoya
harbour seals (Germain et al.2013), fishes (Hoen et al.
2014), and penguins (McMahon et al.2015), revealed markedly lower TEFs of between 2 and 5‰. TEF values may also be affected by diet quality and dietary protein content, as higher protein diets can lead to lower TEFs (Chikaraishi et al.2015, Nielsen et al.2015, McMahon and McCarthy2016).
While to date these sorts of trophic level studies, involving both the consumers and their diet, have been performed in aquatic food webs (e.g. McClelland and Montoya2002, Pakhomov et al.2004, Chikaraishi et al.2007, Chikaraishi et al. 2009, Hoen et al.2014), microbial communities (Steffan et al.2015), and terres-trial invertebrate food webs (Chikaraishi et al. 2011, and see Ohkouchi et al. 2017 for a recent review of AA nitrogen isotope sudies), there have been very few studies into terrestrial vertebrate food webs, which include human infants (Romek et al. 2013), mice (Steffan et al.2015), and bears (Nakashita et al.
2011). No studies have yet been performed for ecologi-cally and archaeologiecologi-cally important ruminant herbi-vore food webs. Critically, ruminants have markedly different digestive systems to previously studied species, as well as different macronutrient contri-butions to their diet. Ingested protein can be classified as rumen undegradable protein, which passes through the rumen and is digested in the abomasum, and rumen degradable protein, which is degraded to ammonium via amino acids in the rumen. The latter is used for protein biosynthesis by rumen microbes, although some rumen microbes can directly utilise amino acids and peptides. These proteins are later digested, providing a protein source for the host rumi-nant (Figure 2). Consequently, ruminants have no essential amino acid requirements through microbial amino acid anabolism. Approximately 50-80% of
ruminant protein is obtained from rumen microbial protein (Ørskov1982), and therefore the dietary AAs are likely to undergo different trophic enrichment effects than non-ruminants which do not utilise microbial protein from the rumen.
The lack of information regarding the nitrogen tro-pic level effect in these common domestic herbivores constitutes a major gap in our knowledge of the isotope systematic of primary producers at the base of the human terrestrial food chain. Such information is vital to investigations of ancient food webs involving humans and their major food animals. In order to re-dress this, herein, we investigate the trophic level effect in ruminant animals for the first time at the amino acid level. For our investigation, we sampled the tissues of steers ofBos taurusgrazing within a controlled agricul-tural experiment, wherein the animals are raised solely on pastures and fodders of defined plant composition and origin, and the plants on which these animals were fed, thereby offering a unique opportunity to study the nitrogen isotopic interrelationships between animal diet and tissues at the AA level.
Materials and Methods
Plant and animal tissue sampling strategy
Plants and animal (Bos taurus) tissues for this study were sourced from the BBSRC National Capability -North Wyke Farm Platform, Rothamsted Research, Devon, UK ( www.rothamsted.ac.uk/north-wyke-farm-platform). This is a highly controlled farm-scale, long term experiment, which aims to address sustainable ruminant livestock production systems through a unique level of instrumentation and measurement. The farm platform comprises of three 20 ha
Figure 2.Nitrogen metabolism in ruminants, adapted from Satter and Roffler (1975).
self-contained grassland farms: (i) a ‘control’ perma-nent pasture, (ii) a grass: white clover pasture, and (iii) a pasture reseeded with innovative grass species, selected for their nutritional or environmental qualities. Each farm pasture system is managed as beef cattle (30 per system) and sheep (75 ewes and their lambs per sys-tem) enterprises with a high degree of control over inputs (fertiliser, labour, veterinary drugs etc.) and assessment of farm nutrient fluxes through hydrologi-cally isolated field catchments to measure loss into water (at a high temporal resolution; every 15 min) and Eddy covariance towers to assess air quality. The key concept of the Farm Platform is to determine man-agement pathways for sustainable ruminant livestock production through the assessment of social (meat qual-ity, animal welfare, biodiversity), economic (input costs, livestock production) and environmental (loss of nutrients to air and water) metrics and their associated trade-offs.
All the plant and animal specimens for this study were collected from the ‘control’ permanent pasture, which was dominated by perennial ryegrass (Lolium
perenne). Eight hand-plucked specimens ofL. perenne
were collected in October 2015. These samples were collected from points along transects across three fields comprising the 20 ha control pasture, using a 5 cm diameter corer, and the foliar tissue was separated from the roots and soil. The specimens were analysed individually to determine the natural variability in plantδ15N values.
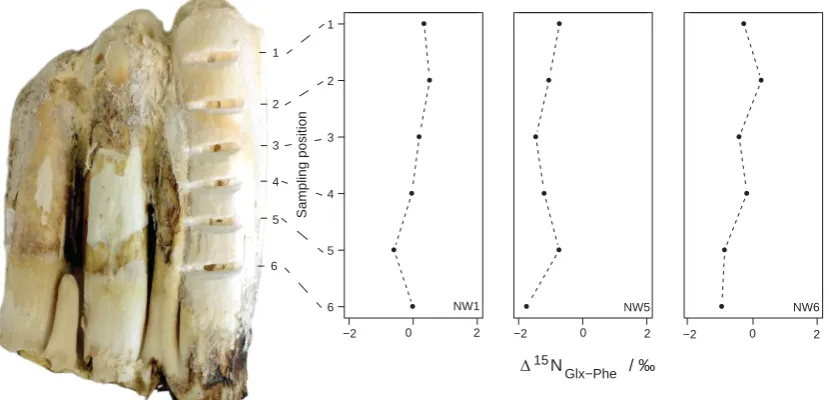
The North Wyke Farm Platform recruits 30 weaned Hereford-Friesian × Charolais cattle (balanced number of heifers and steers) to each of the three farm pasture systems each year from its commercial farm. The cattle sampled for this study had been grazed only in the con-trol pasture as described above. Therefore, these cattle have a well-defined, natural diet with no formulated animal feeds or pellets, which would otherwise affect the isotopic composition of consumers. The left man-dibular third molars (M3) of five steers were collected after the animals were slaughtered at 22 months of age (Confirmation Class R and Fat Class 4L). Formation of these teeth begins at ca. 12 month of age, and the crown is complete byca.24 months (Brown et al.1960). Com-ing up to slaughter weight gain is mainly in the form of fat (known as finishing, to meet fat class and confir-mation grades for the market), rather than rapid growth of muscle and bone, and therefore there will be no high turnover of nitrogen, as in the case of rapidly growing infant animals, during the period of formation of these teeth. To ensure there is no vari-ation in the isotopic composition across this period, three of these teeth were sequentially sampled at six points along the growth axis of each tooth. Once formed, dentine in teeth is not remodelled, and there-fore the collagen preserves the isotopic composition of the period of formation.
Analytical procedures
Plant leaves and stems were washed with double-dis-tilled water (DDW), lyophilised and ground to a pow-der. Lipids were extracted from the powdered samples with chloroform/methanol (2:1v/v, 2 × 3 mL) by ultra-sonication. Dentine from the left mandibular third molar was collected as a powder, using a modelling drill with a diamond abrasive drill bit.
Hydrolysis of proteins and derivatisation of AAs
AA N-acetyl isopropyl (NAIP) ester derivatives were
prepared according to established protocols (Corr et al. 2007, Styring et al. 2012). Briefly, norleucine was added as an internal standard to ca. 10 mg of tine or 25 mg of freeze-dried plant material. For den-tine, demineralisation of the inorganic fraction and hydrolysis of the collagen was achieved in one step by heating with acid (6 M HCl, 5 mL; 100°C, 24 h). The solutions were blown to dryness under nitrogen. Plant tissues were hydrolysed (6 M HCl, 5 mL; 100°C, 24 h) and allowed to cool before centrifugation (1700 ×g; 10 min). The hydrolysates were transferred to clean culture tubes with 0.1 M HCl (2 mL), and the solutions blown to dryness under nitrogen.
AAs were separated from other compounds using Dowex 50WX8 ion-exchange resin. The AAs were con-verted to their isopropyl esters by addition of a mixture of isopropanol and acetyl chloride (4:1v/v, 1 mL; 100°C, 1 h). Reagents were evaporated under a gentle stream of N2 (40°C). AA isopropyl esters were then
treated with a mixture of acetone, triethylamine and acetic anhydride (5:2:1 v/v/v, 1 mL; 60°C, 10 min). Reagents were removed under a gentle stream of N2
at room temperature, then 1 mL saturated NaCl sol-ution added, and NAIP esters extracted into ethyl acet-ate (3 × 3 mL). The solvent was evaporacet-ated under a gentle stream of N2 at room temperature. AA NAIP
ester derivatives were redissolved in ethyl acetate for analysis.
Asparagine and glutamine are converted into aspar-tic acid and glutamic acid respectively during hydroly-sis. Theδ15N value of Asx therefore combines the N of aspartate and the amino N of asparagine, while the δ15N value of Glx is a mean of the N of glutamate
and the amino N of glutamine.
Instrumental analyses
AAs were identified by GC-FID by comparison with AA standards, and quantified by comparison with a known amount of norleucine internal standard. Their δ15N values were determined by GC-C-IRMS as
Agilent Technologies, UK) and the oven temperature of the GC held at 40°C for 5 min before programming at 15°C min-1to 120°C, then 3°C min-1to 180°C, then 1.5°C min-1 to 210°C and finally 5°C min-1 to 270°C and held for 1 min. A Nafion drier removed water and a cryogenic trap removed CO2from the oxidised
and reduced sample. Isotopic compositions are expressed using the delta scale as follows: δ15N =
Rsample / Rstandard - 1, where R is the 15N/14N ratio,
and the standard is atmospheric N2 (AIR). All δ15N
values are reported relative to reference N2of known
isotopic composition, introduced directly into the ion source in four pulses at the start and end of each run. Each reported δ15N value is the mean of triplicate determinations. A standard mixture of AAs of known δ15N values was analysed every three runs to ensure
acceptable instrument performance.
Bulk 15N/14N analysis was performed by sample combustion in a Flash 112 elemental analyser (Thermo Quest, Milan) linked under continuous flow with a DeltaplusXP mass spectrometer (Thermo-Finnigan,
Bremen). Isotope ratios were calculated asδ15N versus atmospheric N2 by comparison with standards
cali-brated against IAEA-N-1 and N-2. The precision (1σ) among replicates of a quality control standard was 0.3‰forδ15N analysed in 9 separate runs.
Results
Bulkδ15N values were determined for plant tissues and dentine, and were shown to range from 3.1‰to 7.8‰
for the former, and 9.3‰to 10.0‰for the latter. The variability of the bulk tissue δ15N values between samples were of the same magnitude as in those of the individual AAs (see below), with a standard devi-ation of 1.8‰ for bulk plant tissue δ15N values, and 0.3‰for bulk dentineδ15N values.
Typical gas chromatograms for plant protein and collagen are shown in Figure 3. These match well with the expected AA distributions, based on the total hydrolysable amino acid content of Lolium per-enne(Yeoh and Watson1982), and of type I collagen (Eastoe 1955) and Bos taurus genome predictions (Table 1). The nitrogen isotopic compositions of 12 AAs from plant protein and 13 AAs from collagen were determined by GC-C-IRMS and are given in
Table 2. These AAs represent 90% of collagen AAs in cattle, and 85% of total hydrolysable AAs in Lolium perenne, accounting for 75% and 74% of AA nitrogen in the plants and animals, respectively. Although Hyp accounts for about 11% of AAs in collagen, it is syn-thesised as a post-translational modification of Pro, leading to very similar δ15N values in collagen Pro and Hyp. Hyp is present at very low abundance in plants.
In the figures AAs are ordered according to their metabolic relationships in plants, as described in Styr-ing, Fraser et al. (2014). Phe has a distinct metabolic pathway from the other AAs; Glx and Pro are closely related since the amino group of Pro comes from Glu; the amino group of Ala comes from Glu or γ-ami-nobutyric acid; the N from Asx can be exchanged with
10 20 30 40
Retention time / min
Relative intensity
Ala
Phe Hyp Glx Asx
Pro
Ser
Thr
Internal standard
Ile Leu Val Gly
Lys Tyr
(b)
10 20 30 40
Retention time / min
Relative intensity
Ala
Phe
Hyp Glx Asx
Pro Ser Thr
Internal standard
Ile Leu Val Gly
Lys
Tyr
(a)
Figure 3.Typical gas chromatograms for (a) plant protein AAs and (b) collagen AAs, showing the different AA distributions between diet and consumer tissues.
many AAs, including Glu and Ala; Val, Leu and Ile are branched-chain AAs; and Gly and Ser can be bio-synthesised from each other.
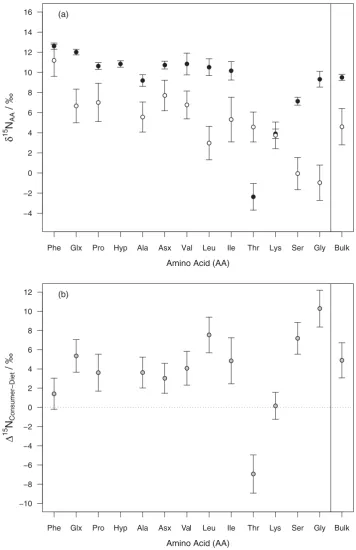
The plant AA δ15N values varied from -3.1‰ for Gly to 13.8‰for Phe, reflecting the isotopic fractiona-tions caused by the differences in individual AA rout-ing and metabolism (Figure 4(a)). A similarly wide range in collagen AAδ15N values was observed, from -4.8‰for Thr to 14.5‰for Leu. Variability inδ15N values between individual plant samples was larger than between collagen, with the standard deviation across the 8 samples ranging from 1.3‰ for Lys to 2.2‰ for Ile, while standard deviations of collagen AAs range from 0.3‰ to 1.1‰. Trophic enrichment in δ15N values from plant protein AAs to collagen (Δ15N
consumer-diet) vary for each AA, ranging from
-6.9‰to 10.3‰(Table 2), and are displayed inFigure 4
(b). Phe and Lys haveΔ15Nconsumer-dietvalues of 1.4 ±
1.6‰ and 0.2 ± 1.4‰ respectively. These values are within one standard deviation of 0‰, and therefore Phe and Lys fit their classification as source group AAs. All others showed a trophic enrichment to some extent, except threonine, which shows a consu-merδ15N value 6.9‰depleted relative to diet.
The sequentially sampled teeth show little variation in AAδ15N values across the growth axis of the teeth, with a maximum standard deviation of 1.1‰for Gly, and standard deviations for Δ15NGlx-Phe below 0.5‰
(Figure 5).
Discussion
The relatively large standard deviations about the mean plant bulk δ15N values and individual AA δ15N values reported here, of ca. 1.6‰ for each AA,
reflect the natural variations in nitrogen isotope values Table 1.AA concentrations for plant protein and dentine collagen as percentages of total hydrolysable AAs.
% total hydrolysable AA
Sample Phe Tyr Glx Pro Hyp Ala Asx Val Leu Ile Thr Lys Ser Gly
Plants 4.5 2.9 14.6 7.0 0.2 9.3 12.2 6.6 9.8 2.7 7.4 9.3 6.0 7.4
4.2 2.7 15.0 7.2 0.4 8.9 12.3 6.9 9.6 2.6 6.9 9.7 6.4 7.2
4.1 2.4 16.0 7.1 0.3 9.1 12.5 6.8 9.4 2.6 7.1 8.9 6.6 7.3
4.2 2.7 13.7 7.2 0.3 9.1 11.8 7.2 9.5 2.5 7.1 9.9 6.6 8.2
4.3 2.8 15.2 6.9 0.3 8.6 12.3 6.8 9.7 2.7 6.7 10.3 6.4 7.1
4.1 2.5 14.0 7.1 0.3 9.7 11.9 7.0 9.3 2.6 7.9 8.7 6.8 8.0
4.5 2.8 14.5 6.8 0.2 9.4 13.6 6.5 9.5 2.5 6.8 8.7 6.2 7.9
4.1 2.5 14.8 6.8 0.2 9.2 13.1 6.3 9.4 2.4 7.7 9.7 6.4 7.3
Mean 4.3 (0.2) 2.7 (0.2) 14.7 (0.7) 7.0 (0.2) 0.3 (0.1) 9.2 (0.3) 12.5 (0.6) 6.8 (0.3) 9.5 (0.2) 2.6 (0.1) 7.2 (0.4) 9.4 (0.6) 6.4 (0.2) 7.5 (0.4)
Dentine 1.2 0.7 11.7 13.1 10.2 9.5 8.9 4.9 3.6 0.8 3.0 3.6 6.3 22.5
collagen 1.1 0.6 11.8 13.4 10.2 9.8 8.9 4.2 3.3 0.7 3.1 3.7 6.4 22.9
1.1 0.5 11.9 14.0 10.2 10.2 8.8 3.6 3.0 0.5 2.6 3.7 6.3 23.7
0.9 0.4 11.0 13.4 11.4 10.9 8.9 3.6 2.7 0.6 2.5 2.4 6.2 24.9
0.9 0.5 11.6 13.6 12.1 9.2 9.6 3.2 2.8 0.6 2.7 2.3 6.5 24.3
Mean 1.1 (0.1) 0.5 (0.1) 11.6 (0.3) 13.5 (0.3) 10.8 (0.8) 9.9 (0.6) 9.0 (0.3) 3.9 (0.6) 3.1 (0.3) 0.6 (0.1) 2.8 (0.2) 3.2 (0.6) 6.3 (0.1) 23.7 (0.9) Note: Standard deviations are displayed in brackets.
Table 2.AA and bulk tissueδ15N values for plant protein and dentine collagen, where TL is the trophic level calculated by Eq. 1, using the previously published values ofβ= +8.4‰and TEF = +7.6‰, andΔ15NConsumer–Diet=δ15NConsumer–δ15NDiet.
δ15
NAA(‰) δ15NBulk TL
Sample Phe Glx Pro Hyp Ala Asx Val Leu Ile Thr Lys Ser Gly (‰)
Plants 11.5 6.8 6.8 n.d. 5.3 7.5 6.8 2.9 5.4 6.1 3.8 1.9 -0.1 4.4 1.5
13.0 8.9 8.7 n.d. 6.9 8.8 7.5 3.6 5.4 5.1 4.9 0.2 -0.4 n.d. 1.6
10.8 4.7 5.5 n.d. 4.2 6.1 5.5 1.0 2.4 2.8 2.8 -2.5 -2.6 3.1 1.3
8.4 4.9 4.7 n.d. 4.0 6.2 5.6 1.1 3.5 3.3 2.6 -1.5 -3.1 3.1 1.6
13.8 9.6 11.1 n.d. 8.8 11.1 10.0 6.7 10.0 7.2 6.4 2.7 2.8 7.8 1.6
10.1 6.2 5.8 n.d. 5.0 7.2 6.1 2.6 4.8 4.6 3.1 -0.4 -1.5 4.1 1.6
10.5 6.9 6.6 n.d. 5.8 7.6 6.9 3.1 5.6 4.7 4.3 0.0 -0.6 5.0 1.6
11.4 5.4 7.0 n.d. 4.5 7.2 5.7 2.8 n.d. 2.7 2.0 -0.9 -2.2 n.d. 1.3
Mean 11.2 (1.6) 6.7 (1.7) 7.0 (1.9) n.d. 5.6 (1.5) 7.7 (1.5) 6.8 (1.4) 3.0 (1.7) 5.3 (2.2) 4.6 (1.5) 3.7 (1.3) -0.1 (1.6) -1.0 (1.8) 4.6 (1.8)
1.5
Dentine 12.2 11.6 10.8 10.6 8.4 10.1 9.4 9.6 9.6 -1.8 3.8 6.6 8.9 9.3 2.0
collagen 13.0 11.9 10.6 11.0 9.1 10.7 10.8 11.3 11.0 -1.6 4.7 7.3 9.2 9.3 2.0
12.8 12.4 10.7 11.0 9.0 11.3 11.6 10.8 10.7 -1.0 3.6 7.7 9.7 9.6 2.1
12.4 11.9 10.0 10.4 9.2 10.6 12.4 11.4 10.9 -4.8 3.3 7.3 8.3 10.0 2.0
12.7 12.3 11.0 11.2 10.2 10.9 9.9 9.5 8.6 -2.6 4.0 6.7 10.6 9.5 2.1
Mean 12.6 (0.3) 12.0 (0.3) 10.6 (0.3) 10.8 (0.3) 9.2 (0.6) 10.7 (0.4) 10.8 (1.1) 10.5 (0.8) 10.2 (0.9) -2.4 (1.3) 3.9 (0.5) 7.1 (0.4) 9.3 (1.6) 9.5 (0.3)
2.0
Δ15N
Consumer-Diet 1.4 5.4 3.6 n.d. 3.6 3.0 4.1 7.5 4.9 -6.9 0.2 7.2 10.3 4.9
between the individual plants at different locations across the control pasture fields. The variation in bulk and individual AA δ15N values of the dentine is much smaller, i.e. ca. 0.6‰ for each AA, because animal tissue does not immediately incorporate the isotopic composition of the diet, but integrates the iso-tope compositions of many plants consumed over the period of tissue formation. Due to this averaging, therefore, the variation between collagen bulk and AA δ15N values of the individual cattle is expected
to be smaller than for a smaller number of plants col-lected across the fields.
The bulk Δ15Nconsumer-diet value, of 4.9‰, is in
agreement with the range of 3-5‰expected for a one trophic level shift, which by itself does not allow insight into the underlying metabolic processes that cause this change in value.
Considering the plant protein AAs in turn, Glx, Pro, Ala and Asx all have similar δ15N values, ranging between 5.6 ± 1.5‰ for Ala and 7.7 ± 1.5‰ for Asx, Figure 4.(a) Meanδ15N values of each AA for plant protein (open circles) and cattle dentine collagen (closed circles). Error bars represent ± 1 standard deviation of multiple samples. (b) Differences between cattle and diet δ15N values for each AA, where Δ15N
Consumer-Diet=δ15NConsumer–δ15NDiet.
In the dentine they also show similar trophic enrich-ments between plant proteins and collagen, of between 5.4 ± 1.7‰ for Glx and 3.0 ± 1.6‰ for Asx. Glx and Asx are of central importance in nitrogen cycling in plants and animals through transamination reactions. Ala is formed by a transamination reaction of gluta-mate or aspartate with pyruvate, leading to slightly lowerδ15N values in Ala relative to Glx and Asx. Pro is formed by the cyclisation of Glu, and as this cyclisa-tion involves the formacyclisa-tion of a C-N bond, Pro is expected to be 15N depleted relative to Glx. This is indeed the case in collagen, where Pro and Hyp consti-tute 22% of amino acids so a high net production of Pro is required, and Pro is depleted by 1.4‰relative to Glx. However, there is less demand for Pro in plant protein; its contribution to leaf protein AAs is less than that of Glu and Gln, leading to little fractionation as there is likely to be reversibility in this transaminase reaction. Hyp is formed by a post-translational modification of Pro in collagen, by prolyl hydroxylase. No C-N bonds are involved in this reaction, so there is no frac-tionation, therefore Hyp and Pro have essentially the same δ15N values within all dentine samples, with a mean difference of 0.2 ± 0.5‰.
The branched-chain AAs (BCAAs) Val, Leu and Ile are biosynthesised in plants from their corresponding α-keto acids using two different branched-chain AA aminotransferase enzymes. Valine-pyruvate amino-transferase catalyses the biosynthesis of both Val and Ile, with the amino group coming from Ala, while the amino group of Leu comes from Glx catalysed by leu-cine aminotransferase. As the δ15N values of Val and Ile are similar, at 6.7 ± 1.4‰and 5.3 ± 2.2‰ respect-ively, while Leu is lower at 3.0 ± 1.7‰, suggesting that these enzymes discriminate against15N to differ-ent degrees.
In mammals, the BCAAs are all essential AAs, and therefore the same pattern in δ15N values may be expected as in the dietary plants. Although the rumen microbes are able to biosynthesise all 22 AAs (the 20 standard AAs plus selenocysteine and pyrroly-sine), the C skeleton of Leu and Ile are difficult to bio-synthesise de novo (Atasoglu and Guliye 2004), and are likely to be preferentially obtained from the diet, as confirmed by Lee et al. (2014) who showed com-parable intake to duodenal flow of both Leu and Ile in cattle on high forage diets, so there is unlikely to be any fractionation between diet and rumen microbes. However, the δ15N values of all three BCAAs are essentially the same in collagen, at ca. 10‰. The reason for this is not clear, however, the first step in BCAA catabolism is reversible deamina-tion to their α-keto acids and Glu, which may allow some equilibration of their δ15N values, before the irreversible catabolic step.
Phe and Lys are both source group AAs in this sys-tem, i.e. there is little nitrogen fractionation between the diet and the consumer tissue (1.4 ± 1.6‰and 0.2 ± 1.4‰ respectively). Phe and Lys are also difficult for rumen bacteria to biosynthesisede novo(Atasoglu and Guliye2004), and so these AAs are routed to the cattle via the rumen microbes with little or no fraction-ation. The first major step in Phe metabolism in mam-mals is hydroxylation to Tyr (Bender 1975). As this does not involve breaking or forming a C-N bond, there is no fractionation involved. In contrast, the first step in Lys metabolism is a condensation reaction with α–ketoglutarate, involving the ε–amino group. However, Lys is an essential AA, and is a limiting AA in cattle (Merchen and Titgemeyer1992), and there-fore dietary Lys is routed directly to tissue protein with no fractionation.
1
2
3
4
5
6
−2 0
NW1 NW5
15N
Glx−Phe / ‰
−2 0 2
NW6
−2 0 2
1
2
3
4
5
6
Sampling position
2
The depletion in theδ15N value of Thr in the cattle collagen relative to plant protein is consistent with pre-vious studies, where negativeδ15N values in collagen threonine have been previously observed in pigs (Hare et al.,1991), and seems to be related to trophic level, as the depletion is greater in marine mammals (Styring et al. 2010), likely due to the larger number of trophic levels in marine ecosystems. The reasons behind this15N-depletion are as yet unclear, although the hypothesis proposed by Hare et al. (1991), that threonine catabolism proceeds with an inverse kinetic isotope effect, has been ruled out (Wallace and Hedges
2016).
The largest Δ15Nconsumer-diet value, of 10.3 ± 1.9‰,
was observed for Gly. While this AA has previously been considered to be source group (McClelland and Montoya 2002, Popp et al.2007, Steffan et al. 2015), this large trophic enrichment clearly indicates that it is a trophic group AA in this system. Similarly, the clo-sely metabolically related Ser, also previously thought of as a source group AA, shows a large trophic enrich-ment of 7.2 ± 1.6‰. This is in agreement with the find-ings of a meta-analysis of AA δ15N trophic fractionation by McMahon and McCarthy (2016), which found that trophic enrichments of Gly and Ser vary depending on the system being studied.
Gly is a major constituent of collagen, comprising approximately one third of collagen AA, so it is likely that much of this results from de novo biosynthesis rather than direct incorporation from the diet. Gly is biosynthesised from Ser, which is in turn formed by amination of phosphohydroxypyruvic acid derived from the glycolysis pathway. The amine group is trans-ferred to Ser from Glu by the enzyme phosphoserine transaminase, leading to Ser being15N depleted relative to Glu. However, as the biosynthesis of Gly from Ser does not involve breaking or forming a C-N bond, it would be expected that Ser and Gly have similar δ15N values. Gly can also be formed by the catabolism
of Thr via 2-amino-3-ketobutyrate. Again, there is no C-N bond breaking or forming, so it may be expected that there should be no change inδ15N value. However, it has been shown that Thr incorporated into body tis-sue is15N depleted in consumers relative to their diet, and therefore any Thr being converted to Gly would be
15N enriched. As previously mentioned, Gly and Ser
are source group amino acids in aquatic ecosystems. This suggests that in marine systems the diet supplies adequate Gly and Ser, so that extensivede novo biosyn-thesis is not required, and therefore there is little15N fractionation between diet and consumer.
As described herein, and shown inFigure 4, there is a wide variation inδ15N values between the individual AAs in both plants and cattle, as well as a large vari-ation in individual trophic enrichments, which are not apparent by the use of a single bulk tissue δ15N value. Nitrogen metabolism in plants and animals
involves a combination of AA biosynthesis and catabo-lism, protein metabocatabo-lism, ingestion, digestion, and nitrogen excretion processes. Theδ15N values of tissues are controlled by the exact combination of these pro-cesses, and investigation at the compound specific level reveals information that is obscured through use of bulk values, such as the unexpected depletion in Thrδ15N values with increased trophic level.
Using the trophic level equation (Eq. 1) with the previously published values ofβ= +8.4‰and TEF = +7.6‰, the mean trophic positions of the plants and cattle in this study were calculated as 1.5 and 2.0, respectively. These values therefore overestimate the trophic position of the primary producers, although correctly predict the tropic position of the cattle. In this study, the difference between Glx and Phe δ15N values in the primary producers (i.e. β) is +4.5‰, while the enrichment in theδ15N values of Glx relative to Phe with increasing trophic level (i.e. TEF) is +4.0‰.
TheΔ15Nconsumer-dietvalue of Glx, of 5.4 ± 1.7‰for
this terrestrial higher plant-ruminant food web, is markedly lower than previously reported values of 8‰for aquatic and invertebrate terrestrial food webs (Chikaraishi et al.2009, Steffan et al.2013). The under-lying reason why a lower Δ15Nconsumer-diet value has
been observed here lies in the fact that ruminants are able to hydrolyse and recycle urea N as ammonia or amino N, by transfer to the rumen via saliva and from the blood (Huntington1986). As urea is depleted in15N in consumers relative to diet (Steele and Daniel
1978), this recycling will decrease the trophic enrich-ment of AAs into which this N is incorporated, com-pared to organisms which cannot recycle nitrogen. This also explains why the TEF is lower in this study than previously reported studies in non-ruminant food webs. Critically, this finding emphasises that TEF values are not transferable between food webs, especially where organisms possess contrasting metabolisms.
Conclusions
This investigation used plant and animal tissues from a controlled agricultural experiment to provide baseline information relating to the expression of natural abun-dance stable nitrogen isotope values in a vertebrate ter-restrial food web. The increase in bulk tissue δ15N values with trophic level was within the range of that seen in other studies. This investigation is the first to consider the effect of trophic level on δ15N values of AAs of a ruminant species and its well-defined diet. The study has resulted in a number of important observations:
(i) Trophic enrichment factor values based on AAs are not transferrable between all food webs and ecosystems as had been previously hypothesised. For archaeological and ecological applications,
the TEF values for the food web must be known for accurate trophic position estimations. (ii) Phenylalanine and lysine have been shown to be
source group AAs in this system, i.e. their δ15N values change little with increased trophic level. (iii) Theδ15N values of the other AAs were found to
change with increased trophic level, including glycine and serine. This is in contrast to studies in aquatic ecosystems in which glycine and serine are source group AAs.
(iv) These differences from other analysed food webs are likely due to the different digestive physiology of ruminants, namely their symbiotic relationship with rumen microbes and their ability to recycle N from urea via saliva.
There is therefore a need to extend these investigations to include other ecologically and archaeologically important terrestrial vertebrate animals raised on well controlled diets or feeding experiments, in order to apply these sorts of trophic position studies to other food webs.
Acknowledgements
The North Wyke Farm Platform is a UK National Capability supported by the Biotechnology and Biological Sciences Research Council (BBSRC BB/J004308/1). This work was carried out in accordance with the welfare standards
approved by Rothamsted Research, North Wyke’s Animal
Welfare Ethical Review Board. We thank the late Robert Orr for assistance with sample collection, the Natural Environment Research Council (NERC) for partial funding of the mass spectrometry facilities at Bristol (R8/H10/63), and Helen Grant of the NERC Life Sciences Mass Spec-trometry Facility (Lancaster node) for stable isotopic charac-terisation of reference standards. IPK was funded by the ERC Advanced Grant NeoMilk (FP7-IDEAS-ERC/324202, to RPE).
Author contribution statement
IPK and RPE conceived and designed the experiment, IPK performed the experiments and analysed the data, IPK and RPE wrote the manuscript, MRFL commented on the manuscript and provided access to the biological samples.
Notes on contributors
Iain P. Kendallis a Postdoctoral Research Associate at the University of Bristol, UK. He recently completed a PhD involving the application of analytical chemistry and stable isotope analysis techniques to answer archaeological ques-tions regarding environment and subsistence patterns.
Michael R.F. Leeis a Professor of Sustainable Livestock Sys-tems at the University of Bristol, UK, and Rothamsted Research, UK. His research interests involve maximising livestock production efficiency through the most suitable feeding systems and animal genetics at a global scale.
Richard P. Evershedis a Professor of Biogeochemistry at the University of Bristol, UK. His research interests involve applying the principles, techniques, and rigor of organic and analytical chemistry to tackle questions in the fields of archaeological chemistry, biogeochemistry and biomolecular palaeontology.
References
Atasoglu, C. and A. Y. Guliye2004.“Use of stable isotopes to
measure de novo synthesis and turnover of amino acid-C and -N in mixed micro-organisms from the sheep rumen
in vitro.”British Journal of Nutrition91 (2): 253-261.
Bender, D. A.1975.Amino Acid Metabolism. London, John
Wiley & Sons.
Bogaard, A., T. H. E. Heaton, P. Poulton and I. Merbach 2007.“The impact of manuring on nitrogen isotope ratios in cereals: archaeological implications for reconstruction
of diet and crop management practices.” Journal of
Archaeological Science34 (3): 335–343.
Brown, W. A. B., P. V. Christofferson, M. Massler and M. B.
Weiss 1960. “Postnatal tooth development in cattle.”
American Journal of Veterinary Research21: 7–34.
Caut, S., E. Angulo and F. Courchamp2009.“Variation in
discrimination factors (Δ15N and Δ13C): the effect of
diet isotopic values and applications for diet
reconstruc-tion.”Journal of Applied Ecology46 (2): 443–453.
Chikaraishi, Y., Y. Kashiyama, N. O. Ogawa, H. Kitazato and
N. Ohkouchi2007.“Metabolic control of nitrogen isotope
composition of amino acids in macroalgae and
gastro-pods: implications for aquatic food web studies.”Marine
Ecology Progress Series342: 85–90.
Chikaraishi, Y., N. O. Ogawa, H. Doi and N. Ohkouchi2011.
“15
N/14N ratios of amino acids as a tool for studying
ter-restrial food webs: a case study of terter-restrial insects (bees,
wasps, and hornets).”Ecological Research26 (4): 835–844.
Chikaraishi, Y., N. O. Ogawa, Y. Kashiyama, Y. Takano, H. Suga, A. Tomitani, H. Miyashita, H. Kitazato and N.
Ohkouchi 2009. “Determination of aquatic food-web
structure based on compound-specific nitrogen isotopic
composition of amino acids.” Limnology and
Oceanography: Methods7 (11): 740–750.
Chikaraishi, Y., N. O. Ogawa and N. Ohkouchi2010. Further
evaluation of the trophic level estimation based on
nitro-gen isotopic composition of amino acids.Earth, Life and
Isotopes. N. Ohkouchi, I. Tayasu and K. Koba. Kyoto,
Kyoto University Press: 37–51.
Chikaraishi, Y., S. A. Steffan, Y. Takano and N. Ohkouchi 2015. “Diet quality influences isotopic discrimination
among amino acids in an aquatic vertebrate.” Ecology
and Evolution5 (10): 2048–2059.
Corr, L. T., R. Berstan and R. P. Evershed 2007.
“Optimisation of derivatisation procedures for the
deter-mination ofδ13C values of amino acids by gas
chromato-graphy/combustion/isotope ratio mass spectrometry.”
Rapid Communications in Mass Spectrometry 21 (23):
3759–3771.
DeNiro, M. J. and S. Epstein1981.“Influence of diet on the
distribution of nitrogen isotopes in animals.”Geochimica
et Cosmochimica Acta45 (3): 341–351.
Eastoe, J. E.1955.“The amino acid composition of
mamma-lian collagen and gelatin.” Biochemical Journal 61 (4):
589–600.
trophic position calculations.” Marine Ecology Progress Series482: 265–277.
Hare, P. E., M. L. Fogel, T. W. Stafford, A. D. Mitchell and T.
C. Hoering 1991. “The isotopic composition of carbon
and nitrogen in individual amino acids isolated from
modern and fossil proteins.” Journal of Archaeological
Science18 (3): 277–292.
Heaton, T. H. E.1987.“The15N/14N ratios of plants in South
Africa and Namibia: relationship to climate and coastal/
saline environments.”Oecologia74 (2): 236–246.
Hobson, K. A., R. T. Alisauskas and R. G. Clark 1993.
“Stable-Nitrogen Isotope Enrichment in Avian Tissues
Due to Fasting and Nutritional Stress: Implications for
Isotopic Analyses of Diet.”The Condor95 (2): 388–394.
Hoen, D. K., S. L. Kim, N. E. Hussey, N. J. Wallsgrove, J. C.
Drazen and B. N. Popp 2014. “Amino acid15N trophic
enrichment factors of four large carnivorous fishes.”
Journal of Experimental Marine Biology and Ecology
453: 76–83.
Huntington, G. B.1986.“Uptake and transport of
nonpro-tein nitrogen by the ruminant gut.” Federation
Proceedings45 (8): 2272–2276.
Lee, M. R. F., V. J. Theobald, N. Gordon, M. Leyland, J. K. S.
Tweed, R. Fychan and N. D. Scollan2014.“The effect of
high polyphenol oxidase grass silage on metabolism of polyunsaturated fatty acids and nitrogen across the
rumen of beef steers.”Journal of Animal Science92 (11):
5076–5087.
McClelland, J. W. and J. P. Montoya2002.“Trophic
relation-ships and the nitrogen isotopic composition of amino
acids in plankton.”Ecology83 (8): 2173–2180.
McCutchan, J. H., W. M. Lewis, C. Kendall and C. C.
McGrath2003.“Variation in trophic shift for stable
iso-tope ratios of carbon, nitrogen, and sulfur.” Oikos 102
(2): 378–390.
McMahon, K. W. and M. D. McCarthy2016.“Embracing
variability in amino acidδ15N fractionation: mechanisms,
implications, and applications for trophic ecology.”
Ecosphere7 (12): e01511–n/a.
McMahon, K. W., M. J. Polito, S. Abel, M. D. McCarthy and
S. R. Thorrold2015.“Carbon and nitrogen isotope
frac-tionation of amino acids in an avian marine predator,
the gentoo penguin (Pygoscelis papua).” Ecology and
Evolution5 (6): 1278–1290.
Merchen, N. R. and E. C. Titgemeyer1992.“Manipulation of
amino acid supply to the growing ruminant.”Journal of
Animal Science70 (10): 3238–3247.
Minagawa, M. and E. Wada1984.“Stepwise enrichment of
15
N along food chains: Further evidence and the relation
between δ15N and animal age.” Geochimica et
Cosmochimica Acta48 (5): 1135–1140.
Nakashita, R., Y. Suzuki, F. Akamatsu, Y. I. Naito, M.
Sato-Hashimoto and T. Tsubota 2011. “Ecological
appli-cation of compound-specific stable nitrogen isotope analysis of amino acids: A case study of captive and
wild bears.” Researches in Organic Geochemistry 27:
73–79.
Nielsen, J. M., B. N. Popp and M. Winder2015.“Meta-analysis
of amino acid stable nitrogen isotope ratios for estimating
trophic position in marine organisms.”Oecologia: 1–12.
O’Connell, T. C.2017.“‘Trophic’and‘source’amino acids in
trophic estimation: a likely metabolic explanation.”
Oecologia184 (2): 317–326.
Ohkouchi, N., Y. Chikaraishi, H. G. Close, B. Fry, T. Larsen, D. J. Madigan, M. D. McCarthy, K. W. McMahon, T. Nagata, Y. I. Naito, N. O. Ogawa, B. N. Popp, S. Steffan, Y. Takano, I. Tayasu, A. S. J. Wyatt, Y. T. Yamaguchi
and Y. Yokoyama2017.“Advances in the application of
amino acid nitrogen isotopic analysis in ecological and
biogeochemical studies.”Organic Geochemistry.
Ørskov, E. R.1982.Protein nutrition in ruminants. London,
Academic Press.
Pakhomov, E. A., J. W. McClelland, K. Bernard, S. Kaehler
and J. P. Montoya2004. “Spatial and temporal shifts in
stable isotope values of the bottom-dwelling shrimp
Nauticaris marionis at the sub-Antarctic archipelago.”
Marine Biology144 (2): 317–325.
Popp, B. N., B. S. Graham, R. J. Olson, C. C. S. Hannides, M. J. Lott, G. A. López-Ibarra, F. Galván-Magaña and B. Fry 2007. Insight into the Trophic Ecology of Yellowfin Tuna,
Thunnus albacares, from Compound-Specific Nitrogen
Isotope Analysis of Proteinaceous Amino Acids. Stable
Isotopes as Indicators of Ecological Change. E. D. Todd and T. W. S. Rolf. Cambridge, MA, USA, Academic
Press. 1: 173–190.
Post, D. M.2002.“Using stable isotopes to estimate trophic
position: models, methods, and assumptions.”Ecology83
(3): 703–718.
Romek, K. M., M. Julien, M. Frasquet-Darrieux, I. Tea, I.
Antheaume, R. Hankard and R. J. Robins2013.“Human
baby hair amino acid natural abundance 15N-isotope
values are not related to the15N-isotope values of amino
acids in mother’s breast milk protein.”Amino Acids45
(6): 1365–1372.
Satter, L. D. and R. E. Roffler1975.“Nitrogen Requirement
and Utilization in Dairy Cattle.”Journal of Dairy Science
58 (8): 1219–1237.
Schoeninger, M. J. and M. J. DeNiro1984.“Nitrogen and
carbon isotopic composition of bone collagen from
mar-ine and terrestrial animals.” Geochimica et
Cosmochimica Acta48 (4): 625–639.
Spence, K. O. and J. A. Rosenheim2005.“Isotopic
enrich-ment in herbivorous insects: a comparative field-based
study of variation.”Oecologia146 (1): 89–97.
Steele, K. W. and R. M. Daniel 1978. “Fractionation of
nitrogen isotopes by animals: a further complication to
the use of variations in the natural abundance of 15N
for tracer studies.” Journal of Agricultural Science 90
(1): 7–9.
Steffan, S. A., Y. Chikaraishi, C. R. Currie, H. Horn, H. R. Gaines-Day, J. N. Pauli, J. E. Zalapa and N. Ohkouchi 2015. “Microbes are trophic analogs of animals.”
Proceedings of the National Academy of Sciences 112
(49): 15119–15124.
Steffan, S. A., Y. Chikaraishi, D. R. Horton, N. Ohkouchi, M.
E. Singleton, E. Miliczky, D. B. Hogg and V. P. Jones2013.
“Trophic Hierarchies Illuminated via Amino Acid
Isotopic Analysis.”PLOS ONE8 (9).
Styring, A. K., R. A. Fraser, A. Bogaard and R. P. Evershed 2014. “The effect of manuring on cereal and pulse
amino acidδ15N values.”Phytochemistry102: 40–45.
Styring, A. K., A. Kuhl, T. D. I. Knowles, R. A. Fraser, A.
Bogaard and R. P. Evershed 2012. “Practical
consider-ations in the determination of compound-specific amino
acidδ15N values in animal and plant tissues by gas
chrom-atography-combustion-isotope ratio mass spectrometry,
following derivatisation to theirN-acetyl isopropyl esters.”
Rapid Communications in Mass Spectrometry 26 (19):
2328–2334.
Styring, A. K., J. C. Sealy and R. P. Evershed2010.“Resolving
the bulk δ15N values of ancient human and animal
bone collagen via compound-specific nitrogen isotope
analysis of constituent amino acids.” Geochimica et
Cosmochimica Acta74 (1): 241–251.
Vanderklift, M. A. and S. Ponsard2003.“Sources of variation
in consumer-diet δ15N enrichment: a meta-analysis.”
Oecologia136 (2): 169–182.
Wallace, C. J. A. and R. E. M. Hedges2016.“Nitrogen
isoto-pic discrimination in dietary amino acids: The threonine
anomaly.”Rapid Communications in Mass Spectrometry
30 (22): 2442–2446.
Yeoh, H.-H. and L. Watson1982.“Taxonomic variation in
total leaf protein amino acid compositions of grasses.”