R u g g i e r o , L u c a , D e w h u r s t , S u s a n a n d B a m p o u r a s , T h e o d o r o s ( 2 0 1 6 ) Validi ty a n d r e li a bility of t w o fi el d-b a s e d le g s tiff n e s s d e vi c e s: i m plic a tio n s fo r p r a c ti c al u s e . Jo u r n a l of Ap pli e d Bio m e c h a n i c s, 3 2 ( 4). p p . 4 1 5-4 1 9 .
Do w n l o a d e d fr o m : h t t p ://i n si g h t . c u m b r i a . a c . u k /i d/ e p ri n t/ 2 0 6 3 /
U s a g e o f a n y i t e m s f r o m t h e U n i v e r s i t y o f C u m b r i a’ s i n s t i t u t i o n a l r e p o s i t o r y ‘I n s i g h t ’ m u s t c o n f o r m t o t h e f o l l o w i n g f a i r u s a g e g u i d e l i n e s .
Any it e m a n d it s a s s o ci a t e d m e t a d a t a h el d i n t h e U niv e r si ty of C u m b r i a ’s in s ti t u ti o n al r e p o si t o r y I n si g h t ( u nl e s s s t a t e d o t h e r wi s e o n t h e m e t a d a t a r e c o r d ) m a y b e c o pi e d , di s pl ay e d o r p e rf o r m e d , a n d s t o r e d i n li n e wi t h t h e JIS C f ai r d e a li n g g ui d eli n e s ( av ail a bl e h e r e) fo r e d u c a t i o n al a n d n o t-fo r-p r ofi t a c tiviti e s
p r o v i d e d t h a t
• t h e a u t h o r s , ti tl e a n d full bi blio g r a p h i c d e t ail s of t h e it e m a r e ci t e d cl e a rly w h e n a n y p a r t
of t h e w o r k is r ef e r r e d t o v e r b a lly o r i n t h e w ri t t e n fo r m
• a h y p e rli n k/ U RL t o t h e o ri gi n al I n si g h t r e c o r d of t h a t it e m is i n cl u d e d i n a n y ci t a ti o n s of t h e w o r k
• t h e c o n t e n t is n o t c h a n g e d i n a n y w a y
• all fil e s r e q ui r e d fo r u s a g e of t h e it e m a r e k e p t t o g e t h e r wi t h t h e m a i n it e m fil e.
Yo u m a y n o t
• s ell a n y p a r t of a n it e m
• r e f e r t o a n y p a r t of a n it e m wi t h o u t ci t a ti o n
• a m e n d a n y it e m o r c o n t e x t u ali s e it i n a w a y t h a t will i m p u g n t h e c r e a t o r ’s r e p u t a t i o n
• r e m ov e o r a l t e r t h e c o py ri g h t s t a t e m e n t o n a n it e m .
T h e full p oli cy c a n b e fo u n d h e r e.
The manuscript below is the post-refereeing version which has been accepted for publication in the 1
Journal of Applied Biomechanics (http://journals.humankinetics.com/jab) 2
October 31, 2015
3
4
Validity and reliability of two field-based leg stiffness devices: implications for
5
practical use
6
7
Luca Ruggiero,
1,2Susan Dewhurst,
1Theodoros M. Bampouras
18
9
1
Department of Medical and Sport Sciences, University of Cumbria, Lancaster,
10
LA1 3JD, United Kingdom;
2School of Health and Exercise Sciences, University of
11
British Columbia, Kelowna, British Columbia, Canada.
12
13
Funding: No external funding were received.
14
Conflict of Interest Disclosure: The authors have no conflict of interest to disclose.
15
Correspondence Address: Theodoros M. Bampouras, University of Cumbria, Department of
16
Medical and Sport Sciences, Human Performance Laboratory, Bowerham Road, Lancaster LA1 17
3JD, United Kingdom. Email: [email protected]. Tel. No.: +44 1524 590837.
18
Running Head: Field-based leg stiffness measurement.
Abstract
20
Leg stiffness is an important performance determinant in several sporting activities. This study 21
evaluated the criterion-related validity and reliability of two field-based leg stiffness devices, 22
Optojump Next® and Myotest Pro® in different testing approaches. Thirty-four males 23
performed, on two separate sessions, three trials of 7 maximal hops, synchronously recorded 24
from a force platform (FP), Optojump and Myotest. Validity (Pearson’s correlation coefficient, r; 25
relative mean bias; 95% limits of agreement, 95%LoA) and reliability (coefficient of variation, 26
CV; intraclass correlation coefficient, ICC; standard error of measurement, SEM) were calculated 27
for first attempt, maximal attempt, and average across three trials. For all three methods, 28
Optojump correlated highly to the FP (range r = 0.98-0.99) with small bias (range 0.91-0.92, 29
95%LoA 0.86-0.98). Myotest demonstrated high correlation to FP (range r = 0.81-0.86) with 30
larger bias (range 1.92-1.93, 95%LoA 1.63-2.23). Optojump yielded a low CV (range 5.9%-31
6.8%), high ICC (range 0.82-0.86) and SEM ranging 1.8-2.1 kN/m. Myotest had a larger CV 32
(range 8.9%-13.0%), moderate ICC (range 0.64-0.79) and SEM ranging from 6.3-8.9 kN/m. The 33
findings present important information for these devices and support the use of a time efficient 34
single trial to assess leg stiffness in the field. 35
36
Keywords: hopping test, vertical stiffness, test-retest, sensitivity. 37
38
Word Count: 2043
Introduction
40
Leg stiffness describes the response of the lower limbs to generate force and resist 41
deformation during rebound activities.8,9 Enhanced stiffness is beneficial to reduce metabolic cost 42
of bouncing gait (i.e. running, hopping)12-14 as well as to attaining high sprinting speed15-16, 43
whereas lower leg stiffness may lead to less storage and recoil of elastic energy, placing greater 44
metabolic demand during push-off, and to a reduced ability to sustain impact loads, raising injury 45
risk.9,11,17 46
Two field-based devices that can assess leg stiffness are the Optojump Next® (Microgate, 47
Bolzano, Italy) and Myotest Pro® (Myotest, Sion, Switzerland).21-22 Optojump is an optical 48
measurement system consisting of two infrared photocell bars that can derive contact and flight 49
times from the breaking of the transmitted beam, whereas Myotest is a wireless lightweight 50
portable triaxial accelerometer that can be fixed on the athlete. Both are portable and practical, 51
allowing athletes to jump on any given surface, used largely because of their versatility and 52
reasonable cost.23-25 53
The aim of the present study was twofold. Criterion-related validity, reliability and 54
sensitivity of Optojump and Myotest for measuring leg stiffness in hopping were assessed. These 55
aspects were then examined with three different procedures: the first trial executed, the average 56
across three trials, and the maximal stiffness value, to explore whether a single trial is sufficient. 57
Methods
58
Participants
Thirty-four males (age 21.8 ± 3.9 years, height 1.83 ± 0.07 m, mass 79.0 ± 11.4 kg) took 60
part in the study. They were physically active and free from lower limbs injuries for at least six 61
months prior. Participants were instructed to refrain from strenuous exercise, alcohol, and 62
caffeine for 2 days, 24 and 2 hours before testing, respectively. Procedures were approved by the 63
University Ethical Committee and informed consent was given by all participants. 64
Procedures
65
Participants visited the laboratory twice, 1 week apart, at the same time of the day. 66
Following a standardised warm up, participants were familiarised with the test. Following a 5-67
minute rest, 3 trials of the 7MH were performed, with 2 minutes resting between trials. 68
Participants were instructed to jump as high as possible, with minimal contact time, and with 69
arms akimbo at all times 70
All jumps were performed on a force platform (FP) (AccuPower, AMTI, Watertown, MA, 71
United States; 200 Hz sampling rate). Average contact and flight times from all jumps, and 72
participants’ body mass, obtained from the resulting vertical force-time trace, were used to 73
calculate leg stiffness.18 74
Leg stiffness = Mass × π ( flight time + contact time ) contact time2× �� flight time + contact time
π � − � contact time 4 ��
( Eq. 1)
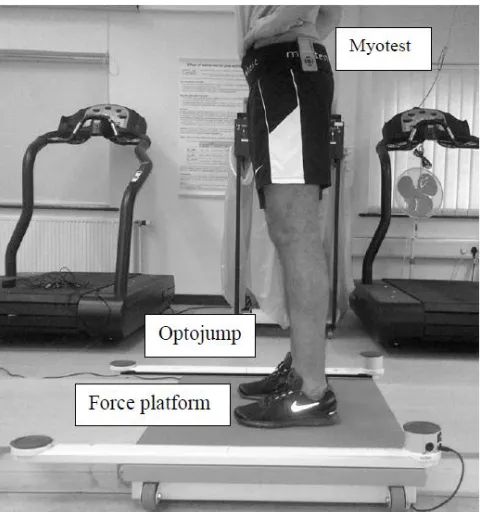
Data were synchronously collected by Optojump and Myotest (Figure 1). Optojump 1- 75
meter bars (resolution of 96 diodes, 1 kHz sampling rate) were placed on the lateral edges of the 76
FP. Average contact and flight times from all jumps and the participant’s body mass was used in 77
with an elastic Velcro waistband, fastened around both great trochanters and the medium part of 79
the gluteal region, as per manufacturer instructions. Myotest calculates leg stiffness taking into 80
account the average of the best three hops from any given trial. Leg stiffness values were 81
displayed on the device screen immediately after the trial. 82
Data Analysis
83
Leg stiffness was examined for all three devices from a) the 1st trial from each session 84
(KFirst), b) the average across three trials from each session (KAvg), and c) the maximal value from 85
each session (KMax). 86
For the KMax approach, Wilcoxon signed-rank test was used to check for conformity of the 87
trial number wherein the maximum stiffness value occurred between each device and FP, 88
revealing no significant difference for any comparison. For the KAvg approach, within-subject 89
variation over the three trials was assessed via 1-way repeated measures ANOVA before 90
averaging, reporting no significant differences. Therefore, stiffness results for each subject were 91
collapsed to a single value per session. 92
Criterion-related validity assessment procedures
93
As no significant test-retest differences (examined with paired t-test) between the 1st and 94
2nd sessions were reported for any of the devices, results were collapsed to a single participant 95
value for each of the KFirst , KMax , and KAvg procedures,28 which were then used for criterion-96
related validity of the Optojump and Myotest in comparison to the FP. Data was checked for 97
heteroscedasticity by correlating the test score differences between either Optojump or Myotest 98
and the FP to their mean value, for each procedure.29 As significant correlations were found, raw 99
data was transformed using the natural logarithm before further analysis occurred.29 Normality of 100
for each device and procedure using the Shapiro-Wilk test, with normality defined as the ratio of 102
skewness and kurtosis to the respective standard error not exceeding ±2.0.30 Criterion-related 103
validity of each device to the FP was assessed via Pearson’s correlation coefficient and relative 104
mean bias. Additionally, 95% limits of agreement (95%LoA) were reported.29 Pearson’s
105
correlation coefficient (r) was interpreted as indicating high correlation for an r value above 0.8.31 106
Relative mean bias was calculated as the difference between the logarithmic transformed score 107
means of either Optojump or Myotest and FP, and reported as antilog, meaning it was interpreted 108
as the ratio between the average outcome of the examined device and that of the FP. Likewise, 109
95%LoA were calculated on the logarithmic scale, and reported as antilogs as mean difference ± 110
1.96 standard deviations of the differences. 111
Reliability assessment procedures
112
The residuals (raw 1st – 2nd session score differences) and the respective pair means for 113
each piece of equipment and procedures were correlated allowing homoscedastic distribution to 114
be confirmed. Thus, data was further analyzed as raw values. Normality of the residuals was then 115
confirmed for each procedure and device. 116
Indices of both absolute and relative reliability were used for the investigation, for each 117
procedure. Absolute intersession reliability was assessed via coefficient of variation and standard 118
error of measurement (CV and SEM, respectively). The CV threshold was set at 10%, with 119
values below suggesting high consistency.33,34 SEM was calculated as the square root of the 120
mean square error term in a repeated measures ANOVA.30 SEM is of practical importance,
121
allowing coaches to determine the minimum difference (MD; Eq. 2) needed for a performance 122
change to be considered real (95% confidence) rather than a measurement error30,35 123
124
Finally, relative intersession reliability was assessed by interclass correlation coefficient 125
(ICC), calculated as36: 126
127
ICC = 1 − �mean of subjects′ standard deviation between trials SEM 2 2� (Eq. 3)
128
The threshold was set at 0.8, with values above indicating small measurement error.37 129
95% confidence intervals for ICCs were also calculated.38 130
Statistical significance level was set at P < 0.05. All statistical tests were performed using 131
SPSS software (IBM SPSS Statistics, version 20, Inc., Chicago, IL, USA). 132
Results
133
Leg stiffness calculated from Optojump demonstrated high correlation to FP (Table 1) in 134
all analysis procedures (range r = 0.98-0.99, P < .001) with bias ranging from 0.91 to 0.92 (Table 135
2). 95%LoA (Table 2, Figure 2) were not substantially different between procedures. Leg 136
stiffness calculated from Myotest (Table 1) also showed high correlation to leg stiffness 137
calculated from FP in all methods (range r = 0.81 – 0.86, P < .001). However, bias ranged 138
between 1.92 and 1.93 (Table 2), resulting in increased 95%LoA (Figure 2). 139
FP exhibited low CV, suggesting good absolute reliability (Table 3). However, when 140
relative reliability was considered, only KMax procedure reported an ICC ≥ 0.8, with KFirst and 141
KAvg ICCs of 0.74 and 0.79, respectively. Optojump revealed high absolute and relative reliability 142
in all three analysis procedures, shown from relatively low values of group mean CV and high 143
ICC (Table 3). For Myotest, the KAvg procedure was the more consistent with a low CV but 144
For all procedures, Myotest yielded higher SEM than the FP and Optojump (Table 3). 146
Discussion
147
The aim of this study was to determine criterion-related validity and reliability of two 148
commonly used field-based devices (i.e. Optojump and Myotest) in measuring leg stiffness. In 149
addition, three different analysis procedures were examined (i.e. KFirst, KMax and KAvg), to provide 150
practical information in terms of timing requirements to assess leg stiffness. Optojump showed a 151
valid leg stiffness measurement compared to FP, with all analysis procedures being reliable. 152
Myotest also showed valid leg stiffness measurement compared to FP, but with moderate 153
reliability for all three procedures. 154
Leg stiffness values measured with Optojump agreed well with the FP values and are 155
within the range reported from previous literature.10,18-20 When the three different procedures 156
were considered, all showed high reliability, with similar indexes to earlier research using the 157
FP.39,40 The systematic bias of Optojump was most likely due to the placement of Optojump bars 158
on the FP (Figure 1), meaning the infrared beams were 0.3 cm higher than the FP surface,26 159
resulting in increased contact time and reduced flight time compared to those of FP, in turn lower 160
leg stiffness.4,18 Although this height discrepancy may appear as a methodological concern, this 161
approach was adopted as in field testing, the beams will inherently be raised on a given surface 162
(e.g. ground, court, track). 163
Leg stiffness values obtained from Myotest were significantly greater than the FP and 164
outside the values seen from hopping in previous reports. 10,18-20 Further, reliability for all three 165
procedures was moderate. Our results contradict the study by Choukou et al.22 who reported the 5 166
hop test as valid and reliable in measuring leg stiffness using Myotest . The higher number of 167
could have reduced within-subject variability36. The overestimation of leg stiffness and poorer 169
reliability of Myotest in relation to the FP might be attributed firstly to the Myotest leg stiffness 170
computation being based on integration of acceleration, with respect to mass and time, and 171
establishes the time interval of integration when the accelerations are null.22 As maximal 172
descending and ascending velocities are not achieved at those exact points, contact time and 173
centre of mass displacement are underestimated, while flight time, force and jump height are 174
overestimated22,24; in turn, magnifying leg stiffness values. Secondly, the fast transition between 175
braking and push-off phase during the maximal hopping task is likely to have caused vibrations 176
of the device and in turn erroneous acceleration detections. 177
High sensitivity of a device allows for better determining differences resulting from true 178
changes of the physical characteristic evaluated rather than from a measurement error.35,42 For 179
this purpose, we calculated SEM, to determine MD and construct confidence intervals, which can 180
detect, with 95% confidence, real changes in the variable being measured. The importance of 181
this is illustrated in the following example. Let us assume that an athlete achieves a stiffness 182
score of 25 kN/m at pre-intervention assessment, and a value of 33kN/m at post-intervention 183
assessment. Replacing the respective SEM from the KFirst procedure (Table 3) in Eq. 2, the MD 184
will be 5.8 kN/m for Optojump and 21.1 kN/m for Myotest. As the test-retest difference (8 kN/m) 185
lies outside the MD for Optojump, we would be confident of a true increase post-intervention, 186
whereas we would be unable to reach a conclusion using Myotest. 187
Assessing many athletes within the time-restrictions of a training or an assessment 188
session, requires use of scientifically rigorous methods and consideration of the the practical 189
aspects of the assessment (e.g. time availability, set-up and feedback time). Our results showed 190
leg stiffness can be confidently assessed with the use of a single trial, allowing time-efficient 192
testing, in particular short time frames are available or large populations are to be tested. 193
References
194
1. Blickhan R. The spring-mass model for running and hopping. J Biomech. 1989;22(11– 195
12):1217-1227. http://dx.doi.org/10.1016/0021-9290(89)90224-8 196
2. McMahon TA, Cheng GC. The mechanics of running: how does stiffness couple with
197
speed? J Biomech. 1990;23(Suppl. 1):65-78.
http://dx.doi.org/10.1016/0021-198
9290(90)90042-2 199
3. Farley CT, Gonzales O. Leg stiffness and stride frequency in human running. J Biomech. 200
1996;29:181-186. http://dx.doi.org/10.1016/0021-9290(95)00029-1 201
4. Farley CT, Morgenroth DC. Leg stiffness primarily depends on ankle stiffness during
202
human hopping. J Biomech. 1999;32(3):267-273.
http://dx.doi.org/10.1016/S0021-203
9290(98)00170-5 204
5. Hobara H, Muraoka T, Omuro K, et al. Knee stiffness is a major determinant of leg
205
stiffness during maximal hopping. J Biomech. 2009;42(11):1768-1771.
206
http://dx.doi.org/10.1016/j.jbiomech.2009.04.047 207
6. Kuitunen S, Ogiso K, Komi PV. Leg and joint stiffness in human hopping. Scand J Med
208
Sci Sports. 2011;21(6):e159-e167. doi: 10.1111/j.1600-0838.2010.01202.x 209
7. Farley C, Houdijk H, Van Strien C, Louie M. Mechanism of leg stiffness adjustment for 210
hopping on surfaces of different stiffnesses. J Appl Physiol. 1998;85(3):1044-1055. 211
8. Bobbert MF, Casius LJR. Spring-like leg behaviour, musculoskeletal mechanics and
212
control in maximum and submaximum height human hopping. Philos Trans R Soc Lond B
213
9. Oliver JL, Croix MBADS, Lloyd RS, Williams CA. Altered neuromuscular control of leg 215
stiffness following soccer-specific exercise. Eur J Appl Physiol. 2014;114(11):2241-2249. 216
doi: 10.1007/s00421-014-2949-z 217
10.Hobara H, Kanosue K, Suzuki S. Changes in muscle activity with increase in leg stiffness 218
during hopping. Neurosci Lett. 2007;418(1):55-59.
219
http://dx.doi.org/10.1016/j.neulet.2007.02.064
220
11.Kuitunen S, Kyröläinen H, Avela J, Komi PV. Leg stiffness modulation during exhaustive 221
stretch-shortening cycle exercise. Scand J Med Sci Sports. 2007;17(1):67-75. doi:
222
10.1111/j.1600-0838.2005.00506.x.
223
12.Oliver JL, Smith PM. Neural control of leg stiffness during hopping in boys and men. J 224
Electromyogr Kinesiol. 2010;20(5):973-979.
225
http://dx.doi.org/10.1016/j.jelekin.2010.03.011
226
13.Dalleau G, Belli A, Bourdin M et al. The spring-mass model and the energy cost of
227
treadmill running. Eur J Appl Physiol. 1998, 77:257-263. doi: 10.1007/s004210050330.
228
14.Barnes KR, Hopkins WG, McGuigan MR, Kilding AE. Warm-up with a weighted vest
229
improves running performance via leg stiffness and running economy. J Sci Med Sport. 230
2015;18(1):103-108. http://dx.doi.org/10.1016/j.jsams.2013.12.005. 231
15.Chelly SM, Denis C. Leg power and hopping stiffness: relationship with sprint running 232
performance. Med Sci Sports Exerc. 2001;33(2):326-33. doi:
10.1097/00005768-233
200102000-00024.
234
16.Bret C, Rahmani A, Dufour AB, et al. Leg strength and stiffness as ability factors in 100 235
m sprint running. J Sports Med Phys Fitness. 2002;42(3):274-81. 236
17.Rabita G, Couturier A, Dorel S, et al. Changes in spring-mass behavior and muscle
237
activity during an exhaustive run at O2max. J Biomech. 2013;46(12):2011-2017.
http://dx.doi.org/10.1016/j.jbiomech.2013.06.011
239
18.Dalleau G, Belli A, Viale F, et al. A simple method for field measurements of leg stiffness 240
in hopping. Int J Sports Med. 2004;25:170-176. doi: 10.1055/s-2003-45252.
241
19.Lloyd RS, Oliver JL, Hughes MG, Williams CA. Reliability and validity of field-based 242
measures of leg stiffness and reactive strength index in youths. J Sports Sci.
243
2009;27(14):1565-1573. doi: 10.1080/02640410903311572.
244
20.Lloyd RS, Oliver JL, Hughes MG, Williams, CA. The effect of 4-weeks of plyometric
245
training on reactive strength index and leg stiffness in male youths. J Strength Cond Res. 246
2012;26(10):2812-2819. doi:10.1519/JSC.0b013e318242d2ec. 247
21.Maquirriain J. The interaction between the tennis court and the player: how does surface 248
affect leg stiffness?. Sports Biomech. 2013;12(1):48-53.
249
doi:10.1080/14763141.2012.725088.
250
22.Choukou MA, Laffaye G, Taiar R. Reliability and validity of an accelerometric system 251
for assessing vertical jumping performance. Biol Sport. 2014;31(1):55-62.
252
doi:10.5604/20831862.1086733. 253
23.Girard O, Lattier G, Micallef JP, Millet GP. Changes in exercise characteristics, maximal 254
voluntary contraction, and explosive strength during prolonged tennis playing. Br J Sports 255
Med. 2006;40(6):521-526. doi:10.1136/bjsm.2005.023754. 256
24.Casartelli N, Müller R, Maffiuletti NA. Validity and reliability of the Myotest
257
accelerometric system for the assessment of vertical jump height. J Strength Cond Res. 258
2010;24(11):3186-93. doi: 10.1519/JSC.0b013e3181d8595c.
259
25.Castagna C, Ganzetti M, Ditroilo M, et al. Concurrent validity of vertical jump
260
performance assessment systems. J Strength Cond Res. 2013;27(3):761-768. doi:
261
10.1519/JSC.0b013e31825dbcc5.
26.Glatthorn JF, Gouge S, Nussbaumer S, et al. Validity and reliability of Optojump Next 263
photoelectric cells for estimating vertical jump height. J Strength Cond Res.
264
2011;27(3):761-8. doi: 10.1519/JSC.0b013e3181ccb18d. 265
27.Bampouras TM, Relph NS, Orme D, Esformes JI. Validity and reliability of the Myotest 266
Pro wireless accelerometer in squat jumps. Isokinet Exerc Sci. 2013;21:101-105. doi:
267
10.3233/IES-130484. 268
28.Thompson CJ, Bemben MG. Reliability and comparability of the accelerometer as a
269
measure of muscular power. Med Sci Sports Exerc. 1999;31(6):897-902.
270
doi: 10.1097/00005768-199906000-00020.
271
29.Bland JM, Altman DG. Statistical methods for assessing agreement between two methods 272
of clinical measurement. Lancet. 1986;1:307-310.
http://dx.doi.org/10.1016/S0140-273
6736(86)90837-8.
274
30.Vincent WJ, Weir JP. Statistics in kinesiology. 4th ed. Champaign, IL: Human Kinetics; 275
2012. 276
31.Cohen J. Statistical power analysis for the behavioural sciences. 2nd ed. Mahwah, NJ: 277
Lawrence Erlbaum; 1988. 278
32.Sale DG. Testing strength and power. In: MacDougall JD, Wenger HA, Green HJ, eds.
279
Physiological testing of the high performance athlete. 2nd ed. Champaign, IL: Human 280
Kinetics; 1991: 21-106. 281
33.Atkinson G, Nevill AM. Statistical method for assessing measurement error (reliability) 282
in variables relevant to sports medicine. Sports Med. 1998;26(4):217-238. doi:
283
10.2165/00007256-199826040-00002.
34.O’Leary TJ, Morris MG, Collett J, Howells K. Reliability of single and paired-pulse 285
transcranial magnetic stimulation in the vastus lateralis muscle. [published online ahead 286
of print January 23, 2015]. Muscle Nerve. doi: 10.1002/mus.24584.
287
35.Hopkins WG. How to interpret changes in an athletic performance test. Sportscience. 288
2004;8:1-7. 289
36.Hopkins WG. Measures of reliability in sports medicine and science. Sports Med.
290
2000;30(1):1-15. doi: 10.2165/00007256-200030010-00001.
291
37.Nunnally J, Bernstein I. Psychometric Theory. 3rd ed. New York, NY: McGraw Hill; 292
1993. 293
38.Hopkins WG. Calculating the reliability intraclass correlation coefficient and its
294
confidence limits (Excel spreadsheet). 2009.
295
http://www.sportsci.org/resource/stats/xICC.xls 296
39.Joseph CW, Bradshaw EJ, Kemp J, Clark RA. The interday reliability of ankle, knee, leg, 297
and vertical musculoskeletal stiffness during hopping and overground running. J Appl 298
Biomech. 2013;29:386-394.
299
40.McLachlan KA, Murphy AJ, Watsford ML, Rees S. The interday reliability of leg and
300
ankle musculotendinous atiffness measures. J Appl Biomech. 2006;22:296-304. 301
41.Komi PV, Nicol C. Stretch-shortening cycle of muscle function. In: Komi PV, ed.
302
Neuromuscular aspects of sport performance. Oxford, UK: Blackwell Science Ltd;
303
2011:15-31. 304
42.Weir JP. Quantifying test-retest reliability using the intraclass correlation coefficient and 305
Tables
307
Table1. Leg stiffness (mean ± SD) for Session 1 and Session 2.
308
Leg Stiffness (kN/m)
Session 1 Session 2
KFirst FP 26.3± 5.1 26.6± 5.6
Optojump 24.2± 4.4 24.2 ± 5.1
Myotest 53.0± 15.2 50.7± 14.0
KAvg FP 26.0± 5.2 26.2± 5.0
Optojump 24.1 ± 4.6 23.9 ± 4.4
Myotest 52.0 ± 14.3 50.2 ± 12.4
KMax FP 27.6± 5.6 27.6± 5.9
Optojump 25.1± 4.7 24.8± 5.4
Myotest 55.0± 15.1 51.8± 13.6
Note. First attempt procedure (KFirst); maximal value procedure (KMax); session average value 309
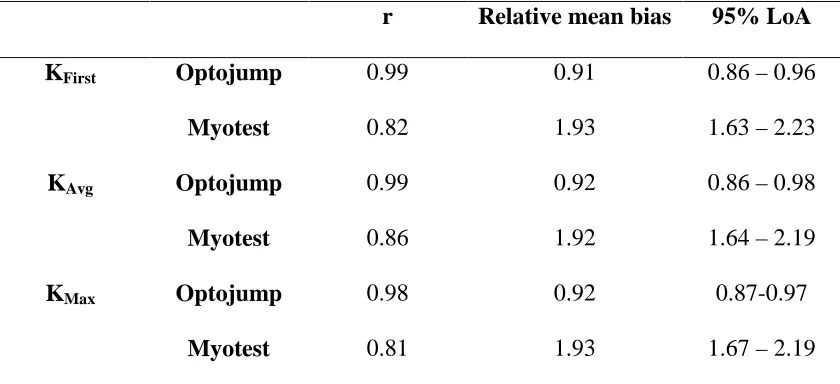
Table 2. Criterion-related validity statistics, compared to FP. 311
r Relative mean bias 95% LoA
KFirst Optojump 0.99 0.91 0.86 – 0.96
Myotest 0.82 1.93 1.63 – 2.23
KAvg Optojump 0.99 0.92 0.86 – 0.98
Myotest 0.86 1.92 1.64 – 2.19
KMax Optojump 0.98 0.92 0.87-0.97
Myotest 0.81 1.93 1.67 – 2.19
Note. First attempt procedure (KFirst); maximal value procedure (KMax); session average value 312
procedure (KAvg); force platform (FP); Pearson’s product moment correlation coefficient (r); 313
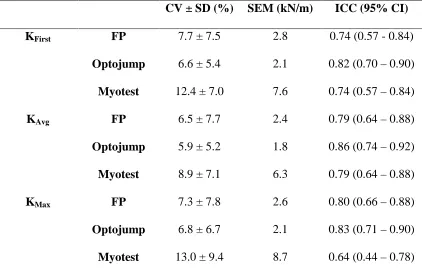
Table 3. Test-retest reliability statistics for every device 315
CV ± SD (%) SEM (kN/m) ICC (95% CI)
KFirst FP 7.7 ± 7.5 2.8 0.74 (0.57 - 0.84)
Optojump 6.6 ± 5.4 2.1 0.82 (0.70 – 0.90)
Myotest 12.4 ± 7.0 7.6 0.74 (0.57 – 0.84)
KAvg FP 6.5 ± 7.7 2.4 0.79 (0.64 – 0.88)
Optojump 5.9 ± 5.2 1.8 0.86 (0.74 – 0.92)
Myotest 8.9 ± 7.1 6.3 0.79 (0.64 – 0.88)
KMax FP 7.3 ± 7.8 2.6 0.80 (0.66 – 0.88)
Optojump 6.8 ± 6.7 2.1 0.83 (0.71 – 0.90)
Myotest 13.0 ± 9.4 8.7 0.64 (0.44 – 0.78)
Note. First attempt procedure (KFirst); maximal value procedure (KMax); session average value 316
procedure (KAvg); force platform (FP); intraclass correlation coefficient (ICC); confidence 317
intervals (CI); coefficient of variation (CV); standard deviation (SD); standard error of 318
measurement (SEM). 319
Figure and Captions
321
322
323
324
325
326
327
328
Figure 1. Experimental setup of the devices for synchronous data collection. Note that,
custom-329
331
Figure 2. Limits of agreement. Ratio of leg stiffness measurements outcome between either
332
Myotest (left side) or Optojump (right side) and Force platform (FP), plotted against their 333
average. The continuous line represents the mean relative bias between the examined device and 334
the FP. Dashed lines represents lower and upper limits with 95 % confidence. A) The 1st trial per 335
session was considered (KFirst). B) The average across the three trials per session was retained 336