Rothamsted Research is a Company Limited by Guarantee Registered Office: as above. Registered in England No. 2393175. Registered Charity No. 802038. VAT No. 197 4201 51. Founded in 1843 by John Bennet Lawes.
Rothamsted Repository Download
A - Papers appearing in refereed journals
Becker, F., MacLaren, C., Brink, C., Jabobs,K., le Roux, M. R. and
Swanepoel, P. A. 2019. High nitrogen rates do not increase canola yield
and may affect soil bacterial functioning. Agronomy Journal.
The publisher's version can be accessed at:
• https://dx.doi.org/10.2134/agronj2019.05.0359
• https://dl.sciencesocieties.org/publications/aj/first-look/pdf/agronj2019.05.0359.pdf
The output can be accessed at:
https://repository.rothamsted.ac.uk/item/96x07/high-nitrogen-rates-do-not-increase-canola-yield-and-may-affect-soil-bacterial-functioning.
© 3 October 2019, ASA
1 High nitrogen rates do not increase canola yield and may affect soil bacterial functioning
2 F Becker1, C MacLaren1, 2, CJ Brink3, K Jacobs3, MR le Roux1, PA Swanepoel1*
3 1Department of Agronomy; Stellenbosch University
4 2Sustainable Agricultural Sciences, Rothamsted Research
5 3Department of Microbiology, Stellenbosch University
6 *Corresponding Author: [email protected]; +27218084668
7 ORCID IDs
8 CM: 0000-0002-6700-3754; KJ: 0000-0003-3972-5343;CB: 0003-2607-6831; MR:
0000-9 0002-6473-237X PS: 0000-0002-6481-0673
10
11 Author contributions: PS and MR designed the study. FB undertook fieldwork, and FB and CB
12 completed the laboratory tests. CM analysed the data, and FB, CM and PS wrote the article with
13 contributions from CB and KJ. All authors provided critical revisions to the final version.
14
15 Core ideas
16 ● Over-fertilization of N is common in canola in South Africa
17 ● We evaluated N fertilization rates and application timings for canola
18 ● Canola growth and yield were generally not affected by N rates or timing
19 ● A low N rate favoured soil bacterial communities more likely to mineralize N
20 ● A low N rate (60 to 90 kg ha-1) split into two or three applications can sustain yield and
21 have minimal effects on soil bacterial functioning
22
23 Abbreviations: ARISA = Automated Ribosomal Intergenic Spacer Analysis; CLPP = Community
24 level physiological profiling: carbon source utilization; DAE = days after emergence; LAI = leaf
26 Abstract
27 Nitrogen fertilization has a fundamental role in agricultural productivity. However, injudicious N
28 applications to crops are common. It is important to ensure the minimum N required for
29 satisfactory crop growth is applied but that excess amounts are avoided due to potential impacts
30 on agroecosystem functioning. Nitrogen at 0, 60, and 150 kg ha-1 was applied as limestone
31 ammonium nitrate to plots arranged in a randomized complete block design, on three farms to
32 determine the impact of rate and temporal distribution of fertilizer on canola (Brassica napus L.)
33 production in South Africa, and the effect of N fertilizer application on the composition and
34 diversity of soil bacterial communities. The amount and distribution of N had only minor effects
35 on canola growth (P < 0.05) and no effects on yield or harvest index. Splitting fertilizer into two
36 or three applications throughout the season resulted in more mineral N available in the soil later
37 in the season. Increasing the N rate from 60 to 150 kg ha-1 had a significant impact on bacterial
38 community composition. The lower rate favored bacteria that are more able to break down
N-39 containing carbon sources. No effects of fertilizer amount or distribution were observed on either
40 N fixation potential (number of nifH gene copies) or bacterial community diversity. Overall, a
41 low rate of N fertilizer split into multiple applications is recommended for canola production, as
42 higher rates do not increase yield and may have a detrimental impact on soil carbon and nitrogen
44 Introduction
45 The need for sustainable agricultural production systems is well recognized, with substantial
46 increases in the human population posing huge challenges for future agricultural production within
47 Earth’s environmental limits (Tilman et al., 2002; Rockström et al., 2017). Environmental
48 degradation associated with agriculture is exacerbated by external inputs, in particular with
49 injudicious inorganic fertilizer applications. Inorganic N fertilizer application is a primary
50 approach to intensify crop production and ensure food security (Liu et al., 2011), but it also has a
51 large C footprint and causes eutrophication and algal blooms when it leaches from agricultural
52 land to waterways (Seitzinger and Phillips, 2017). In addition, fuel and energy use during the
53 manufacturing and transport processes of fertilizers may also contribute substantially to
54 environmental erosion (Shibata et al., 2017). Although N fertilization has a fundamental role in
55 agricultural productivity, it is important to ensure the minimum N required for satisfactory crop
56 growth is applied.
57 Canola (Brassica napus) was introduced into crop rotation systems of South Africa in 1994
58 to increase crop diversity (BFAP 2018). Canola production in South Africa is growing, and
59 according to predictions made by the Bureau for Food and Agricultural Policy (BFAP 2018), will
60 increase to ca. 200,000 tons by 2027. Canola has a higher N demand than most other cash crops
61 (Ma and Herath, 2015), but dependence on inorganic N fertilizers to increase canola production is
62 not sustainable and, therefore, attention should be shifted to retaining and fixing N on-farm through
63 optimising soil biological activity. Moreover, due to the lack of robust guidelines tailored for the
64 South African climate and soil conditions, N fertilization is often applied injudiciously, which may
65 have negative impacts on the finely balanced interactions in the soil environment. There is a need
66 to understand how much inorganic N is necessary to produce satisfactory canola yields in the
68 The relationship between soil microbial diversity, ecosystem functioning, associated
69 services, and management practices (e.g. N fertilization) is under increasing scrutiny to elucidate
70 the complexities that underpin the productivity of agroecosystems (Brussaard et al., 2007;
71 Hartmann et al., 2015; Hartman et al., 2018). Increased biodiversity in the microbial community
72 may enhance the functional capacity of the soil ecosystem (Bender et al., 2016). Thus, the use of
73 agricultural management practices that can maintain soil functional diversity is advocated in order
74 to build inherent resilience to environmental shocks. The same motive has driven the
75 implementation of crop rotation systems in the Western Cape (Venter et al., 2017).
76 It is widely acknowledged that N fertilizer may affect soil biodiversity and on-farm
77 ecological functioning, potentially decimating the ecosystem services provided by the soil
78 microbial community (Bisset et al. 2011; Gordon et al., 2016; Hartmann et al., 2015; Jackson et
79 al., 2017). For example, the soil N and C cycles are mediated by soil bacteria, which are involved
80 in the build-up and decomposition of soil organic matter (Jackson et al., 2017), and in the
81 conversion of N between its organic and inorganic forms (Kuypers et al., 2018). It has been shown
82 that microbial communities can be sensitive to fertilizers, particularly at the rates applied in current
83 agroecosystems (Gordon et al., 2016; Hartmann et al., 2015). This suggests that N fertilizer
84 applications may interfere with the capacity of the microbial community (including beneficial
85 bacteria) to cycle N and C in ways that are beneficial to both crop growth and C sequestration.
86 Thus, optimising N fertilizer applications should have benefits for both protecting the off-farm
87 environment and sustaining the capacity of farm soils to produce crops.
88 Our understanding of the effect of N fertilization of canola on soil bacterial communities
89 is currently limited. The overall aim of this study was to evaluate different N fertilization rates and
90 N distribution for canola production in South Africa, but it specifically seeks to determine the
91 effect of fertilizer N application on the composition and diversity of soil bacterial communities.
93 community, and canola growth and yield were assessed. The effects of both the quantity of N
94 fertilizer and whether it was all applied at once or distributed throughout the season (at planting
95 and as a top-dressing) were investigated.
96
97 Materials and methods
98 Trial location
99 Trials were conducted in 2016 at three farms in the winter rainfall area within South Africa’s
100 Western Cape province: Langgewens Research Farm (33°16'36.6"S, 18°42'11.4"E), Roodebloem
101 Experimental Farm (34°13'29.5"S 19°31'47.3"E) and Altona, a commercial farm (33°42'15.6"S,
102 18°38'12.3"E). Langgewens and Altona are located in the Swartland region, and typically receive
103 440 mm and 690 mm of rain per year with 85-90 % of rainfall falling in the colder winter months
104 (April-September). Roodebloem is located in the southern Cape region and receives 585 mm of
105 rain per year, of which 80 % falls in the winter months. In 2016, annual rainfall and temperature
106 patterns were similar to long-term averages, with the exception that May was unusually dry
107 (records were obtained from weather stations either on or nearby each farm). Soils on Roodebloem
108 Experimental Farm are generally shallow (<400 mm deep), shale-derived soils of a sandy loam
109 texture. The parent material of soils in the Altona and Langgewens districts are mainly derived
110 from greywacke and phyllite with limited pedological development, therefore shallow (<400 mm
111 deep). The soil chemical and physical characteristics of each site is presented in Table 1.
112
113 Experimental design
114 The trials followed a crossed full factorial design, with treatments receiving either 60 kg ha-1 or
115 150 kg ha-1 of N, of which 20 kg ha-1 was applied at planting and the remainder distributed in
116 either one, two or three applications later in the season (at 30, 60 and 90 days after emergence;
118 trial included seven treatments in total (Table 2). These were laid out in a randomized complete
119 block design, with four replicates at each of the three farms. Plots were 2.75 x 5 m. Half of each
120 plot was intended for destructive measurements (sampling of plants), while the other half was used
121 for yield determination. Measures of canola plant production and soil bacterial community
122 composition and function were taken in each plot at various time points throughout the season
123 (Table 3). The methods for each of these are detailed in the following sections.
124
125 Trial management
126 Weeds were eradicated prior to planting with paraquat. A fine seedbed was created using a 21 tine
127 vibro flex to a depth of 150 mm, during which the pre-emergence herbicide Trifluralin
[2,6-128 Dinitro-N,N-dipropyl-4-(trifluoromethyl)aniline] was applied so that it could be incorporated into
129 the soil. The insecticide chlorpyrifos (O, O-diethyl O-3, 5, 6-trichloropyridin-2-yl
130 phosphorothioate) was applied just before planting. Phosphorous, in the form of double
131 superphosphate, was applied at a rate of 20 kg ha-1 on the day of planting, according to
132 recommendations from soil tests done prior to establishment of the trial. No potassium was
133 required according to soil test results (Table 1). Nitrogen was applied in the form of limestone
134 ammonium nitrate (LAN) as specified in Table 3.
135 Canola was sown using a Wintersteiger disc plot planter with 170 mm row spacing. The
136 triazine tolerant canola cultivar, Hyola 555 TT was planted at 4 kg ha-1 on 9 May 2016 at
137 Langgewens, 5 May 2016 at Altona, and 4 May 2016 at Roodebloem. The preceding crops on
138 Langgewens, Altona and Roodebloem were wheat (Triticum aestivum), annual medics (Medicago
139 spp.), and oats (Avena sativa), respectively. Methiocarb [(3,5-dimethyl-4-methylsulfanylphenyl)
140 N-methylcarbamate] was applied just after planting to control snails, slugs and millipedes. At 30
142 were applied to control grass weeds and insects, respectively. Methiocarb was also applied at 30
143 DAE.
144
145 Soil nitrogen content analysis
146 Soil cores (ø 45 mm) were taken to a depth of 150 mm. Three sub-samples were taken from each
147 plot and combined to form a single composite sample per plot, then air-dried at room temperature,
148 and sieved with a 1 mm sieve. Samples were taken 30, 60, 90 DAE and at when the canola reached
149 physiological maturity (approx. 150 DAE). Soil samples were analysed for ammonium and nitrate
150 content using the indophenol-blue (Keeney et al., 1982) and salicylic acid methods (Cataldo et al.,
151 1975) respectively. Total soil mineral N (kg ha-1) was calculated as ammonium plus nitrate, which
152 is the N readily available to plants. To convert the total mineral N concentration (mg kg-1) to stock
153 (kg ha-1) a bulk density of 1400 kg m-3 was used, which is the average bulk density for the region
154 reported by (de Clercq et al., 2013).
155
156 Soil bacterial community analysis
157 Soil cores (ø 45 mm) were taken to a depth of 150 mm using a stainless steel pipe and a hammer.
158 The pipe was washed and sterlized with 70 % ethanol between sampling of different plots. Samples
159 were collected at canola physiological maturity only.
160
161 Automated Ribosomal Intergenic Spacer Analysis (ARISA)
162 The bacterial community composition within each sample was determined with Automated
163 Ribosomal Intergenic Spacer Analysis (ARISA) (Ranjard et al., 2001). DNA was extracted from
164 0.25 g of soil using the Zymo research soil microbe DNA MicroPrep™ kit (Zymo research USA).
165 Extracted and purified DNA was separated on a 1 % agarose gel stained with ethidium bromide to
167 The polymerase chain reaction (PCR) reactions were performed on the purified DNA using
168 ITSReub (5’-GTCGTAACAAGGTAGCCGTA-3’) and FAM (carboxy-fluorescein) labelled
169 ITSF (5’-GCCAAGGCATCCACC-3’) primer set for the 16S rRNA intergenic spacer region to
170 determine bacterial diversity using ARISA (Cardinale et al. 2004, Slabbert et al., 2010b). PCR
171 reactions were done using a 2720 Thermal Cycler (Applied Biosystems, USA). The reaction
172 mixture contained 0.5 µl purified genomic DNA, 500 nM of each primer, 4.1 µl PCR grade water
173 (nuclease free) and 5 µl KapaTaq readymix (Kapa Biosystems, South Africa) for a total volume
174 of 10 µl. The PCR consisted of an initial denaturing step of 5 minutes at 94oC, followed by 40
175 cycles at 94oC for 45 s, 56oC for 50 s and 72oC for 70 s. The reaction was completed with a final
176 extension at 72oC for 7 minutes and then cooled and held at 4oC. All the samples were done in
177 triplicate and pooled to compensate for PCR bias.
178 The PCR products of the pooled samples were run on an ABI 3010xl Genetic Analyser to
179 obtain an electropherogram of different fragment lengths and fluorescent intensities. Bacterial
180 ARISA samples were run along the LIZ 1200 size standard which is designed for sizing DNA
181 fragments in the 100 – 1200 base pair (bp) range. Fluorescence intensities were converted to
182 electropherograms using the Genemapper 5 software. The peaks on the electropherogram represent
183 different fragments of different sizes, termed operational taxonomic units (OTUs), and the heights
184 of the peaks indicate relative abundance of the fragments. The lengths were calculated by plotting
185 a best fit curve using the size standard and extrapolating the fragment size from the sample. Only
186 fragment sizes between 100 and 1000 base pairs and peak heights above 150 fluorescent units were
187 used for analysis as OTU’s. A bin size of 3 bp was used to minimize inaccuracies of the ARISA
188 profile (Brown et al., 2005; Slabbert et al., 2010b).
189
191 The CLPP was done by determining the carbon source utilization of the soil bacterial community.
192 Soil samples were diluted in distilled nuclease free water and inoculated, in triplicate, into Biolog
193 EcoPlatesTM (Biolog Inc., USA). The plates contain 31 different C sources in different wells and
194 a control well containing no C source. Plates were incubated at 28oC. Utilization of the C sources
195 by microbial populations reduce the tetrazolium dye inside the plate wells that cause a colour
196 change. This colour change was measured twice daily over a period of 5 to 10 days with a
197 spectrophotometer at 590 nm to determine the average well colour development (AWCD).
198
199 Nitrogen fixation capacity: number of nifH gene copies
200 The nifH PCR product from a Burkholderia strain was used for preparation of the standards as
201 well as a positive control. The PCR product was purified using GeneJET PCR Purification Kit
202 (Thermo Scientific). The PCR product size of 380 bp was verified by electrophoresis on a 1 %
203 agarose gel. The purified PCR products were quantified using a μLITE (Biodrop, Cambridge, UK)
204 and the nifH gene copy number was determined using the fragment length, molecular weight and
205 Avogadro’s number. The known concentration of the PCR product was used to prepare a standard
206 curve, in triplicate, to measure nifH gene copy numbers. The nifH gene copy numbers of the soil
207 samples were quantified by using quantitative PCR (qPCR) using the nifH F1 and nifH 438r
208 primers (Boulygina et al., 2002; De Meyer et al., 2011). The qPCR assays were performed using
209 the LightCycler 96 (Roche) with a SYBR Green 1 fluoroprobe as the protocol suggested (Brink et
210 al., 2019).
211 A standard curve was generated for every qPCR run ranging from 1x10^10 to 1x10^0 gene
212 copies μL-1. Each run also included a positive control as well as a negative control. The same soil
213 DNA samples used for ARISA was used for qPCR and was run in duplicate. The reaction volume
214 contained 3 μL nuclease free water, 2 μL nifH F1 (100 nM) and nifH 438r (100 nM) primers, 10
216 specifications. The thermal cycle used for qPCR consisted of 95°C for 5 minutes followed by 40
217 cycles of 94°C for 60 s, 60°C for 60 s and 72°C for 30 s. A melt curve analysis was done after the
218 40 cycles to verify specificity of amplicons. This analysis identified the number of nifH gene
219 copies per 5 μL of DNA, which was converted to the copy number per gram soil based on 100 μL
220 DNA per 0.25 g soil.
221
222 Canola growth and yield determination
223 Plant population was determined by counting seedlings within the border of a half square meter
224 quadrat at 30 DAE and converted to plants m-2. Biomass was determined by cutting 10 plants per
225 plot at ground level at 30, 60, 90 DAE and at physiological maturity. The plants were dried in an
226 oven at 70oC for 48 hours and weighed. Biomass per plant was converted to biomass m-2 by using
227 the particular plot’s plant population. An additional ten plants per plot were sampled to determine
228 leaf area index (LAI). Leaf area index was measured at 60 and 90 DAE using a LI-COR 3100 leaf
229 area meter. The LAI describes the potential surface area of leaves available for capturing light and
230 thus photosynthetic capacity, and so a higher LAI gives a plant the capacity for higher biomass
231 accumulation and yield potential (Viña et al., 2011).
232 Canola seed was harvested at physiological maturity on 7 November 2016 at Langgewens,
233 9 November 2016 at Altona and 4 November 2016 at Roodebloem with a Hege plot harvester. The
234 harvested seed were cleaned by using sieves and weighed to determine the yield per plot (ton ha
-235 1). The harvest index, or proportion of aboveground biomass, was also calculated:
236
237 𝐻𝑎𝑟𝑣𝑒𝑠𝑡 𝑖𝑛𝑑𝑒𝑥 (%)𝐷𝑟𝑦 𝑚𝑎𝑠𝑠 𝑜𝑓 ℎ𝑎𝑟𝑣𝑒𝑠𝑡 𝑐𝑜𝑚𝑝𝑜𝑛𝑒𝑛𝑡
𝑇𝑜𝑡𝑎𝑙 𝑏𝑖𝑜𝑚𝑎𝑠𝑠 𝑎𝑡 ℎ𝑎𝑟𝑣𝑒𝑠𝑡 𝑥 100
238
239 Ten plants per plot were dried, ground and passed through a 1 mm sieve, then analysed for % N
241
242 Data analysis
243 Prior to analyses, OTU heights were normalized to the lowest height total before analysis, by
244 dividing each value within the sample by the total height representing relative abundance of the
245 DNA fragments, and multiplying each value with the lowest height total (so that the number of
246 OTUs is underestimated rather than overestimated) (Slabbert et al 2010b) . The OTU Shannon
247 diversity was calculated according to the following formula:
248 ―
∑
𝑖
𝑝𝑖𝑙𝑛 𝑝𝑖
249
250 where p is the proportion of biomass in species i, and ln is the natural logarithm. The Shannon
251 index is an acceptable diversity measure for OTU data (Hill et al 2003).
252 Linear mixed regression models were used to assess differences in soil mineral N, canola
253 biomass, leaf area index, yield, harvest index, bacterial community diversity, and bacterial N
254 fixation capacity. The amount and distribution of N and their interaction were set as fixed effects,
255 while replicate nested in farm was set as a random effect. Farm was included as a random effect
256 to explore whether there was any independent effect of the N fertilizer treatments when site was
257 accounted for. Site itself was not a factor of interest, as sites were selected for logistical reasons
258 and not due to any particular characteristics nor prior knowledge of typical canola yields or
259 microbial communities.The negative control was included by structuring the model to test for the
260 difference between the control and all treated plots, and to test for differences between treatments
261 nested within all treated plots. A log transformation was used for the response variables of soil
262 mineral N, canola biomass, and LAI so that the data fit the assumptions of linear regression of
263 normality and homoscedastic variance in the model residuals.
264 To assess bacterial community composition, NMDS ordination based on the Bray-Curtis
266 used to test for significant differences in composition between different amounts and distributions
267 of N with farm as a grouping variable, to detect effects of these variables within potentially
268 different bacterial communities on different farms. It is currently not possible with available
269 software to nest grouping variables in PERMANOVA, otherwise replicate could have been used
270 as a grouping variable too. Data analysis was undertaken in R, version 3.4.3 (R Core Team, 2017).
271
272 Results
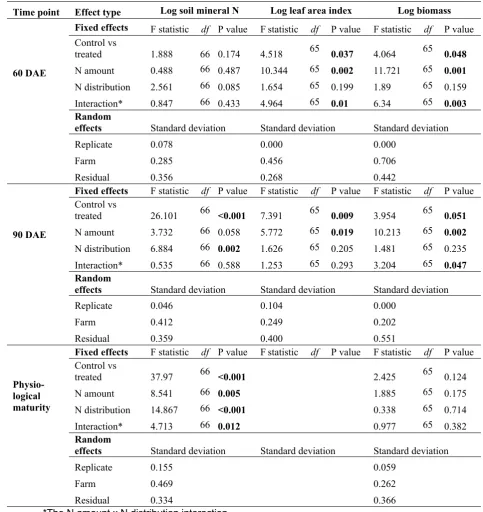
273 Soil mineral nitrogen and canola production
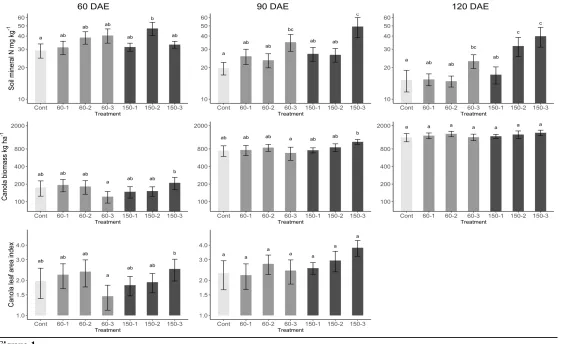
274 As the season progressed, soil mineral N tended to become higher in plots that received greater
275 amounts of N applied in a more even distribution (Table 4, Figure 1). Applying 60 kg ha-1 of N
276 across three applications resulted in more available N later in the season than applying 150 kg ha
-277 1 at 30 DAE in a single dose (Figure 1).
278 Canola biomass and LAI responded slightly to the amount of N applied and its distribution
279 (Table 4), but were generally not different between treatments (Figure 1). When N fertilizer was
280 distributed in three applications compared to one or two applications, biomass and LAI tended to
281 be lower at 60 and 90 DAE for 60 kg ha-1 treatments, but higher in the 150 kg ha-1 treatments at
282 60 and 90 DAE. It is possible that treatment 60(3) did not receive sufficient N for full growth prior
283 to 90 DAE, whereas a more even distribution of fertilizer was advantageous where more N was
284 applied in treatment 150(3). However, these small differences in plant growth did not result in any
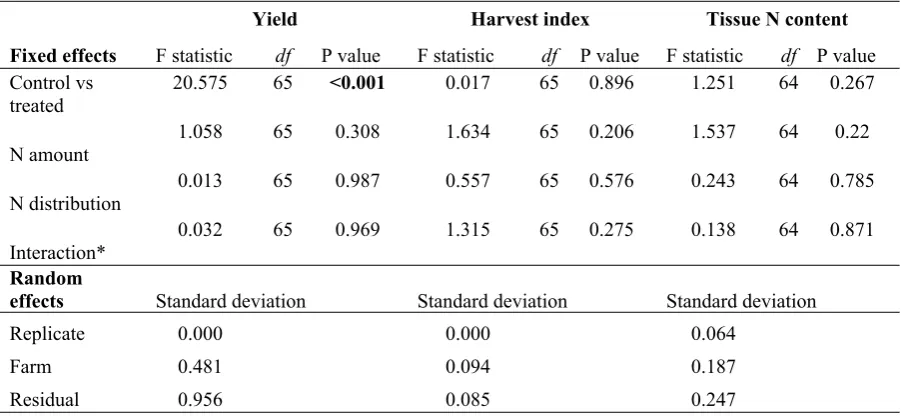
285 significant differences in either canola harvest index or plant tissue N content at physiological
286 maturity between the treatments, and only the control differed (P <0.05) from the other treatments
287 (Table 5, Figure 2). In terms of random effects, variability between replicates tended to be very
288 low, while variability within plots of the same treatment at the same site (the residual error term)
289 was often similar or larger than the variability between farms (Tables 3 and 4), indicating relatively
291 The lack of substantial differences in canola growth and yield indicates that uptake of N
292 by canola does not explain the reduced soil mineral N observed later in the season in treatments
293 where all N fertilizer was applied early (Figure 1). It can therefore be assumed that the N is lost
294 from the system (perhaps to leaching, bacterial immobilisation or weeds) and not incorporated into
295 crop plant matter.
296
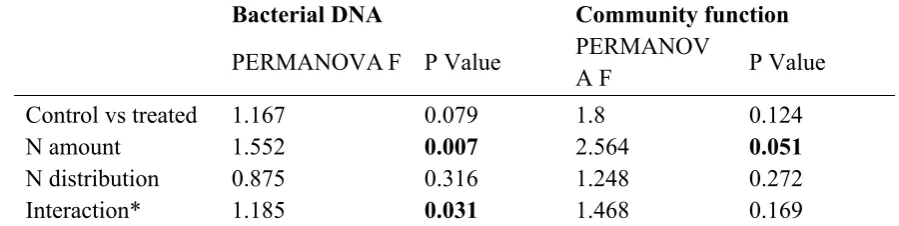
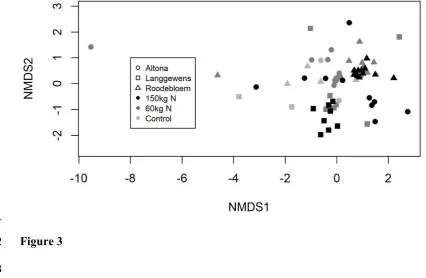
297 Bacterial community composition, diversity and function
298 No significant differences were observed in OTU richness, Shannon diversity or the number of
299 nifH gene copies between treatments, and again variability within treatments and replicates (the
300 residual) was higher than variability between replicates and farms (Table 6). However, the
non-301 metric multidimensional scaling (NMS) ordination (Figure 3) and PERMANOVA of the OTUs
302 found in each plot indicate that N amount does have a significant impact on bacterial community
303 composition (Table 7). In the ordination, plots that received 150 kg ha-1 N are shifted higher along
304 the first axis of the NMS compared to control plots or plots receiving 60 kg ha-1 N at the same
305 farm (Figure 4). This suggests that increasing N levels favours a different group of bacteria to
306 those found under low N levels.
307
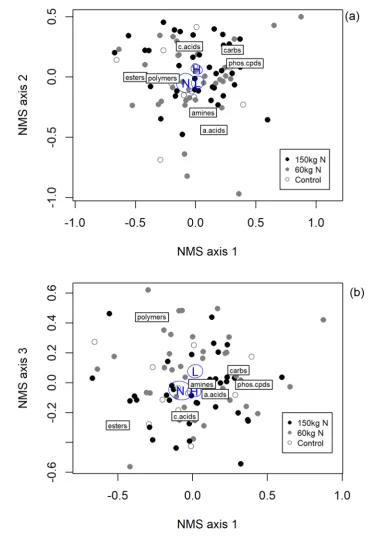
308 The NMS ordination and PERMANOVA for carbon source utilization suggest that the amount of
309 N fertilizer applied may alter microbial function (Table 7, Figure 4). Plots that received more N
310 tend to be shifted higher along axes 1 and 2 of the NMS, which is associated with higher use of
311 carbohydrates, phosphorylated compounds and carboxylic acids and lower use of amino acids,
312 amines, esters and polymers. Amines and amino acids always contain N, while some esters and
313 polymers do, so it is possible that lower mineral N availability favours bacteria that can break
314 down N-containing carbon sources and thus extract N as well as C from those sources, to meet
316 ha-1 with non-N-containing carbon sources, and Figure 4(b) suggests a higher affinity for polymers
317 of control plots and plots receiving 60 kg N ha-1.
318
319 Discussion
320 Optimising fertilization strategy for canola growth
321 This study provided no evidence that increasing N fertilizer from 60 kg ha-1 to 150 kg ha-1 has any
322 benefits for canola production in the winter rainfall region of South Africa’s Western Cape. There
323 were no detectable differences in yield or harvest index, and only minor differences in plant
324 biomass and LAI (Figures 1 and 2). This finding concurs with other recent and ongoing trials in
325 the region, and may be a result of a regional switch to conservation agriculture practices over the
326 last twenty years. Conservation agriculture practices including reduced tillage, maintenance of
327 crop residues, and crop rotation can increase soil organic matter and thus increase rates of N
328 mineralization (Plaza et al., 2013; McDaniel et al., 2014), so it is possible these practices may have
329 reduced canola N requirements over time. Current fertilizer guidelines for canola in the Western
330 Cape were based on conventional tillage systems. These were determined the from target yield
331 potential of canola for specific regions (a result of in-season rainfall), taking soil texture and crop
332 rotation into consideration (Fertasa, 2016). However, preliminary work to re-evaluate fertilizer
333 guidelines for conservation agriculture systems indicates that total seasonal N rates above 50 to 75
334 kg ha-1 would not be recommended due to the risk of leaching and low N use efficiencies of canola
335 (du Toit, 2018).
336 Splitting the fertilizer into two or three applications throughout the season was
337 advantageous compared to applying all fertilizer by 30 DAE, in terms of reducing N loss to the
338 environment. It did not result in yield differences in our study, but other studies have observed a
339 higher canola yield quality (increased oil percentage) when N availability is higher later in the
340 season (du Toit, 2018; Swanepoel et al., 2019). The reduced levels of N observed later in the
342 treatments, indicating that the N has moved elsewhere. Some N may have been immobilized by
343 microbial activity, but leaching is also likely as N in the form of nitrate is readily soluble in water
344 and thus carried away through rainwater infiltration or surface water run-off. This can have
345 detrimental consequences in particular for surrounding aquatic ecosystems, with fertilizer run-off
346 a major contributor to eutrophication and algal blooms in both freshwater and marine environments
347 (Seitzinger and Phillips, 2017). Excess N fertilizer can also cause problems for crop production by
348 promoting weeds. Weeds increase as nutrient availability increases (MacLaren et al., 2019), and
349 so a high dose of N applied early in the season when crops are too small to capture it can be
350 expected to promote the establishment of weeds that will become competitive with crops later in
351 the season as resource availability diminishes.
352
353 Effects of N fertilizer on soil bacterial community composition and function
354 The results of this study suggest that applying more N fertilizer alters the soil-bacteria community
355 composition, which can affect soil carbon and N cycling (Buchkowski et al. 2015). Increased N
356 appeared to shift the community toward a group of bacteria that are less reliant on N-containing
357 carbon sources (amines and amino acids; Figure 4). Fierer et al., (2012) also observed that the
358 bacterial communities become less reliant on organic forms of N as N fertilization increased,
359 suggesting a shift from oligotrophic to copiotrophic communities. Bacteria typically require a 25:1
360 carbon:nitrogen ratio, and so where sufficient mineral N is available to meet this need, bacteria
361 can decompose carbon-rich organic molecules more readily. In contrast, if mineral N availability
362 is low, then bacteria are limited in the amount of organic matter they can decompose by the need
363 to acquire organic N. Such conditions also promote N release through mineralization (Mengel,
364 1996).
365 Abundant N, therefore, could increase the capacity of the bacterial community to
367 to either farmers (loss of soil organic matter) or the environment (carbon emissions) (Hasselquist
368 et al., 2012). It is not yet clear whether N fertilizer universally increases carbon emissions, as other
369 studies have observed that the addition of N in some instances negatively affects soil respiration,
370 leading to an overall increase in carbon sequestration (Janssens et al., 2010). N fertilizer can reduce
371 both microbial biomass as well as activity, particularly in bacteria (Demoling et al., 2008), and
372 mainly in the presence of recalcitrant organic matter, while positive effects are observed when N
373 is added to easily degradable organic material (Fog, 1988). This study measured neither in situ
374 bacterial biomass nor activity and so further research will be necessary to determine if high N rates
375 do release carbon from South African soils.
376 In cases where N fertilizers do reduce carbon emissions by suppressing bacterial activity,
377 then a negative effect on other functions can also be expected. This includes N mineralization, an
378 important pathway by which N is released from soil organic matter and made available to plants.
379 High N levels tend to reduce mineralization in general, whether or not they suppress bacterial
380 activity, as microbes tend to take up more mineral N when it is in high quantities, thus delaying
381 the mineralization of N from organic sources (Fog, 1988; Zhou et al., 2012).
382 Overall, a bacterial community that is more adapted to decomposing N-containing carbon
383 sources in the presence of low mineral N would therefore be expected to release more N through
384 mineralization per unit of carbon respired. This quality could promote sustainability through
385 maximising nitrogen availability to crops via mineralization, while minimising carbon lost from
386 soil to the atmosphere. Our study suggests that such communities can be promoted by restricting
387 the amount of N fertilizer. If the amount of N supplied to crops through mineralization rather than
388 fertilization can be increased, this could also reduce the large carbon footprint associated with
389 synthetic N fertilizers (Lal, 2004).
390 Despite the observed shift in carbon source utilization in this study, there was no effect of
392 bacterial community diversity. This contrasts with other studies, which have shown that N
393 fertilization can reduce the abundance of rhizobia (Ledgard, 2001) and free-living diazotrophs (Orr
394 et al., 2011; Compton et al., 2004). N fertilization has also been observed to overall community
395 diversity (Ramirez et al., 2010, Coolon et al., 2013; Wang et al., 2015) and activity (Kennedy et
396 al., 2004, Demoling et al., 2008). This negative effect of N on microbial activity is mainly found
397 in the presence of recalcitrant organic matter, while a positive effect is observed when N is added
398 to easily degradable organic material (Fog, 1988). That N fertilizer tends to raise soil pH is at least
399 partially responsible for such trends (Kennedy et al., 2004; Lauber et al., 2009; Wang et al., 2015).
400 Such effects were not observed in this study, possibly as a result of the history of the trial sites.
401 Perhaps local diversity and N-fixing bacteria were already depleted after decades of intensive
402 cropping. Bacterial diversity and community composition may also depend on other soil qualities
403 (Williams et al., 2013) and it is not known whether these were limiting at any or all of the sites in
404 the present study. The effect of adding N to a microbial system remains difficult to model and
405 explain (Hasselquist et al., 2012; Janssens et al., 2010), with different studies often producing
406 apparently contradictory results (e.g. Williams et al., 2013; van der Bom et al., 2018). This
407 emphasizes the importance of continuing studies to elucidate the complex relationships between
408 farm management, microbial communities, and carbon and nutrient cycling. However, increased
409 awareness of the effect of inorganic N on microbial biomass and activity will inform better
410 management practices.
411
412 Conclusion
413 This study suggests that applying less N fertilizer more often over a cropping season is optimal for
414 both crop production and environmental protection, and may help to sustain the capacity of the
415 soil bacterial community to contribute to both. Applying 150 kg ha-1 of N fertilizer compared to
417 applications throughout the season reduced N losses, which may have been due to leaching and/or
418 bacterial immobilisation. This increased the soil mineral N available later in the season, where it
419 may contribute to higher yield quality. Furthermore, applying a large amount of N fertilizer
420 appeared to shift the community toward taxonomic groups that are more prone to immobilize soil
421 N and release soil carbon.
422 Applying a high level of N fertilizer is thus a ‘lose-lose-lose’ situation for farmers, their
423 soil ecosystems, and the environment. Fortunately, farmers in the Western Cape tend to apply
70-424 90 kg ha-1 and some do split it over two or three applications in the season. This study confirms
425 the wisdom of such practices: canola does not use additional N, and excess N may affect the
426 functioning of agricultural soil and threaten natural ecosystems. Ongoing trials in the region will
427 assess the response of canola to a greater range of fertilization strategies (du Toit, 2018) to allow
428 the optimal amount and distribution of N fertilizer for canola to be refined.
429
430 Acknowledgements
431 This study formed part of the National Research Foundation of South Africa’s Research Career
432 Advancement Fellowship of M le Roux (RCA13100150915). The field experiment was a
433 component of a larger trial that was funded by the Protein Research Foundation. The principal
434 investigator of the larger field trial, Prof GA Agenbag, is acknowledged for allowing us to work
435 within the trial that was funded by the Protein Research Foundation. The Western Cape
436 Department of Agriculture is thanked for availing Langgewens Research Farm, Overberg Agri for
437 Roodebloem and Mr V Laubscher for Altona. The technical support team under leadership of Mr
438 M la Grange is thanked for the assistance with fieldwork. Mr J Habig (Agritechnovation) is
439 thanked for the analyses of the C-source utilisation.
440
442 References
443 AOAC. 2000. Official method of analysis 988.05 (17th Edition) Volume I. Association of Official
444 Analytical Chemists, Inc., Maryland, USA.
445 Bender, S.F., C. Wagg, and M.G.A. van der Heijden. 2016. An Underground Revolution:
446 Biodiversity and Soil Ecological Engineering for Agricultural Sustainability. Trends Ecol.
447 Evol. 31:440–452.
448 Bissett, A., Richardson, A.E., Baker, G. and Thrall, P.H. 2011. Long-term land use effects on soil
449 microbial community structure and function. Appl. Soil Ecol. 51:66-78.
450 BFAP. 2018. The Bureau for Food and Agricultural Policy Baseline Agricultural Outlook 2018 –
451 2027. BFAP, Pretoria, South Africa.
452 Boulygina, E.S., B.B. Kuznetsov, A.I. Marusina, T.P. Tourova, I.K. Kravchenko, S.A. Bykova,
453 T.V. Kolganova, and V.F. Galchenko. 2002. A study of nucleotide sequences of nifH genes
454 of some methanotrophic bacteria. Microbiol. 71:425–432.
455 Brink, C.J., Postma, A., Slabbert, E., Postma, F., Muasya, A.M. and Jacobs, K. 2019. Bacterial
456 Communities Associated with Natural and Commercially Grown Rooibos (Aspalathus
457 linearis). Pedosphere (In Press).
458 Brown, M.V., M.S. Schwalbach, I. Hewson, and J.A. Fuhrman. 2005. Coupling 16S-ITS rDNA
459 clone libraries and automated ribosomal intergenic spacer analysis to show marine microbial
460 diversity: development and application to a time series. Environ. Microbiol. 7:1466–1479.
461 Brussaard, L., P.C. de Ruiter, and G.G. Brown. 2007. Soil biodiversity for agricultural
462 sustainability. Agric. Ecosyst. Environ. 121:233–244.
463 Buchkowski, R.W., O.J. Schmitz, and M.A. Bradford. 2015. Microbial stoichiometry overrides
464 biomass as a regulator of soil carbon and nitrogen cycling. Ecol. 96:1139-1149.
465 Cardinale M, Brusetti L, Quatrini P, Borin S, Puglia AM, Rizzi A, Zanardini E, Sorlini C, Corselli
467 intergenic spacer analysis of complex bacterial communities. Applied and Environmental
468 Microbiology, 70, 6147–6156.
469 Cataldo, D., H. Haroon, L. Schrader, and V. Young. 1975. Rapid colorometric determination of
470 nitrate in plant tissue by nitrate of salicylic acid. Commun. Soil Sci. Plant Anal. 71–80.
471 Compton, J.E, L.S. Watrud, L.A. Porteous, and S.D. eGrood. 2004. Response of soil microbial
472 biomass and community composition to chronic nitrogen additions at Harvard forest. For.
473 Ecol. Manage. 196:143–158.
474 Coolon, J.D., K.L. Jones, T.C. Todd, J.M. Blair, and M.A. Herman. 2013. Long-term nitrogen
475 amendment alters the diversity and assemblage of soil bacterial communities in tallgrass
476 prairie. PLoS ONE 8(6):e67884.
477 de Clercq, W., N. Jovanovic, R. Bugan, E. Mashimbye, T. du Toit, A. van Niekerk, F. Ellis, N.
478 Wasserfall, P. Botha, T. Steudels, J. Helmschrot, and W-A. Flugel. 2013. Management of
479 human-induced salinisation in the Berg River catchment and development of criteria for
480 regulating agricultural land use in terms of salt generating capacity. Water Research
481 Commission Report No. 1849/1/13.
482 De Meyer, S.E., K. Van Hoorde, B. Vekeman, T. Braeckman, and A. Willems. 2011. Genetic
483 diversity of rhizobia associated with indigenous legumes in different regions of Flanders
484 (Belgium). Soil Biol. Biochem. 43:2384–2396.
485 Demoling, F., L.O. Nilsson, and E. Bååth. 2008. Bacterial and fungal response to nitrogen
486 fertilization in three coniferous forest soils. Soil Biol. Biochem. 40:370-379.
487 du Toit, E. 2018 Developing nitrogen fertiliser management strategies for canola (Brassicanapus
488 L.) under conservation agriculture practices in the Western Cape. Dissertation, Stellenbosch
489 University, South Africa.
490 Fertasa (Fertilizer Association of Southern Africa). 2016. Fertilizer Handbook. 8th Revised
492 Fierer, N., C.L. Lauber, K.S. Ramirez, J. Zaneveld, M.A. Bradford, and R. Knight. 2012
493 Comparative metagenomic, phylogenetic and physiological analyses of soil microbial
494 communities across nitrogen gradients. ISME J. 6:1007–1017.
495 Fog, K., 1988. The effect of added nitrogen on the rate of decomposition of organic matter. Biol.
496 Rev. 63(3):433-462.
497 Gordon, B.R., C.R. Klinger, D.J. Weese, J.A. Lau, P.V. Burke, B.T. Dentinger, and K.D. Heath.
498 2016. Decoupled genomic elements and the evolution of partner quality in nitrogen‐fixing
499 rhizobia. Ecol. Evol. 6:1317-1327.
500 Hartman, K, M.G. van der Heijden, R.A. Wittwer, S. Banerjee, J.C. Walser, and K. Schlaeppi.
501 2018. Cropping practices manipulate abundance patterns of root and soil microbiome
502 members paving the way to smart farming. Microbiome 6:14. DOI
10.1186/s40168-017-503 0389-9
504 Hartmann, M., B. Frey, J. Mayer, P. Mäder, and F. Widmer. 2015. Distinct soil microbial diversity
505 under long-term organic and conventional farming. ISME J 9:1177
506 Hasselquist, N.J., D.B. Metcalfe, and P. Högberg. 2012. Contrasting effects of low and high
507 nitrogen additions on soil CO 2 flux components and ectomycorrhizal fungal sporocarp
508 production in a boreal forest. Global Change Biol. 18(12):3596–3605.
509 Hill, T., K. Walsh, J. Harris and B. Moffett. 2003. Using ecological diversity measures with
510 bacterial communities. FEMS Microbiol. Ecol. 43:1–11.
511 Jackson, R. B., K. Lajtha, S.E. Crow, G. Hugelius, M.G. Kramer and G. Piñeiro. 2017. The
512 Ecology of Soil Carbon: Pools, Vulnerabilities, and Biotic and Abiotic Controls. Annual
513 Rev. Ecol. Evol. Syst. 48(1):419–445.
514 Janssens, I. A., W. Dieleman, S. Luyssaert, J. A. Subke, M. Reichstein, R. Ceulemans, P. Ciais,
515 A. J. Dolman, J. Grace, G. Matteucci, and D. Papale. 2010. Reduction of forest soil
517 Keeney, D.R, RH Miller, AL Page (1982) Chemical and microbiological properties. In: Page AL,
518 Keeney DR, Miller RH (eds) Methods of soil analysis. Part 2: Chemical and microbiological
519 properties, 2nd edn, Agronomy Series no. 9. Madison, American Society of Agronomy
520 Kennedy, N., E. Brodie, J. Connolly, and N. Clipson. 2004. Impact of lime, nitrogen and plant
521 species on bacterial community structure in grassland microcosms. Environ. Microbiol.
522 6:1070–1080.
523 Kuypers, M.M.M., H.K. Marchant, and B. Kartal. 2018. The microbial nitrogen-cycling network.
524 Nature Rev. Microbiol. 16(5):263–276. https://doi.org/10.1038/nrmicro.2018.9
525 Lal, R. 2004. Carbon emission from farm operations. Environ. Int. 30:981–990.
526 Lauber, C.L., M. Hamady, R. Knight, and N. Fierer. 2009. Pyrosequencing-Based Assessment of
527 Soil pH as a Predictor of Soil Bacterial Community Structure at the Continental Scale. Appl.
528 Environ. Microbiol. 75:5111–5120.
529 Ledgard, S.F. 2001. Nitrogen cycling in low input legume-based agriculture, with emphasis on
530 legume/grass pastures. Plant Soil 228:43–59.
531 Liu, M., E. Klemens, B. Zhang, S.I.J. Holzhauer, Z. Li, T. Zhang, and S. Rauch. 2011. Effect of
532 Intensive Inorganic Fertilizer Application on Microbial Properties in a Paddy Soil of
533 Subtropical China. Agric. Sci. China 10:1758–1764
534 Ma, B., and A. Herath. 2015. Timing and rates of nitrogen fertilizer application on seed yield,
535 quality and nitrogen use efficiency of Canola. Crop Pasture Sci. 67:167–180.
536 MacLaren C., J. Storkey., J. Strauss., P. Swanepoel., K. Dehnen‐Schmutz. 2019. Livestock in
537 diverse cropping systems improve weed management and sustain yields whilst reducing
538 inputs. J. Appl. Ecol. 56:144-156.
539 McDaniel, M.D., L.K. Tiemann., and A.S. Grandy. 2014. Does agricultural crop diversity enhance
540 soil microbial biomass and organic matter dynamics? A meta-analysis. Ecol. Appl. 24:560–
542 Mengel, K. 1996. Turnover of organic nitrogen in soils and its availability to crops. Plant Soil
543 181:83–93.
544 Non-Affiliated Soil Analysis Work Committee. 1990. Handbook of Standard Soil Testing
545 Methods for Advisory Purposes. Soil Science Society of South Africa, Pretoria, South
546 Africa.
547 Orr, C.H., A, James., C. Leifert, J.M. Cooper, and S.P. Cummings. 2011. Diversity and activity of
548 free-living nitrogen-fixing bacteria and total bacteria in organic and conventionally managed
549 soils. Appl. Environ. Microbiol. 77:911–919.
550 Plaza, C., D. Courtier-Murias, J.M. Fernández, A. Polo, and A.J. Simpson. 2013. Physical,
551 chemical, and biochemical mechanisms of soil organic matter stabilization under
552 conservation tillage systems: a central role for microbes and microbial by-products in C
553 sequestration. Soil Biol. Biochem. 57:124-134.
554 R Core Team. 2017. R: A language and environment for statistical computing. R Foundation for
555 Statistical Computing, Vienna, Austria. URL https://www.R-project.org/.
556 Ramirez, K.S., C.L. Lauber, R. Knight, M.A. Bradford, and N. Fierer. 2010. Consistent effects of
557 nitrogen fertilization on soil bacterial communities in contrasting systems. Ecol. 91:3414–
558 3463.
559 Ranjard, L., F. Poly, J.C. Lata, C. Mougel, J. Thioulouse, and S. Nazaret. 2001. Characterization
560 of bacterial and fungal soil communities by automated ribosomal Intergenic spacer analysis
561 fingerprints: Biological and methodological variability. Appl. Environ. Microbiol. 67:4479–
562 4487.
563 Rockström, J., J. Williams, G. Daily, A. Noble, N. Matthews, L. Gordon, and C. de Fraiture. 2017.
564 Sustainable intensification of agriculture for human prosperity and global sustainability.
566 Seitzinger, S.P., and L. Phillips. 2017. Nitrogen stewardship in the Anthropocene. Sci.
357:350-567 351.
568 Shibata, H., J.N. Galloway, A.M. Leach, L.R. Cattaneo, L.C. Noll, J.W. Erisman, B. Gu, X. Liang,
569 K. Hayashi, L. Ma, and T. Dalgaard. 2017. Nitrogen footprints: Regional realities and
570 options to reduce nitrogen loss to the environment. Ambio 46:129-142.
571 Slabbert, E., R.Y. Kongor, K.J. Esler, and K. Jacobs. 2010a. Microbial diversity and community
572 structure in Fynbos soil. Molecular Ecol. 19:1031–1041.
573 Slabbert E, Van Heerden CJ and K. Jacobs. 2010. Optimisation of automated ribosomal intergenic
574 spacer analysis for the estimation of microbial diversity in fynbos soil. S Afr J Sci. 106:1-4.
575 Swanepoel P.A., P.J.G. le Roux, G.A. Agenbag, J.A. Strauss, and C. MacLaren. 2019. Seed-drill
576 opener type and crop residue load affect canola establishment, b.ut only residue load affects
577 yield. Agron. J. 111:1-8 doi: 10.2134/agronj2018.10.0695
578 Tilman, D., K.G. Cassman, P.A. Matson, R. Naylor, and S. Polasky. 2002 Agricultural
579 sustainability and intensive production practices. Nature 418(6898):671.
580 Van Der Bom, F., I. Nunes, N.S. Raymond, V. Hansen, L. Bonnichsen, J. Magid, O. Nybroe, and
581 L.S. Jensen. 2018. Long-term fertilisation form, level and duration affect the diversity,
582 structure and functioning of soil microbial communities in the field. Soil Biol. Biochem.
583 122:91–103.
584 Venter, Z.S., S.L. Scott, J. Strauss, K. Jacobs, H-J. Hawkins. 2017. Increasing crop diversity
585 increased soil microbial activity, nitrogen-sourcing and crop nitrogen, but not soil microbial
586 diversity. S. A. J. Plant Soil 34:371-378.
587 Viña A., A.A. Gitelson, A.L. Nguy-Robertson, and Y. Peng. 2011. Remote Sensing of
588 Environment Comparison of different vegetation indices for the remote assessment of green
590 Wang J., J. Bao, J. Su, X. Li, G. Chen, and X. Ma. 2015. Impact of inorganic nitrogen additions
591 on microbes in biological soil crusts. Soil Biol. Biochem. 88:303–313.
592 Williams A., G. Börjesson, and K. Hedlund. 2013. The effects of 55 years of different inorganic
593 fertiliser regimes on soil properties and microbial community composition. Soil Biol.
594 Biochem. 67:41–46.
595 Zhao X., Y. Zhou, J. Min, S. Wang, W. Shi and G. Xing. 2012. Nitrogen runoff dominates water
596 nitrogen pollution from rice-wheat rotation in the Taihu Lake region of China. Agric.
598 FIGURES
599 Figure 1: Soil mineral nitrogen (N) and canola biomass and leaf area index (LAI) in each
600 treatment at 60, 90 and 120 days after emergence (DAE). LAI was not measured at 120 DAE.
601 Labels along the x-axis refer to the different treatments: ‘Cont’ = Control, and other labels
602 indicate the total N rate in kg ha-1 (60 or 150) and the number of applications in which this was
603 applied (1, 2 or 3). Soil samples were taken prior to fertilization. Error bars indicate the standard
604 error of the mean. Lowercase letters above the bars indicate pairwise differences significant at
605 P=0.05, based on contrasts estimated from the ANOVAs in Table 4. Treatments that differ do not
606 share the same letter. Shading denotes the control treatment (pale), the 60 kg N ha-1 treatments
607 (medium) and the 120 kg N ha-1 treatments (dark). Note the log scales on the y-axes.
608
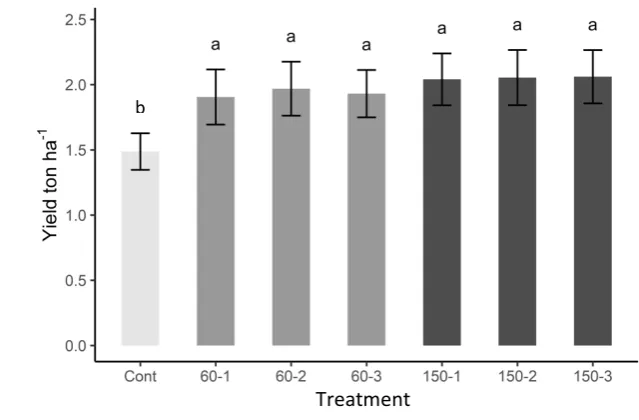
609 Figure 2: Canola yield in response to N fertilizer rates and timing. Labels along the x-axis refer
610 to the different treatments: ‘Cont’ = Control, and other labels indicate the total N rate in kg ha-1
611 (60 or 150) and the number of applications in which this was applied (1, 2 or 3). Lowercase letters
612 indicate pairwise differences significant at P=0.05, based on contrasts estimated from the
613 ANOVAs in Table 5. Treatments that differ do not share the same letter. Shading denotes the
614 control treatment (pale), the 60 kg N ha-1 treatments (medium) and the 120 kg N ha-1 treatments
615 (dark).
616
617 Figure 3: The NMS ordination of the OTUs of bacterial DNA extracted from soil in each
618 treatment at the end of the season. The amount of N applied to each plot is denoted by shading,
619 while the number of N applications is not indicated as the community did not differ in relation to
620 application number.
622 Figure 4: Axes 1 and 2 (a) and 1 and 3 (b) of the NMS ordination of carbon source utilization by
623 bacterial communities from soil in each treatment at the end of the season. The amount of N
624 applied to each plot is denoted by shading (see legend), while the number of N applications nor
625 farm are indicated as these did not affect carbon utilization. The blue letters indicate the mean
626 centroid of each N amount treatment (H = high; 150 kg N ha-1, L = low; 60 kg N ha-1 and N =
627 none; control), and the blue circle indicates the standard error of that mean. The boxed labels refer
628 to the carbon sources most used by sites in that part of the ordination. Labels further away from
629 the centre of the plot indicate a greater change in the use of that carbon source in that direction.
630 a. acids = amino acids; c. acids = carboxylic acids; carbs = carbohydrates; phos.cpds =
631 phosphorylated compounds
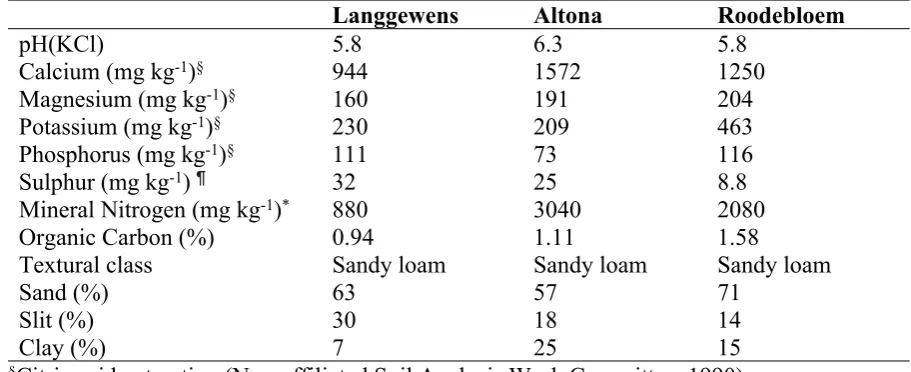
633 Table 1: Soil chemical and physical characteristics of the research sites, Langgewens Research
634 Farm, Altona and Roodebloem. Samples were taken prior to onset of the trial and were taken to a
635 depth of 150 mm.
Langgewens Altona Roodebloem
pH(KCl) 5.8 6.3 5.8
Calcium (mg kg-1)§ 944 1572 1250
Magnesium (mg kg-1)§ 160 191 204
Potassium (mg kg-1)§ 230 209 463
Phosphorus (mg kg-1)§ 111 73 116
Sulphur (mg kg-1) ¶ 32 25 8.8
Mineral Nitrogen (mg kg-1)* 880 3040 2080
Organic Carbon (%) 0.94 1.11 1.58
Textural class Sandy loam Sandy loam Sandy loam
Sand (%) 63 57 71
Slit (%) 30 18 14
Clay (%) 7 25 15
636 §Citric acid extraction (Non-affiliated Soil Analysis Work Committee, 1990)
637 ¶Calcium phosphate extraction (Non-affiliated Soil Analysis Work Committee, 1990)
638 *Indophenol-blue and salicylic acid methods (Cataldo et al., 1975; Keeney et al., 1982)
640 Table 2: Nitrogen fertilization rates and distribution for canola production at planting, 30 days
641 after emergence (DAE), 60 DAE and 90 DAE. Treatment 0 is the control, which received no
642 nitrogen (N) fertilization throughout the season.
Treatment Amount of N applied at each time point (kg ha-1)
Rate (kg N ha-1)* Number of
applications** At planting 30 DAE 60 DAE 90 DAE
0 0 0 0 0 0
60 1 20 40 0 0
60 2 20 20 20 0
60 3 20 13.3 13.3 13.3
150 1 20 130 0 0
150 2 20 65 65 0
150 3 20 43.3 43.3 43.3
643 * Refers to the total amount applied over the whole season
644 **Refers to the number of applications after planting, as all treatments (except the control) 645 received 20 kg ha-1 N at planting, following common practice in the region.
646
647
648
649 Table 3: Summary of variables measured in this trial and the time point(s) at which they were
650 measured. DAE = Days after emergence
Response
variables 60 DAE 90 DAE
Physiological maturity/harvest
(approximately 150 DAE) Soil N and
canola growth measurements
Soil mineral N Biomass LAI
Soil mineral N Biomass LAI
Soil mineral N Biomass production Yield
Harvest index
Nitrogen (crude protein)
Bacterial community measurements
OTUs (ARISA) Carbon utilization nifH gene copies 651
653 Table 4: ANOVA F-statistics and P-values for the fixed effects in the mixed models of soil mineral
654 N and canola leaf area index and biomass, and standard deviations for each random effect and the
655 residual. Significant P-values <0.05 for fixed effects are emphasized in bold. Where cells are
656 blank, data was not collected for that response at that time point. DAE=days after emergence.
Time point Effect type Log soil mineral N Log leaf area index Log biomass
Fixed effects F statistic df P value F statistic df P value F statistic df P value Control vs
treated 1.888 66 0.174 4.518 65 0.037 4.064 65 0.048
N amount 0.488 66 0.487 10.344 65 0.002 11.721 65 0.001
N distribution 2.561 66 0.085 1.654 65 0.199 1.89 65 0.159
60 DAE
Interaction* 0.847 66 0.433 4.964 65 0.01 6.34 65 0.003
Random
effects Standard deviation Standard deviation Standard deviation
Replicate 0.078 0.000 0.000
Farm 0.285 0.456 0.706
Residual 0.356 0.268 0.442
Fixed effects F statistic df P value F statistic df P value F statistic df P value Control vs
treated 26.101 66 <0.001 7.391 65 0.009 3.954 65 0.051
N amount 3.732 66 0.058 5.772 65 0.019 10.213 65 0.002
N distribution 6.884 66 0.002 1.626 65 0.205 1.481 65 0.235
90 DAE
Interaction* 0.535 66 0.588 1.253 65 0.293 3.204 65 0.047
Random
effects Standard deviation Standard deviation Standard deviation
Replicate 0.046 0.104 0.000
Farm 0.412 0.249 0.202
Residual 0.359 0.400 0.551
Fixed effects F statistic df P value F statistic df P value F statistic df P value Control vs
treated 37.97 66 <0.001 2.425 65 0.124
N amount 8.541 66 0.005 1.885 65 0.175
N distribution 14.867 66 <0.001 0.338 65 0.714
Physio-logical maturity
Interaction* 4.713 66 0.012 0.977 65 0.382
Random
effects Standard deviation Standard deviation Standard deviation
Replicate 0.155 0.059
Farm 0.469 0.262
Residual 0.334 0.366
658 Table 5: ANOVA F-statistics and P-values for the fixed effects in the mixed models of canola
659 yield, harvest index and tissue N content, and standard deviations for each random effect and the
660 residual. Significant P-values (< 0.05) for fixed effects are emphasized in bold. Where cells are
661 blank, data was not collected for that response at that time point. DAE=days after emergence.
Yield Harvest index Tissue N content
Fixed effects F statistic df P value F statistic df P value F statistic df P value
Control vs treated
20.575 65 <0.001 0.017 65 0.896 1.251 64 0.267
N amount 1.058 65 0.308 1.634 65 0.206 1.537 64 0.22
N distribution 0.013 65 0.987 0.557 65 0.576 0.243 64 0.785
Interaction* 0.032 65 0.969 1.315 65 0.275 0.138 64 0.871
Random
effects Standard deviation Standard deviation Standard deviation
Replicate 0.000 0.000 0.064
Farm 0.481 0.094 0.187
Residual 0.956 0.085 0.247
662 *The N amount x N distribution interaction.
663
664 Table 6: ANOVA F-statistics and P-values for the amount and distribution of nitrogen (N) in the
665 mixed models of bacterial richness, Shannon diversity and copies of the nifH gene in the soil when
666 the canola reached physiological maturity. Significant P-values <0.05 are emphasized in bold.
OTU Shannon diversity OTU richness nifH
Fixed effects F statistic df P value F statistic df P value F statistic df P value Control vs
treated 1.598 58 0.211 1.513 58 0.224 0.002 75 0.969
N amount 0.162 58 0.689 0.224 58 0.638 0.714 75 0.401
N distribution 1.459 58 0.241 2.579 58 0.084 2.324 75 0.106
Interaction* 1.748 58 0.183 3.22 58 0.047 1.513 75 0.228
Random
effects Standard deviation Standard deviation Standard deviation
Replicate 0.000 0.00 0.0
Farm 0.796 12.35 629.4
Residual 1.091 14.98 1059.0
669 Table 7: PERMANOVA F-statistics and P-values for the dissimilarity matrices of bacterial DNA
670 and carbon source functional composition. The PERMANOVAs were calculated on the same
671 Bray-Curtis dissimilarity matrices used for the NMDS ordinations (Figures 4 and 5). Significant
672 P-values <0.05 are emphasized in bold.
Bacterial DNA Community function
PERMANOVA F P Value PERMANOV
A F P Value
Control vs treated 1.167 0.079 1.8 0.124
N amount 1.552 0.007 2.564 0.051
N distribution 0.875 0.316 1.248 0.272
Interaction* 1.185 0.031 1.468 0.169
1
Figure 1 2
1
Figure 2 2
b
1
Figure 3
2
1
2