RVC OPEN ACCESS REPOSITORY – COPYRIGHT NOTICE
This is the peer-reviewed, manuscript version of the following article:
Greve, L., Pfau, T. and Dyson, S. 'Thoracolumbar movement in sound horses trotting in straight lines in hand and on the lunge and the relationship with hind limb symmetry or asymmetry', The Veterinary Journal.
The final version is available online: http://dx.doi.org/10.1016/j.tvjl.2017.01.003.
© 2016. This manuscript version is made available under the CC-BY-NC-ND 4.0 license
http://creativecommons.org/licenses/by-nc-nd/4.0/.
The full details of the published version of the article are as follows:
TITLE: Thoracolumbar movement in sound horses trotting in straight lines in hand and on the lunge and the relationship with hind limb symmetry or asymmetry
AUTHORS: L. Greve, T. Pfau, S. Dyson
JOURNAL: The Veterinary Journal
PUBLISHER: Elsevier
PUBLICATION DATE: 4 January 2017 (online)
Accepted Manuscript
Title: Thoracolumbar movement in sound horses trotting in straight lines in hand and on the lunge and the relationship with hind limb symmetry or asymmetry
Author: L. Greve, T. Pfau, S. Dyson
PII: S1090-0233(17)30008-4
DOI: http://dx.doi.org/doi: 10.1016/j.tvjl.2017.01.003 Reference: YTVJL 4938
To appear in: The Veterinary Journal
Accepted date: 3-1-2017
Please cite this article as: L. Greve, T. Pfau, S. Dyson, Thoracolumbar movement in sound horses trotting in straight lines in hand and on the lunge and the relationship with hind limb symmetry or asymmetry, The Veterinary Journal (2017), http://dx.doi.org/doi:
10.1016/j.tvjl.2017.01.003.
Original Article 1
2 3
Thoracolumbar movement in sound horses trotting in straight lines in hand and on the 4
lunge and the relationship with hind limb symmetry or asymmetry 5
6 7
L. Greve a, b, *, T. Pfau b, S. Dyson a 8
9
a
Centre for Equine Studies, Animal Health Trust, Lanwades Park, Kentford, Newmarket, Suffolk 10
CB8 7UU, UK 11
b
Department of Clinical Science and Services, The Royal Veterinary College, University of 12
London, Hawkshead Lane, North Mymms, Hatfield AL9 7TA, UK 13
14
* Corresponding author. Tel.: +44 163 8751908 15
E-mail address: line.greve@aht.org.uk (L. Greve).
Highlights 18
Objective: to determine thoracolumbar movement parameters in sound trotting horses 19
Circles induce changes in thoracolumbar movement compared with straight lines
20
Changes in thoracolumbar movement are associated with alterations in hindlimb gait
21
Abstract 22
Equine movement symmetry is changed when turning, which may induce alterations in 23
thoracolumbosacral kinematics; however, this has not previously been investigated.Our 24
objectives were to document thoracolumbar movement in subjectively sound horses comparing 25
straight lines with circles on both reins and to relate these observations to the objectively 26
determined symmetry/asymmetry of hindlimb gait. Fourteen non-lame horses were assessed 27
prospectively in a non-random, cross-sectional survey. The horses were trotted in straight lines 28
and lunged on both reins and inertial sensor data collected at landmarks: withers, T13 and T18, 29
L3, tubera sacrale, and left and right tubera coxae. Data were processed using published 30
methods; angular motion range of motion (ROM; flexion-extension, axial rotation, lateral 31
bending) and translational ROM (dorsoventral and lateral) and symmetry within each stride were 32
assessed. 33
34
The dorsoventral movement of the back exhibited a sinusoidal pattern with two 35
oscillations per stride. Circles induced greater asymmetry in dorsoventral movement within each 36
stride (mean ± standard deviation, up to 9 ± 6%) compared with straight lines (up to 6 ± 6%). 37
The greatest amplitude of dorsoventral movement (119 ± 14mm in straight lines vs. 126 ± 20mm 38
in circles) occurred at T13. Circles induced greater flexion-extension ROM (> 1.3°; P = 0.002), 39
straight lines. Circles induced a movement pattern similar to an inside hindlimb lameness, which 41
was significantly associated with the circle-induced greater asymmetry of dorsoventral 42
movement of the thoracolumbar region (P = 0.03). Moving in a circle induces measurable 43
changes in thoracolumbar movement compared with moving in straight lines, associated with 44
alterations in the hindlimb gait. 45
46
Keywords: Biomechanics; Back pain; Equine; Inertial measurement units; Lameness
47
Introduction 49
Equine spinal motion has been assessed in great detail in vitro (Jeffcott and Dalin, 1980; 50
Townsend et al., 1983) and to some extent in vivo (Faber et al., 2000, 2001a, b; Licka et al., 51
2001a, b). Movement symmetry is changed when turning (Pfau et al. 2012), which may induce 52
alterations in thoracolumbosacral kinematics, however this has not been investigated. 53
54
Optical motion capture is the current reference standard to capture thoracolumbar 55
kinematics with high repeatability (Faber et al., 2001a, b, 2002) and has previously been used in 56
asymptomatic riding horses (Johnson and Moore-Colyer, 2009) and in sports horses with epaxial 57
muscle pain (Wennerstrand et al., 2004). However, the constriction of camera calibration makes 58
it difficult and the high cost of multiple specialist cameras required to cover large areas (e.g. a 59
whole riding arena) makes it economically unviable to be used outside gait laboratories. 60
Preliminary work using inertial measurement units (IMUs) in non-ridden horses compared with 61
optical motion capture concluded that IMUs are a reliable and accurate tool to measure 62
thoracolumbar movement (Warner et al., 2010). More recently IMUs have been used to establish 63
reference values for thoracolumbar movement in Franches-Montagnes horses in-hand and under 64
saddle (Heim et al., 2015). Various methods have been developed to enable left/right asymmetry 65
to be quantified numerically based on vertical displacement of upper body landmarks (Buchner 66
et al., 1996; Peham et al., 1996; Uhlir et al., 1997; Keegan et al., 2001; Kramer et al., 2004). 67
Symmetry indices can be calculated to quantify movement symmetry between the movement 68
amplitudes of the two halves within each stride, while MinDiff and MaxDiff are used to quantify 69
the differences in minimum and maximum displacement of the body landmark to which the 70
72
HipHike difference (HHD) quantifies the difference in upward movement of each tuber 73
coxae during contralateral hindlimb stance and this measure reflects one of the visual 74
observations in horses with hindlimb lameness (May and Wyn-Jones, 1987). When measuring 75
pelvic movement symmetry parameters (MinDiff, MaxDiff, HHD) quantifying the response to 76
diagnostic analgesia in horses with hindlimb lameness, the most consistent changes were 77
observed in MinDiff and HHD (Pfau et al. 2014). 78
79
There is evidence that saddle slip consistently to one side occurs in approximately 50% of 80
horses with hindlimb lameness (Greve and Dyson, 2013, 2014) suggesting that the movement of 81
the thoracolumbar region is altered by hindlimb lameness. However, we need to understand 82
better the relationship between pelvic and thoracolumbar symmetry in sound horses and those 83
with hindlimb lameness, and in particular to establish the interrelationship between the symmetry 84
and amplitude of thoracolumbar movement and the hindlimb gait under a variety of movement 85
conditions. Horses adapt to experimentally induced lameness by extending the thoracolumbar 86
region and decreasing the range of motion (ROM) of the lumbosacral segment (Gómez Álvarez 87
et al., 2008); induced epaxial muscle pain results in reduced movement of the thoracolumbar 88
region (Wennerstrand et al., 2004, 2009). When measuring changes in thoracolumbar dimensions 89
with a flexible curve ruler every two months over one year, it was demonstrated that the presence 90
of pre-existing lameness had a negative influence on the development of the epaxial musculature 91
(Greve and Dyson, 2015), presumably related to reduced use of the thoracolumbar epaxial 92
muscles. 93
With sensitive measurement techniques one might expect to be able to measure 95
asymmetry in pelvic and thoracolumbar movement in circles in sound horses, because in circles 96
the inside and outside hindlimbs are each describing a path with a different radius. This alters the 97
symmetry in loading and push off from each hindlimb during a stride compared with moving in 98
straight lines and has been quantified in horses on the lunge (Pfau et al., 2012). 99
100
Our objectives were to document movement of the thoracolumbar region in subjectively 101
sound horses in straight lines in hand and on the lunge, comparing left and right reins, and relate 102
these observations to the objectively determined symmetry or asymmetry of hindlimb gait. We 103
hypothesised that trotting in circles will induce asymmetry in the thoracolumbar movement 104
which is symmetrical between the left and right reins and that these changes will be associated 105
with alterations in the hindlimb gait. 106
107
Materials and methods 108
A prospective study was performed comprising sports horses, in regular work, presumed 109
by the riders to be sound. This was a convenience sample, selected based on proximity to the 110
authors. All horses were ridden by the normal rider in usual tack and had no recent history of 111
lameness or epaxial muscle pain. Age, breed, gender, height (copied from the passport), work 112
discipline and level of training or competition were recorded. The current study was approved 113
by the Ethical Review Committee of the Animal Health Trust (AHT 14.2014; 28 February 114
2014) and there was informed owner consent. 115
116
Fourteen selected horses were sound in hand, no more than grade 1/8 lame (Dyson, 2011) 118
after flexion of a single limb, and sound on the lunge on soft and firm surfaces and ridden 119
(Dyson and Greve, 2016). 120
121
Inertial measurement units (IMUs) 122
Objective gait assessment was performed 4 ˗14 days after the initial gait assessment. 123
Each horse was instrumented with seven MTx (18 g, 1200 degree/s) miniaturised IMUs (Xsens 124
Technologies) and one MTi-G IMU with integrated global positioning system receiver. The 125
IMUs were attached to the head (the poll, using a custom-made velcro attachment to the head 126
piece of the bridle) and to the left and right tubera coxae, over the midline of the horse at the 127
level of the tubera sacrale (MTi-G), the withers, T13, T18 and L3; the sensors were in custom-128
made pouches and attached with double-sided tape (F ball Impact Tape, F. Ball). An elasticated 129
surcingle was used to fix the wireless transmitter unit (Xbus, Xsens Technologies) to the horse's 130
body. Sensors were attached in three strings (1, head; 2, left and right tubera coxae, tubera 131
sacrale, L3; 3, withers, T13, T18) to the Xbus transmitting IMU data at a sampling rate of 100Hz 132
per individual sensor channel. 133
134
Dynamic assessment with IMUs 135
Fourteen horses selected as sound were trotted in hand on a soft surface (an indoor arena 136
approximately 25 m 60 m, with sand and fibre on a very firm base, n = 2; or with a very soft 137
base, n = 10; or an outdoor arena approximately 30 m 70 m with sand and fibre on a firm base, 138
n = 2) and then lunged on the left rein followed by the right rein using a consistent lunging 139
their familiarity with the horses) were asked to use the same lunge line with a fixed length of 5 m 141
resulting in a circle diameter of approximately 10 m. The handlers were asked to allow the 142
horses to trot in hand and on the lunge at each horse’s preferred speed. IMU data were collected 143
for at least 40 strides. Notes and video recordings acquired during data collection described 144
deviations from the expected movement condition, e.g., changes in gait, speed or gait quality. If 145
a horse deviated from the required movement condition (e.g., broke into a different gait) data 146
collection was repeated. One trot trial at the horse's preferred speed on the lunge on both left and 147
right reins in trot was recorded for each circumstance. Two trials were performed in four horses 148
trotting in straight lines and up to ± 5 mm difference of the median of any outcome variable 149
between trials was achieved. The video recordings of the horses were acquired from outside of 150
the circle. Video recordings of the horses were acquired during objective data acquisition for 151
subsequent assessment by SJD. Intra-assessor repeatability of the 20 horses videoed was 152
performed three times at intervals of 2 months and 100% agreement was achieved with regard to 153
the presence of lameness (yes/no). Previous intra-assessor repeatability has been documented in 154
50 horses that were randomly selected and assessed twice in a random order at an interval of 1-4 155
months; 98% correlation was achieved for lameness group (Greve and Dyson, 2014). 156
157
Data processing 158
Vertical displacement of the tubera sacrale and the left and right tubera coxae was 159
determined. Processing of IMU data followed published methods (Pfau et al., 2005) with 160
custom-written software in MATLAB (The Mathworks). 161
162
Quantification of kinematic symmetry measures
The following kinematic symmetry measurements were determined: symmetry index, 164
MinDiff and MaxDiff for pelvis and HHD. A horse moving perfectly symmetrically would have 165
a symmetry index of 1 and MinDiff, MaxDiff and HHD values of 0. Detailed description of the 166
calculations can be found elsewhere (Pfau et al., 2012). MinDiff > 0 mm means greater 167
downward movement during right hindlimb (RH) stance compared with left hindlimb (LH) 168
stance, whereas MinDiff < 0 mm means greater downward movement during the LH stance 169
compared with RH stance. MaxDiff < 0 mm means greater upward movement after RH stance 170
compared with LH stance, whereas MaxDiff > 0 mm means greater upward movement after LH 171
stance compared with RH stance. 172
173
Three-dimensional kinematics of the vertebral column 174
A standard right-handed orthogonal Cartesian coordinate system was used (craniocaudal or 175
x positive axis directed along the line of progression; dorsoventral or z axis vertical [aligned with 176
gravitational field] and positive in the upward direction; lateral-lateral or y, axis perpendicular to 177
the first two axes positive to the left of the line of progression). The craniocaudal (x), lateral-178
lateral (y) and dorsoventral (z) displacement data in the horse based reference system were 179
calculated following published methods (Pfau et al. 2005, Warner et al., 2010) with modified 180
highpass filter frequencies chosen as 1.5 Hz for dorsoventral and 0.75 Hz for lateral-lateral 181
movement. 182
183
Outcome variables 184
Angular movement (a change in orientation) of the withers, T13, T18 and L3 was assessed 185
about the transverse (lateral-lateral); axial rotation ROM, which is the body rotation about the 187
longitudinal (craniocaudal) axis; and lateral bending, which is the body rotation about the 188
vertical (dorsoventral) axis. Translational movement in two directions was measured in mm. 189
Displacement in the vertical direction (up and down movement of the whole horse) and lateral-190
lateral direction (side to the side movement of the whole horse) at the withers, T13, T18 and L3 191
and the asymmetry of the two oscillations of the thoracolumbar movement during a stride 192
(asymmetry) based on the symmetry index (SI) were considered. SI is always calculated as the 193
movement amplitude of the first half of the stride (LH right forelimb, RF; diagonal stance phase) 194
minus the movement amplitude of the second half of the stride (RH and left forelimb, LF; 195
diagonal stance phase) and then normalised by dividing by the range of motion and 1 is added. 196
197
SI = ([Amplitude up1–Amplitude up2]/maximum[amplitude up1; up2]+1, 198
199
where maximum [amplitude up1; up2] is the maximum of the two (Starke et al. 2012). 200
Guidelines are SI < 0.83 is left hindlimb lameness and SI > 1.17 is right hindlimb lameness 201
(Starke et al. 2012), however, this has not been verified scientifically. Asymmetry was defined as 202
the absolute value of (1-SI) x 100%. In addition, the differences between the two peaks 203
(maxima) [MaxDiff] and two troughs (minima) [MinDiff] of the vertical movement signal were 204
measured. SI<1, MinDiff<0 and MaxDiff>0 indicates left-sided asymmetry. SI>1, MinDiff>0 205
and MaxDiff<0 indicates right-sided asymmetry. Non-directional asymmetry measures were 206
determined by taking the absolute value of the directional asymmetry measures. 207
208
Based on our hypothesis that the thoracolumbar movement symmetry will show a linear 210
association with the hindlimb symmetry, we planned a study in which regression analysis would 211
be performed for the non-directional T13 asymmetry against hindlimb asymmetry (measured as 212
HHD) for pooled data acquired in straight lines in hand and lunging. Pilot data from three horses 213
indicate that the standard deviation (SD) of HHD for all conditions pooled together was 14.1 mm 214
and the SD of the regression errors was 0.93 and the slope was -0.4. Based on this pilot data, a 215
sample size of three horses is enough to be able to reject the null hypothesis that this slope equals 216
zero with probability (power) 0.8. The Type I error probability associated with this test of this 217
null hypothesis is 0.05. 218
219
Statistical analysis 220
Descriptive analysis was carried out for outcome variables for straight lines in hand and 221
lunging. Mixed effect models were used to assess the relationship between symmetry of the 222
thoracolumbar movement amplitude between the first and second halves of the stride, surface and 223
the hindlimb gait measured as HHD, MinDiff, MaxDiff. All analyses were adjusted for the 224
clustering effect of horse. Those variables that were statistically significant at P < 0.20 were put 225
forward for inclusion in a multivariable, mixed-effects linear model. Biologically meaningful 226
interaction terms for all variables retained in the final model were assessed. Final model results 227
were reported as parameter estimates and P-values. All statistical analyses were performed using 228
SPSS Statistics 20 (SPSS), with significance set at P < 0.05. 229
230
Results 231
comprised 10 geldings, one stallion and three mares. Horses were used for dressage (n = 12) and 233
show jumping (n = 2). Breeds represented were Warmbloods (n = 12) and ponies (n = 2). 234
Bodyweights ranged from 400 to 630 kg (mean, 564 kg; median, 590 kg) and in height from 1.48 235
to 1.74 m (mean, 1.66 m; median, 1.69 m). 236
237
Quantification of thoracolumbar movement 238
The means standard errors for the outcome variables are shown in Table 1. 239
240
Straight lines 241
The dorsoventral (z) displacement had two peaks per stride and exhibited a sinusoidal 242
pattern with two almost symmetrical oscillations in straight lines. The amplitude of movement in 243
straight lines was greatest at T13, with less movement amplitude cranially (withers) and caudally 244
(L3; Fig. 1a). The dorsoventral ROM of movement ranged from 75˗125 mm for the withers, 245
94˗138 mm at T13, 92˗134 mm at T18 and 76˗122 mm at L3. In contrast displacement in a 246
lateral (y) direction had only one peak and one trough per stride. The ranges of displacement 247
were 18˗88 mm for the withers, 14˗53 mm at T13, 17˗50 mm at T18 and 19˗81 mm at L3. 248
Flexion-extension ROM was smaller than axial rotation ROM for all the sensor locations (Fig. 249
1c˗d). Flexion-extension ROM and axial rotation ROM were greatest towards the withers. The 250
axial rotation ROM ranged from 13˗28 for the withers, 5˗14 at T13, 5˗16 at T18 and 7˗19 at 251
L3 (Fig. 1c). The flexion-extension ROM ranged from 4˗11 for the withers, 3˗5 at T13, 2˗7 at 252
T18 and 4˗7 at L3 (Fig. 1d). The lateral bending ranged from 6-11 for the withers, 3-6 at T13, 253
3-8 at T18 and 3-8 at L3. In straight lines, there were small asymmetries in the dorsoventral 254
and slightly less symmetry cranially and caudally (withers, T18 and L3 up to 94 ± 6%; Fig. 2a). 256
The mean ± SD (range) in straight lines of the absolute pelvis MinDiff was 4.9 ± 5.3 mm (0 mm, 257
18 mm), pelvis MaxDiff was 3.5 ± 3.5 mm (0 mm, 14 mm) and HHD was 6.1 ± 5.9 mm (0 mm, 258
17 mm; Fig. 2b). 259
260
Differences between straight lines and circles
261
Circles induced significantly greater flexion-extension ROM (mean 5.3) compared with 262
straight lines (mean 4.0) for T13 (P < 0.001), for T18 (mean circles 5.1 vs. straight lines 4.0; 263
P = 0.002) and for L3 (mean circles 7.1 vs. straight lines 5.3; P = 0.001; Fig. 1d). Circles also 264
induced significantly greater lateral bending (mean 29) compared with straight lines (mean 8) 265
for withers (P < 0.001), for T13 (mean circles 29 vs. straight lines 5; P < 0.001), for T18 (mean 266
circles 28 vs. straight lines 5; P < 0.001) and for L3 (mean circles 29 vs. straight lines 5; P < 267
0.001). There were no differences in axial rotation ROM for any sensor location between circles 268
and straight lines (Fig. 1c). The displacements in a lateral (y) direction were significantly greater 269
on the lunge for T13 (mean 46 mm) compared with straight lines (mean 30 mm; P < 0.001) and 270
for T18 on the lunge (mean 48 mm) compared with straight lines (mean 36 mm; P = 0.002; Fig. 271
1b). Circles did not induce any significantly different amplitude of dorsoventral displacement 272
compared with straight lines when considering the mean of the two oscillations during outside 273
and inside hindlimb stance (Fig. 1a). However, in comparison with straight lines circles did 274
induce significantly greater amplitude of the dorsoventral movement of T13, T18 and L3 during 275
the outside hindlimb stance compared with the inside hindlimb stance (P = 0.03; Fig. 2a). There 276
was a greater maximum displacement of T13 and T18 (Fig. 3b) after outside hindlimb stance 277
hindlimb stance compared with the outside hindlimb stance (P = 0.009; Fig. 3a). The withers 279
dropped less during the inside forelimb stance compared with the outside forelimb stance and 280
reached a higher displacement just after the inside forelimb stance compared with just after the 281
outside forelimb stance (P = 0.003). The tubera sacraledropped less during the inside hindlimb 282
stance compared with the outside hindlimb stance in circles compared with straight lines (P < 283
0.001) mimicking a mild inside hindlimb lameness. Circles also induced a hip hike mimicking an 284
inside hindlimb lameness compared with straight lines (P < 0.001), means on circles the inside 285
tuber coxae had a greater amplitude of movement compared with the outside tuber coxae during 286
the outside hindlimb stance (HHD). However, the mean difference in the maximum displacement 287
of the tubera sacrale between left and right hindlimb stance was not significantly different 288
between circles and straight lines (P = 0.2; Fig. 2b). 289
290
Differences between left and right reins when moving in circles
291
There were no significant differences between the side-corrected means of MinDiff or 292
MaxDiff or the means of flexion-extension ROM, axial rotation ROM, dorsoventral or lateral 293
displacement of the thoracolumbar region between the left and right reins when moving on the 294
lunge. The side-corrected pelvic MaxDiff mean ± SD on the right and left reins were 3 ± 5 mm 295
and 3 ± 8 mm, respectively. The side-corrected pelvic MinDiff on the right and left reins were 15 296
± 11 mm and 14 ± 10 mm, respectively. The symmetry index on the right and left reins were 297
0.87 ± 0.07 mm and 0.90 ± 0.08 mm, respectively. None of these symmetry parameters on the 298
left and right reins were significantly different from each other. However, the mean ± SD of 299
HHD on the right rein (21 ± 11 mm) was significantly different from HHD on the left rein (12 ± 300
with the left rein for tubera sacrale (mean ± SD right rein 31 ± 7 vs. left rein 26 ± 3; P = 302
0.04), for T18 (right rein 31 ± 7 vs. left rein 26 ± 4; P = 0.02) and the withers (right rein 32 303
± 7 vs. left rein 26 ± 7; P = 0.004). The data from all the horses is provided in supplementary 304
information (Appendix A). 305
306
All the horses were divided into three symmetry categories for each thoracolumbar region 307
based on the symmetry in straight lines in-hand. Horses with larger movement amplitude during 308
LH-RF stance compared with RH-LF stance in straight lines had even greater asymmetry on 309
circles on the right rein compared with symmetrical horses. Similarly horses with larger 310
movement amplitude during RH-LF stance in straight lines compared with LH-RF stance had 311
even greater asymmetry on circles to the left compared with symmetrical horses (Fig. 4). 312
313
Association of thoracolumbar movement with pelvic symmetry
314
Looking at both straight lines and circles there was a linear association between the 315
differences in the upward movement amplitude of the thoracolumbar region (T13, T18, L3) 316
during the LH stance compared with the RH stance and the difference in the upward movement 317
amplitude of the pelvis (tubera sacrale) during the LH stance compared with the RH stance. So 318
for example, if the pelvis had less movement amplitude during the RH stance (either by dropping 319
less [MinDiff] or less upward movement [MaxDiff]) compared with the LH stance, the 320
thoracolumbar region also exhibited less upward movement amplitude during the RH stance 321
compared with the LH stance. The thoracic region was mostly sensitive to the dropping of the 322
pelvis (MinDiff) rather than upward movement of the pelvis (MaxDiff), whereas the lumbar 323
rather than dropping of the pelvis (MinDiff). Ten mm difference in the MaxDiff of both 325
hindlimbs caused 12% greater asymmetry between the first and second halves of the movement 326
amplitudes of L3 (Table 2). There was no influence of surfaces. 327
328
The maximum and minimum displacements of T13 were linearly associated with HHD, 329
pelvic MinDiff and pelvic MaxDiff. On a circle, alteration in HHD resulted in up to six times 330
more change in the movement of T13 compared with comparable alterations in magnitude of 331
either pelvic MinDiff and pelvic MaxDiff. 332
333
Comparing straight lines with circles, the changes in HHD best reflected changes in 334
thoracolumbar upward movement symmetry between the left and right halves of the stride (Table 335
3). There was also a strong relationship between movement of the tubera sacrale and the 336
thoracolumbar region. The tubera sacraledropped less during the inside hindlimb stance 337
compared with the outside hindlimb stance in circles, with both the lumbar and caudal thoracic 338
regions (L3 and T18) following an identical pattern, Figs. 5a, b. However, the mid and cranial 339
thoracic regions (T13 and withers) exhibited the opposite pattern, Fig. 6a, b. For example, on the 340
left rein the pelvis, lumbar and caudal thoracic regions drop more during the RH stance (outside 341
hindlimb) compared with LH stance (inside hindlimb, i.e., positive MinDiff), and the mid- and 342
cranial thoracic regions drop more during the LH (inside hindlimb) stance compared with the RH 343
(outside hindlimb) stance (i.e., negative MinDiff). 344
345
Discussion 346
gait, with the exception of HHD, in sound horses. The hypothesis that left and right asymmetries 349
in the thoracolumbar amplitudes between the first and second halves of the stride are associated 350
with left and right asymmetries in the hindlimb gait was also supported by our findings. The 351
method used for measuring thoracolumbar movement and the hindlimb gait provided an objective 352
means of investigating the relationship between hindlimb and thoracolumbar kinematics. Several 353
studies have described limb kinematics in trot, which is a two beat, symmetrical, diagonal gait 354
with two periods of suspension per stride cycle (Hildebrand 1965, Back et al., 1995a,b), but there 355
are only a few studies which have used biomechanical methods to study the influence of hindlimb 356
gait on the movement of the thoracolumbar region (Faber, 2001, Gómez Álvarez et al., 2007, 357
2008). 358
359
Consistent with previous studies (Audigié et al., 1999; Buchner et al., 2000; Faber et al., 360
2000, 2001, 2002, Warner et al., 2010), there was a double sinusoidal pattern for dorsoventral 361
displacement of the thoracolumbosacral region and a sinusoidal pattern for lateral-lateral 362
displacement for each stride. There were large ranges in angular movement (up to 19°), except at 363
the withers, which showed up to 28° for axial rotation. This represents only ± 14°, which is quite 364
small when considering that the withers area is less ‘rigid’ than other sites at which 365
measurements were acquired. There were also large ranges in dorsoventral (75˗128 mm) and 366
lateral (18˗88 mm) amplitudes of movement among the horses included in the study, 367
emphasising that even within normal sound horses there is considerable variation in 368
thoracolumbosacral movement. The range of movement was slightly more in circles (up to 80 369
mm) compared with straight lines (up to 70 mm). There were considerably smaller ranges of 370
movement, respectively (Warner et al., 2010). This probably reflects the different study 372
populations: ponies vs. sports horses and here the use of animals that have undergone a 373
comprehensive lameness examination including flexion tests. The inclusion of horses with 374
lameness may affect the rotational thoracolumbosacral ROM and symmetry of motion (Greve L., 375
Dyson S., Pfau T. Unpublished data). We made no attempt to scale the data between different 376
sizes of horses, but this merits further investigation. In Franches-Montagnes stallions there was a 377
similar magnitude of movement as in the current study for movement in the dorsoventral 378
direction (mean ± SD, 97 ± 9 mm) and for the movement in the lateral direction at the level of 379
the 12th thoracic vertebra (35 ± 10 mm; Heim et al., 2015). In the current study the greatest range 380
of dorsoventral displacement was found at T13 (94˗138 mm), which is closely related to the 381
movement of the body centre of mass (Buchner et al., 2000). It has been previously demonstrated 382
that horses with hindlimb lameness and a convex shape at the level of T18 or T13 had a higher 383
risk of saddle slip than horses with other thoracolumbar shapes (Greve and Dyson, 2013, 2014). 384
This may reflect that the maximal range of vertical displacement and the greatest difference in 385
maximum and minimum heights between left and right halves of the stride occurs at T13, where 386
the equine body centre of mass is aligned with the rider’s centre of mass (Buchner et al., 2000). 387
In addition, in the current study the circle-induced differences in the minimum height of T13 388
during the left and right hindlimb stance phases showed an opposite pattern compared with T18 389
and L3, indicating that sound horses alter the movement of the mid thoracic region in circles 390
differently to the caudal thoracic and lumbar regions. This means that for example on the left 391
circle where the pelvis shows a higher maximum displacement during inside (left) hind limb 392
stance, potentially a sign of reduced weight bearing with the inside hindlimb, the mid thoracic 393
(left) forelimb stance, potentially a sign of reduced weight bearing with the inside forelimb. 395
Forces in forelimbs and hindlimbs have been correlated with head MinDiff (Keegan et al., 2012) 396
and pelvic MinDiff (Bell et al., 2016), respectively, for lame horses trotting in straight lines, but 397
there is no similar data relating pelvis movement to limb forces during movement in circles for 398
either sound or lame horses. The pattern observed would be consistent with an ipsilateral 399
compensatory movement, which has been reported previously in induced hindlimb lameness on 400
the lunge (Rhodin et al., 2013). In the present study, we observed that the symmetry of the 401
thoracolumbar movement was reduced in circles compared with straight lines for all sensor 402
locations, with greater amplitude of the dorsoventral movement during the outside hindlimb 403
stance in comparison with the inside hindlimb stance. This may explain why a saddle normally 404
moves slightly more in circles compared with straight lines (Bystrom et al., 2009), and why 405
saddle slip in horses with hindlimb lameness is usually worse in circles compared with straight 406
lines (Greve and Dyson, 2013, 2014). 407
408
We observed that circles induced mild asymmetry of the movement of the pelvis in sound 409
horses mimicking subtle inside hindlimb lameness, consistent with the results of other studies 410
(Starke et al. 2012; Rhodin et al. 2013, 2016, Halling Thomsen et al. 2014). The circle-induced 411
asymmetry in thoracolumbar and pelvis movement were significantly associated. The maximum 412
and minimum displacements of T13 were linearly associated with HHD, pelvic MinDiff and 413
pelvic MaxDiff. On a circle, alteration in HHD resulted in up to six times more change in the 414
movement of T13 compared with comparable alterations in magnitude of either pelvic MinDiff 415
and pelvic MaxDiff. When measuring pelvic movement symmetry parameters (MinDiff, 416
lameness, the most sensitive and consistent changes were observed in HHD (Pfau et al. 2014). 418
419
Differences in the maximum displacement of the tubera sacrale just after the left and right 420
hindlimb stance had the biggest influence on the movement of L3. Movement of the lumbar 421
vertebral column is controlled by both the hypaxial and epaxial muscles. The hypaxial lumbar 422
muscles function as flexors of the coxofemoral joint, the lumbosacral junction and provide 423
stability to the 424
lumbosacral region (Sisson 1975; Clayton 2012; van Weeren 2014) and may contribute to the 425
engagement of the hindlimbs (meaning that the lumbosacral joint is flexed and the hindlimbs are 426
protracted under the body; Dyson, 2016;1), but their exact function has not yet been investigated. 427
The epaxial muscles act as extensor muscles. It is a common clinical observation that many 428
horses with hindlimb lameness exhibit epaxial muscle soreness and hypertonicity in the lumbar 429
region (Landman et al., 2004; Zimmerman et al., 2011), although the pathophysiology of muscle 430
pain and the association with limb movement and lameness are not well understood. In the 431
present study, the kinematics of the hindlimbs and the thoracolumbar regions were closely 432
linked. It has also been observed that lameness can induce thoracolumbar stiffness and limited 433
hindlimb impulsion, or a restricted gait in all limbs (Dyson, 2016) and that primary 434
thoracolumbar pain can induce similar symptoms (Girodroux et al., 2009). Based on the results 435
of the current study it is important to be able to detect lameness at an early stage to avoid 436
increased asymmetry of thoracolumbosacral movement which might induce additional pain. 437
438
1
See: FEI Dressage Rules, 2016.
Moving on a circle induced a symmetrical asymmetry between left and right reins in the 439
movement of the thoracolumbar region and the pelvic MaxDiff, MinDiff, but not a symmetrical 440
asymmetry in HHD between reins compared with trotting in hand in straight lines in horses 441
selected based on a comprehensive lameness examination by an expert. The difference in HHD 442
may be the result of the circle size and shape not being absolutely identical on the left and right 443
reins. It could also reflect functional motor laterality (the preference of one side of the body or 444
limb compared with the other) in some horses (McGreevy and Rogers 2005; McGreevy and 445
Thomson 2006; van Heel et al. 2006, 2011; Abrams and Panaggio 2012). 446
447
This study had some limitations. The measurements were obtained on a soft arena 448
surface and therefore do not represent movement symmetry data on a hard surface or on a 449
different type of arena surface. Data collection was limited to upper body landmarks and did not 450
provide detailed quantification of spatiotemporal limb movement parameters or limb angles, 451
which have been reported (Clayton et al., 2006, Hobbs et al., 2011), however it can be argued 452
based on the principle of Newtonian mechanics that upper body movement asymmetry is closely 453
linked to force production on the ground (Pfau et al., 2016). Preliminary data from six horses 454
demonstrated that foot placement relative to body position and line of travel did not differ 455
markedly between straight lines and circles and cannot solely account for the observed upper 456
body movement asymmetry (Starke et al., 2014). More detailed studies with a larger number of 457
horses and simultaneous measurement of limb forces would complement the understanding of 458
circular movement mechanics. The results of the current study relate mainly to dressage horses 459
and further studies are required to determine if similar results would be obtained with horses 460
462
Conclusions 463
The results of this study have increased our understanding of thoracolumbar movement in 464
sound sports horses, determined the difference between straight lines and lunging exercise and 465
described the effect of left and right reins. Moving on a circle induces measurable changes in 466
thoracolumbar movement compared with moving in straight lines, associated with alterations in 467
the hindlimb gait. Development and determination of objective thoracolumbar movement 468
parameters and establishing the association with the hindlimb gait for sound horses is important 469
to be able to distinguish normal from abnormal and to be able to use the parameters in future 470
lameness investigations. 471
472
Conflict of interest statement 473
None of the authors of this paper has a financial or personal relationship with other people 474
or organisations that could inappropriately influence or bias the content of the paper. 475
476
Acknowledgements 477
We thank Ruby Yu-Mei Chang for statistical advice and the many horses and their 478
owners who participated in the study. 479
480
Supplementary material 481
Supplementary data associated with this article can be found, in the online version, at doi: 482
… 483
References 485
Abrams, D. M., Panaggio, M.J., 2012. A model balancing cooperation and competition can 486
explain our right-handed world and the dominance of left-handed athletes. Journal of the Royal 487
Society Interface 9, 2718-2722. 488
489
Audigié, F., Pourcelot, P., Degueurce, C., Denoix, J.M., Geiger, D., 1999. Kinematics of the 490
equine back: Flexion–extension movements in sound trotting horses. Equine Veterinary Journal 491
31, 210–213. 492
493
Back, W., Schamhardt, H. C., Savelberg, H. H., van den Bogert, A. J., Bruin, G., Hartman, W., 494
Barneveld, A., 1995a. How the horse moves: 1. Significance of graphical representations of 495
equine forelimb kinematics Equine Veterinary Journal 27, 31˗8. 496
497
Back, W., Schamhardt, H. C., Savelberg, H. H., van den Bogert, A. J., Bruin, G., Hartman, 498
W.Barneveld, A., 1995b. How the horse moves: 2. Significance of graphical representations of 499
equine hind limb kinematics Equine Veterinary Journal 27, 39-45 500
501
Bell, R.P., Reed, S.K., Schoonover, M.J., Whitfield, C.T., Yonezawa, Y., Maki, H., Pai, P.F., 502
Keegan, K.G., 2016. Associations of force plate and body-mounted inertial sensor measurements 503
for identification of hind limb lameness in horses. American Journal of Veterinary Research 77, 504
337-345 505
506
Buchner, H.H.F., Savelberg, H.H.C.M., Schamhardt, H.C., Barneveld, A., 1996. Head and trunk 507
movement adaptations in horses with experimentally induced fore or hind limb lameness. Equine 508
Veterinary Journal 28, 71–76. 509
510
Buchner, H.H.F. Ohermuller. Scheidl, M., 2000. Body centre of mass involvement in the sound 511
horse. The Veterinary Journal160, 225-234. 512
513
Bystrom, A., Rhodin, M., von Peinen, K., Weishaupt, M.A., Roepstorff, L., 2009. Basic 514
kinematics of the saddle and rider in high-level dressage horses trotting on a treadmill. Equine 515
Veterinary Journal 41, 280–284. 516
517
Clayton, H.M., Sha D.H., 2006. Head and body centre of mass movement in horses trotting on a 518
circular path. Equine Veterinary Journal 38, (Suppl 36), 462-467. 519
520
Clayton, H. M. 2012. Equine back pain reviewed from a motor control perspective. Comparative 521
Exercise Physiology, 8, 145-152. 522
523
Dyson, S., 2011. Can lameness be reliably graded? Equine Veterinary Journal 43, 379-382. 524
525
Dyson, S., 2016. Evaluation of poor performance in competition horses: a musculoskeletal 526
perspective. Part 1 Clinical assessment. Equine Veterinary Education 28, 284-293. 527
528
Faber, M., Schamhardt, H., Weeren, R. van, Johnston, C., Roepstorff, L., Barneveldt, A., 2000. 529
American Journal of Veterinary Research 61, 399-406. 531
532
Faber, M., Johnston, C., Schamhardt, H.C., Weeren, P.R. van, Roepstorff, L., Barneveldt, A., 533
2001a. Threedimensional kinematics of the equine spine during canter. Equine Veterinary 534
Journal 33, 145-149. 535
536
Faber, M., Johnston, C., Schamhardt, H.C., Weeren, P.R. van, Roepstorff, L., Barneveldt, A., 537
2001b. Basic three dimensional kinematics of the vertebral column of horses trotting on a 538
treadmill. American Journal of Veterinary Research 62, 757-764. 539
540
Faber, M., Johnston, C., Weeren, P.R. van, Barneveldt, A., 2002. Repeatability of back 541
kinematics in horses during treadmill locomotion. Equine Veterinary Journal 34, 235-241. 542
543
Girodroux, M., Dyson, S., Murray, R., 2009. Osteoarthritis of the thoracolumbar synovial 544
intervertebral articulations: clinical and radiographic features in 77 horses with poor performance 545
and back pain. Equine Veterinary Journal 41, 130-138. 546
547
Gómez Álvarez, C.B., Wennerstrand, J., Bobbert, M.F., Lamers, L., Johnston, C., Back, W., van 548
Weeren, P.R., 2007. The effect of induced forelimb lameness on thoracolumbar kinematics 549
during treadmill locomotion. Equine Veterinary Journal 39, 197-201. 550
551
Gómez Álvarez, C.B., Wennerstrand, J., Bobbert, M.F., Lamers, L., Johnston, C., Back, W., van 552
Weeren, P.R., 2008. The effect of induced hindlimb lameness on thoracolumbar kinematics 553
during treadmill locomotion. Equine Veterinary Journal 40, 147-152. 554
555
Greve, L. Dyson, S., 2013. An investigation of the relationship between hindlimb lameness and 556
saddle-slip. Equine Veterinary Journal 45, 570-577. 557
558
Greve, L., Dyson, S., 2014. The interrelationship of lameness, saddle-slip and back shape in the 559
general sports horse population. Equine Veterinary Journal 46, 687-94 560
561
Greve, L., Dyson, S., 2015. A longitudinal study of back dimension changes over 1 year in sports 562
horses. The Veterinary Journal 203, 65-73 563
564
Halling Thomsen, M., Sahl-Tjørnholm, C., Sørensen, H., Tolver Jensen, A., 2014. Effect of 565
lungeing and circle size on movement symmetry in sound riding horses. Equine Veterinary 566
Journal 46, 49–50. 567
568
Heim, C., Pfau, T., Gerber, V., Schweizer, C., Doherr, M., Schüpbach-Regula, G., Witte, S., 569
2016. Determination of vertebral range of motion using inertial measurement units in 27 570
Franches-Montagnes stallions and comparison between conditions and with a mixed population. 571
Equine Veterinary Journal 48, 509-516. 572
573
Hildebrand, M., 1965. Symmetrical gaits in horses. Science 150, 701–708. 574
575
and cantering on a flat and banked 10 m circle. Equine Veterinary Journal 43, 686-694. 577
578
Jeffcott L. B., Dalin, G., 1980. Natural rigidity of the horses’ backbone. Equine Veterinary 579
Journal 12, 101-108. 580
581
Johnson, J.L., Moore-Colyer, M., 2009. The relationship between range of motion of 582
lumbosacral flexion-extension and canter velocity of horses on a treadmill. Equine Veterinary 583
Journal 41, 301-303. 584
585
Keegan, K.G., Pai, P.F., Wilson, D.A., Smith B. K., 2001. Signal decomposition method of 586
evaluating head movement to measure induced forelimb lameness in horses trotting on a 587
treadmill. Equine Veterinary Journal 33 (Suppl. 5), 446–451. 588
589
Keegan, K.G., MacAllister, C.G., Wilson, D. A., Gedon, C.A., Kramer, J., Yonezawa, Y., Maki, 590
H., 2012. Comparison of an inertial sensor system with a stationary force plate for evaluation of 591
horses with bilateral forelimb lameness. American Journal of Veterinary Research 73, 368-374. 592
593
Kramer, J., Keegan, K.G., Kelmer, G., Wilson, D.A. 2004. Objective determination of pelvic 594
movement during hind limb lameness and pelvic height differences. American Journal 595
Veterinary Research 65, 741-747. 596
597
Landman, M.A., de Blaauw, J.A., van Weeren, P.R., Hofland, L.J., (2004) Field study of the 598
prevalence of lameness in horses with back problems. Veterinary Record 155, 165-168. 599
600
Licka, T., Peham, C., Zohmann, E., 2001a. Range of back movement at trot in horses without 601
back pain. Equine Veterinary Journal 33 (Suppl. 33), 150-153. 602
603
Licka, T., Peham, C., Zohmann, E., 2001b. Treadmill study of the range of back movement at the 604
walk in horses without back pain. American Journal of Veterinary Research 62, 1173-1179. 605
606
May, S.A., Wyn-Jones, G., 1987. Identification of hindleg lameness. Equine Veterinary Journal 607
19, 185-188. 608
609
McGreevy, P.D., Rogers, L.J., 2005. Motor and sensory laterality in thoroughbred horses. 610
Applied Animal Behaviour Science 92, 337-352. 611
612
McGreevy, P.D., Thomson, P. C., 2006. Differences in motor laterality between breeds of 613
performance horse. Applied animal behaviour Science 99, 183-190. 614
615
Peham, C., Scheidl, M., Licka, T., 1996. A method of signal processing in motion analysis of the 616
trotting horse. Journal Biomechanics 29, 1111–1114. 617
618
Pfau, T., Witte, T.H., Wilson, A.M., 2005. A method for deriving displacement data during 619
cyclical movement using an inertial sensor. Journal Experimental Biology 208, 2503-2514. 620
621
radius on movement symmetry in horses during lungeing on a soft surface. American Journal of 623
Veterinary Research 73, 1890-1899. 624
625
Pfau, T., Spicer-Jenkins, C., Smith, R.K., Bolt, D.M., Fiske-Jackson, A., Witte, T.H., 2014. 626
Identifying optimal parameters for quantification of changes in pelvic movement symmetry as a 627
response to diagnostic analgesia in the hindlimbs of horses. Equine Veterinary Journal 46, 759-628
763. 629
630
Pfau, T., Fiske-Jackson, A., Rhodin, M. 2016. Quantitative assessment of gait parameters in 631
horses: Useful for aiding clinical decision making? Equine Veterinary Education, 28(4), 209-632
215. 633
634
Rhodin, M., Pfau, T., Roepstorff, L., Egenvall, A., 2013. Effect of lungeing on head and pelvic 635
movement asymmetry in horses with induced lameness. The Veterinary Journal 198, 39-45. 636
637
Rhodin, M., Roepstorff, L., French, A., Keegan, K. G., Pfau, T., Egenvall, A., 2016. Head and 638
pelvic movement asymmetry during lungeing in horses showing symmetrical movement on the 639
straight. Equine Veterinary Journal 48, 315-320. 640
641
Sisson, S., 1975. Equine myology. In Getty, R., eds., Sisson and Grossman’s Anatomy of 642
domestic animals, 5th Ed., Philadelphia, USA: Saunders (W.B.), 433-435. 643
644
Starke, S.D., Willems, E., May, S. Pfau, T., 2012. Vertical head and trunk movement adaptations 645
to sound horses trotting in a circle on a hard surface. The Veterinary Journal 193, 73-80. 646
647
Starke, S.D., Merritt, J.S., Stubbs, N., Pfau T., Clayton, H.M. 2014. Is foot placement related to 648
body movement asymmetry during circular locomotion? In: Proceedings of the Annual Meeting 649
of the International Conference on Equine Exercise Physiology. Chester, UK, p. 48-49 650
651
Townsend, H. G. G., Leach, D. H., Fretz, P. B. 1983. Kinematics of the equine thoracolumbar 652
spine. Equine Veterinary Journal 15, 117-122. 653
654
Uhlir, C., Licka, T., Kübber, P., Peham, C., Scheidl, M., Girtler, D., 1997. Compensatory 655
movements of horses with a stance phase lameness. Equine Veterinary Journal 29 (Suppl. 23), 656
102–105. 657
658
van Heel, M.C.V., Kroekenstoel, A.M., van Dierendonck, M.C., van Weeren, P.R., Back, W., 659
2006. Uneven feet in a foal may develop as a consequence of lateral grazing behaviour induced 660
by conformational traits. Equine Veterinary Journal 38, 646-651. 661
662
van Weeren, P.R. 2014. Kinematics of the equine back and pelvis. In Hodgson, D.R., McKeever, 663
K., McGowan C., eds., The Athletic Horse: Principles and Practices of Equine Sports Medicine. 664
2nd Ed., St Louis, USA: Elsevier, 282-292. 665
666
Warner, S.M., Koch, T.O., Pfau, T., 2010. Inertial sensors for assessment of back movement in 667
669
Wennerstrand, J., Johnston, C., Roethlisberger- Holm, K., Erichsen, C., Eksell, P., Drevemo, S., 670
2004. Kinematic evaluation of the back in the sport horse with back pain. Equine Veterinary 671
Journal 36, 707–711. 672
673
Wennerstrand, J., Gómez Alvarez, C.B., Meulenbelt, R., Johnston, C., van Weeren, P.R., 674
Roethlisberger-Holm, K., Drevemo, S., 2009. Spinal kinematics in horses with induced back 675
pain. Veterinary Comparative Orthopaedics and Traumatology 22, 448-454. 676
677
Zimmerman, M., Dyson, S., Murray, R., 2011. Close, impinging and overriding spinous 678
processes in the thoracolumbar spine: The relationship between radiological and scintigraphic 679
findings and clinical signs. Equine Veterinary Journal 44, 178-184. 680
Fig. 1. The dorsovental, lateral-lateral movements, axial rotation range of motion (ROM, ⁰) and 682
flexion-extension ROM (⁰) of the thoracolumbar region of 14 subjectively sound horses 683
examined moving in straight lines in hand and in circles on the lunge. White bars represent 684
straight lines. Dotted grey bars represent moving on a circle which is the data for the left and 685
right reins combined, because there was no significant difference between the two. (A) 686
Dorsoventral movement (mm) and (B) Lateral-lateral movement (mm). (C) Axial rotation and 687
(D) Flexion-extension. The displacements in a lateral (y) direction were significantly greater on 688
the lunge for T13 (mean 46 mm) compared with straight lines (mean 30 mm; P <0 .001) and for 689
T18 on the lunge (mean 48 mm) compared with straight lines (mean 36 mm; P = 0.002). Circles 690
induced significantly greater flexion-extension ROM (mean 5.3) compared with straight lines 691
(mean 4) for T13 (P < 0.001), for T18 (mean circles 5.1 vs. straight lines 4; P = 0.002) and for 692
L3 (mean circles 7.1 vs. straight lines 5.3P = 0.001). Circles did not induce any significantly 693
different dorsoventral displacement or axial rotation ROM (⁰) compared with straight lines. 694
Boxes are marked as follows: line, median; box, 25th and 75th percentiles; whiskers, maxima 695
and minima; * significantly greater movement in circles than in straight lines. 696
697
Fig. 2. The non-directional asymmetry of the first and second halves of the stride for the 698
thoracolumbar region and the hindlimbs of 14 subjectively sound horses examined moving in 699
straight lines in hand and in circles on the lunge. White bars represent straight lines. Dotted grey 700
bars represent moving on a circle which is the data for the left and right reins combined, because 701
there was no significant difference between the two. (A) The asymmetry is calculated as the 702
movement amplitude of the first half of the stride (left hindlimb-right forelimb diagonal stance 703
left forelimb diagonal stance phase; RH-LF) and then normalised by dividing with range of 705
motion and expressed as a percentage on the y-axis. Circles compared with straight lines induced 706
a significantly greater amplitude of the dorsoventral movement of T13, T18 and L3 during the 707
outside hindlimb stance compared with the inside hindlimb stance (P = 0.03)*. (B) HipHike 708
difference (HHD) quantifies the difference in the movement amplitude of the tubera coxae 709
during contralateral hindlimb stance. On circles the outside hindlimb bore more weight during 710
the stance phase compared with the inside hindlimb (MinDiff), mimicking mild inside hindlimb 711
lameness. There were significantly greater mean differences in weight bearing between each 712
hindlimb (MinDiff 16 mm) and mean differences in upward movement of the tubera coxae 713
during the contralateral stance phase (HHD 18 mm) on the lunge compared with straight lines 714
(MinDiff 5 mm and HHD 6 mm; P < 0.001)*. However, the mean difference in hindlimb push 715
off was not significantly different between circles and straight lines (lunge 4 mm vs. straight 716
lines 6 mm; P = 0.2). 717
718
Fig. 3. The non-directional maximum difference (MaxDiff) and minimum difference (MinDiff) 719
of the thoracolumbar region of 14 subjectively sound horses examined moving in straight lines in 720
hand and in circles on the lunge. White bars represent straight lines. Dotted grey bars represents 721
moving on a circle which is the data for the left and right reins combined, because there was no 722
significant difference between the two. (A) MinDiff and (B) MaxDiff quantify the differences in 723
minimum and maximum displacement of the different sensor locations reached during and after 724
the two stance phases (Starke et al., 2012). Circles induced a greater maximum displacement of 725
withers, T13 and T18 and minimum displacement of the withers during the outside hindlimb 726
was greater during the inside hindlimb stance in comparison with the outside hindlimb stance (P 728
= 0.009)**. 729
730
Fig. 4. The symmetry of the first and second halves of the stride for the withers, T13, T18 and L3 731
of 14 subjectively sound horses divided into three symmetry categories based on the symmetry in 732
straight lines in hand. The symmetry index is calculated as the movement amplitude of the first 733
half of the stride (left hindlimb-right forelimb diagonal stance phase; LH-RF) minus movement 734
amplitude of the second half of the stride (right hindlimb-left forelimb diagonal stance phase; 735
RH-LF) and then normalised by dividing with range of motion. Symmetry index < 1 indicates 736
less movement amplitude in the first half of the stride, whereas a symmetry index > 1 indicates 737
less movement amplitude in the second half of stride. The white bars represent horses with 738
symmetry index < 0.98 in straight lines (less movement amplitude in the first half of the stride; 739
LH-RF diagonal stance phase). The grey bars represent horses with symmetry index > 1.02 740
straight lines (Greater movement amplitude during second half of the stride; RH-LF diagonal 741
stance). The light grey bars represent horses with symmetry index = 1 ± 0.02 (equal movement 742
amplitude between first and second halves of the stride). Open circles indicates outliers. The 743
vertical black line at SI = 1 represents 100% symmetry. (A) the withers; (B) the thirteenth 744
thoracic vertebra (T13); (C) the eighteenth thoracic vertebra (T18); (D) the third lumbar vertebra 745
(L3). Horses with greater movement amplitude during LH-RF stance in straight lines (similar 746
pattern induced by right circles) had even greater asymmetry on circles on the right rein 747
compared with symmetrical horses. Similarly horses with greater movement amplitude during 748
RH-LF stance in straight lines (similar pattern induced by left circles) had even greater 749
751
Fig. 5. The association between the motion of the third lumbar (L3) vertebra and the eighteenth 752
thoracic vertebra (T18) and pelvic MinDiff. There was a linear association between pelvic 753
MinDiff and (a) L3 (r =0.93; P < 0.001) and (b) T18 (r = 0.58; P < 0.001) in a univariable 754
model. The tubera sacrale dropped less during the inside hindlimb stance compared with the 755
outside hindlimb stance in circles, with both the lumbar and caudal thoracic regions (L3 and 756
T18) following an identical pattern. 757
758
Fig. 6. The association between the motion of the thirteenth thoracic vertebra (T13) and the 759
withers and pelvic MinDiff. There was a linear association between pelvic MinDiff and (a) T13 760
(r = 0.38; P = 0.02) and (b) the withers (r = 0.82; P < 0.001) in a univariable model.The tubera 761
sacraledropped less during the inside hindlimb stance compared with the outside hindlimb 762
stance in circles, with both the lumbar and caudal thoracic regions (L3 and T18) following an 763
identical pattern. However, the mid and cranial thoracic regions (T13 and withers) exhibited the 764
opposite pattern. For example, on the right rein the pelvis, lumbar and caudal thoracic regions 765
dropped more during the outside hindlimb stance compared with inside hindlimb, and the mid- 766
and cranial thoracic regions dropped more during the inside hindlimb stance compared with the 767
outside hindlimb stance. 768
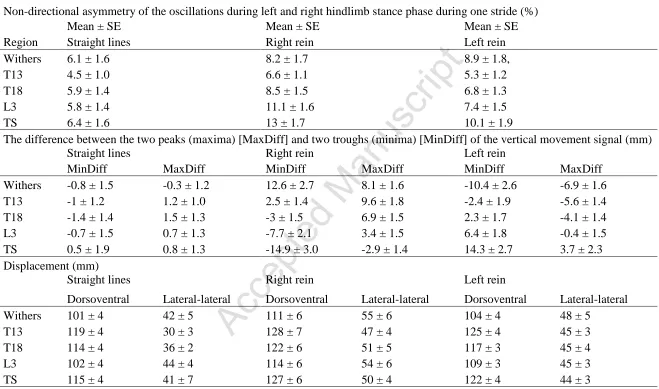
Table 1. The mean standard error (SE) for the non-directional symmetry of the left and right oscillations during one stride in 14 773
subjectively sound horses assessed trotting in straight lines and in circles on the lunge. 774
Non-directional asymmetry of the oscillations during left and right hindlimb stance phase during one stride (%)
Region
Mean ± SE Mean ± SE Mean ± SE
Straight lines Right rein Left rein
Withers 6.1 ± 1.6 8.2 ± 1.7 8.9 ± 1.8,
T13 4.5 ± 1.0 6.6 ± 1.1 5.3 ± 1.2
T18 5.9 ± 1.4 8.5 ± 1.5 6.8 ± 1.3
L3 5.8 ± 1.4 11.1 ± 1.6 7.4 ± 1.5
TS 6.4 ± 1.6 13 ± 1.7 10.1 ± 1.9
The difference between the two peaks (maxima) [MaxDiff] and two troughs (minima) [MinDiff] of the vertical movement signal (mm)
Straight lines Right rein Left rein
MinDiff MaxDiff MinDiff MaxDiff MinDiff MaxDiff
Withers -0.8 ± 1.5 -0.3 ± 1.2 12.6 ± 2.7 8.1 ± 1.6 -10.4 ± 2.6 -6.9 ± 1.6
T13 -1 ± 1.2 1.2 ± 1.0 2.5 ± 1.4 9.6 ± 1.8 -2.4 ± 1.9 -5.6 ± 1.4
T18 -1.4 ± 1.4 1.5 ± 1.3 -3 ± 1.5 6.9 ± 1.5 2.3 ± 1.7 -4.1 ± 1.4
L3 -0.7 ± 1.5 0.7 ± 1.3 -7.7 ± 2.1 3.4 ± 1.5 6.4 ± 1.8 -0.4 ± 1.5
TS 0.5 ± 1.9 0.8 ± 1.3 -14.9 ± 3.0 -2.9 ± 1.4 14.3 ± 2.7 3.7 ± 2.3
Displacement (mm)
Straight lines Right rein Left rein
Dorsoventral Lateral-lateral Dorsoventral Lateral-lateral Dorsoventral Lateral-lateral
Withers 101 ± 4 42 ± 5 111 ± 6 55 ± 6 104 ± 4 48 ± 5
T13 119 ± 4 30 ± 3 128 ± 7 47 ± 4 125 ± 4 45 ± 3
T18 114 ± 4 36 ± 2 122 ± 6 51 ± 5 117 ± 3 45 ± 4
L3 102 ± 4 44 ± 4 114 ± 6 54 ± 6 109 ± 3 45 ± 3
TS 115 ± 4 41 ± 7 127 ± 6 50 ± 4 122 ± 4 44 ± 3
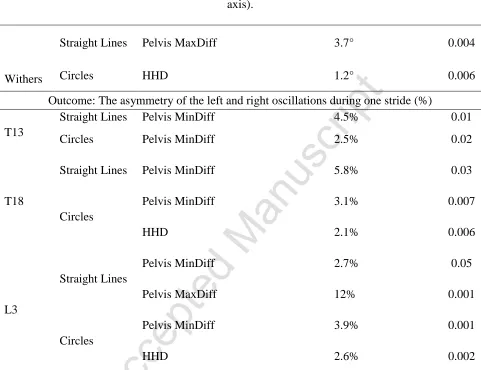
Table 2. Significant results of multivariable mixed effect linear regression analysis of the effects 776
of hindlimb gait on the thoracolumbar movement in a sound sample of the general sports horse 777
population (n = 14) in both straight lines and circles on the lunge. 778
Region Condition Hindlimb variable (10mm increase) Increase in outcome P
Outcome: Flexion-extension ROM in ° (the body rotation about the transverse [lateral-lateral] axis).
Withers
Straight Lines Pelvis MaxDiff 3.7° 0.004
Circles HHD 1.2° 0.006
Outcome: The asymmetry of the left and right oscillations during one stride (%)
T13
Straight Lines Pelvis MinDiff 4.5% 0.01
Circles Pelvis MinDiff 2.5% 0.02
T18
Straight Lines Pelvis MinDiff 5.8% 0.03
Circles
Pelvis MinDiff 3.1% 0.007
HHD 2.1% 0.006
L3
Straight Lines
Pelvis MinDiff 2.7% 0.05
Pelvis MaxDiff 12% 0.001
Circles
Pelvis MinDiff 3.9% 0.001
HHD 2.6% 0.002
MinDiff and MaxDiff, Differences in minimum and maximum displacement of the pelvis, 779
respectively; hiphike difference (HHD), defined as the difference in upward movement of each 780
tuber coxae during contralateral hindlimb stance; ROM, range of motion. 781
782
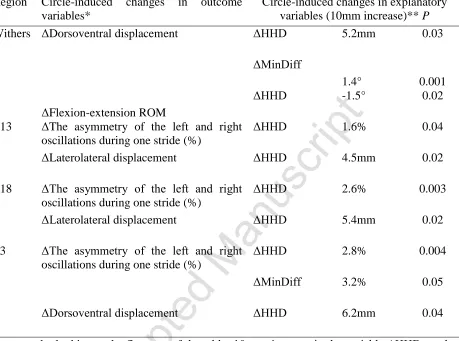
Table 3. Significant results of multivariable mixed effect linear regression analysis of the 784
association between hindlimb gait and thoracolumbar movement, when the outcomes* and 785
variables** used are found by subtracting the mean value for straight lines from the mean values 786
for circles in a sound sample of the general sports horse population (n = 14). 787
Region Circle-induced changes in outcome variables*
Circle-induced changes in explanatory variables (10mm increase)** P
Withers ΔDorsoventral displacement ΔHHD 5.2mm 0.03
ΔFlexion-extension ROM
ΔMinDiff
1.4° 0.001
ΔHHD -1.5° 0.02
T13 ΔThe asymmetry of the left and right oscillations during one stride (%)
ΔHHD 1.6% 0.04
ΔLaterolateral displacement ΔHHD 4.5mm 0.02
T18 ΔThe asymmetry of the left and right oscillations during one stride (%)
ΔHHD 2.6% 0.003
ΔLaterolateral displacement ΔHHD 5.4mm 0.02
L3 ΔThe asymmetry of the left and right oscillations during one stride (%)
ΔHHD 2.8% 0.004
ΔMinDiff 3.2% 0.05
ΔDorsoventral displacement ΔHHD 6.2mm 0.04
For example, looking at the first row of the table: 10 mm increase in the variable ΔHHD results 788
in 5.2 mm increase in the outcome ΔDorsoventral displacement (P = 0.03) of the withers. 789
Δ, The measured mean value for straight lines subtracted from the mean value for circles; 790
Flexion-extension ROM (range of motion), the body rotation about the transverse (lateral-lateral) 791
axis; MinDiff and MaxDiff, the differences in minimum and maximum displacement of the 792
pelvis, respectively; HHD, the difference in upward movement of each tuber coxae during 793
contralateral hindlimb stance. 794