Abstract
Investigations of visually-guided target-directed movement frequently adopt measures of within-participant spatial variability to infer the contribution of planning and control. The present study aims to verify this current trend by exploring the distribution of displacements at kinematic landmarks with a view to understanding the potential sources of variability. Separate sets of participants aiming under full visual feedback conditions revealed a
Introduction
Since the findings of endpoint variability in target-directed movements being scaled to the magnitude of response impulses (Schmidt, Zelaznik, Hawkins, Frank, & Quinn, 1979), eminent theories have placed a great emphasis on how it is performers cope with such circumstances and the associated trade-off between speed and accuracy (Fitts, 1954; Fitts & Peterson, 1964). Namely, Meyer and colleagues (Meyer, Abrams, Kornblum, Wright, & Smith, 1988) suggested primary movement endpoints assume a central tendency on or over the target centre so that the majority of aims can subtend the target boundaries. In the event of an initial error (synonymous with the tails of the endpoint distribution), the performer may issue a secondary corrective movement to eventually reach the target. Alternatively, it has been argued that while a normal distribution in the primary movement endpoints may
manifest, these movements tend to fall short of the target location (undershoot) so as to avoid a potential cost of moving beyond the target (overshoot) (Elliott, Hansen, Mendoza, & Tremblay, 2004). This ‘cost’ is reflected by the need of the performer to overcome inertia and switch the agonist-antagonist arrangement in order to reverse the limb’s location. However, when the endpoint variability begins to decline, and presumably subtend the target
boundaries, the performer may begin to undershoot less and effectively ‘creep-up’ on the target. This notion draws heavily on the findings that primary movement endpoints are heavily related to their frequency distribution (i.e., spatial variability) (see Lyons, Hansen, Hurding, & Elliott, 2006; Worringham, 1991).
components was reflected by a series of delayed discontinuities when aiming with a pencil between two targets on a rotating drum; so-long as there was an opportunity to use visual feedback within the movement (Woodworth, 1899). Following the advent of motion capture systems, there was an exciting possibility of more precisely corroborating Woodworth’s early findings by measuring the primary and secondary submovement components between
different feedback conditions (vision vs. no vision). However, despite the obvious advantages in endpoint accuracy for vision compared to no vision conditions, there was no such
difference in the nature or number of secondary submovements (e.g., Elliott, Carson, Goodman, & Chua, 1991).
Herein, the measures of endpoint dispersion that were previously mentioned were adapted for the assessment of within-participant standard deviation of earlier locations of the trajectory (see Khan et al. (2006) and Hansen, Elliott, & Khan (2008)); also referred to as
While the organisation and manifestation of submovement components based on endpoint variability is robust (Elliott et al., 2004; Worringham, 1991), it remains to be seen whether the same assumption of a normal trend in the response distribution unfolds at earlier kinematic landmarks (peak acceleration, peak velocity, peak deceleration). Indeed, implicit within the proposed value served by spatial variability is the notion that we may
correspondingly determine the effective limb location at various points within the trajectory (see Welford, 1968) – location of the limb that most likely subtends a select proportion of the responses (e.g., 34.13% = 1SD). For this inference to be so, the error that is incurred prior to ‘homing-in’ should be somewhat random or stochastic in nature and reflect a normal
distribution. However, it is also possible that the changes reported in spatial variability across kinematic landmarks may reflect a systematic alteration or planning error (van Beers, 2009). In other words, the current reference to spatial variability may not be fully indicative of limiting the negative effects of ‘noise’ through the refined parameterization and control of movement, but mere adaptation or exploratory behaviour (cf. Faisal, Selen, & Wolpert, 2008; van Beers, Haggard, & Wolpert, 2004). Afterall, there needs to be some degree of variability if performers are to learn in a novel sensorimotor environment over a series of trials (e.g., Shea & Morgan, 1979).
separate sets of participants. Providing the changes in spatial variability across the trajectory are the result of ‘random effects’ such as neuromotor noise, then we would anticipate a normal distribution of limb locations. Alternatively, a systematic alteration to the intended strategy or an error in planning for some of the movement attempts may be indicated by a degree of skewness. That is, variation in the trial-by-trial behaviour predominantly resulting from the performer actively adjusting the efferent output.
Method
Participants
Eleven participants were eligible to participate from the first study, and sixteen participants from the second study (age range = 18-30 years). All participants signed an informed consent form, and were self-declared right-handed, had normal or corrected-to-normal vision and free of any neurological condition. These studies were designed and conducted in accordance with the Declaration of Helsinki, and approved by the local ethics committee.
Apparatus, Task and Procedure
With regards the first data collection, stimuli were presented on a horizontally mounted monitor (66-cm diagonal; temporal resolution = 60 Hz; spatial resolution = 1024 x 768 pixels). The experiment was controlled via a custom written program in E-prime
Movements were captured courtesy of an infra-red marker that was attached to the right index finger and detected using an Optotrak 3020 system (Northern Digital Instruments, Waterloo, ON) recording at 200 Hz. These movements were executed under normal/low and high state anxiety situations, although we were only concerned with the normal/low anxiety set for which there were 30 trials. Participants were granted an initial 30 familiarisation/practice trials in advance of the experiment.
In a similar vein, the second set of data featured stimuli that were presented on a wall-mounted monitor (54-cm diagonal; temporal resolution = 85 Hz; spatial resolution = 1600 x 1200 pixels). The experiment was controlled by a custom-written program in Matlab (The Mathworks Inc., Natick, MA). The trial proceedings and task objectives were precisely the same as above, only stimuli and movements were made for a 16-cm amplitude along the mid-line of the body within the vertical extent (upward). These movements were executed
amongst a series of potential other movement trials (short and long amplitude, single- and two-segment movements, up and down directions), although the current focus is adopted for the sake of brevity and without conflating the principle objective of this study. There were 20 movement trials in the present study condition.
Data Processing and Analysis
Position data were filtered using a second-order, dual-pass Butterworth filter with a 10 Hz low-pass cut-off frequency. Data were differentiated and double-differentiated to obtain velocity and acceleration, respectively. Movement onset and offset were respectively defined as the moment velocity within the primary movement direction reached above and below 10 mm/s for 40 ms or more (>8 frames).
Displacement data at each kinematic landmark were extracted including, peak
order to quantify violations in the normality of the within-participant response distribution, the degree of skewness was calculated by converting displacement data into z3 scores. By taking the third moment, the z-scores were accentuated while retaining the direction with respect to the participant mean (i.e., position/negative). In addition, the difference between +1SD and -1SD of the within-participant mean position at kinematic landmarks was
calculated (standard deviation range) for comparison with the difference between 84.13th and 15.87th percentiles (median± 34.13%) (percentile range). These ranges were selected as they theoretically equate to 68.26% of the response distribution (-1SD = 15.87%, +1SD =
84.13%). Thus, a normal distribution that positively reflects the effective limb position should indicate an overlap between the ranges, although a violation should unveil differences between the two.
Movement trials featuring reaction times <100 ms or >1000 ms were considered anticipatory or non-reactive responses respectively, and removed from the analysis. In addition, movement times exceeding >800 ms were considered non-rapid target responses, and also removed prior to analysis. For the analysis of mean z3 scores, a one-way repeated-measures ANOVA (4 levels of kinematic landmark; PA, PV, PD, END) was initially conducted. In order to examine the extent of skewness, the mean z3 scores were compared with a theoretical value of 0 (representing mean displacement) using single-sample t-tests. Finally, for the analysis of ranges encompassing the response distribution, a 2 statistic (standard deviation, percentile) x 4 kinematic landmark (PA, PV, PD, END) repeated-measures ANOVA was conducted. Mauchly’s test of Spehericity was used to assess the variability of differences. In the event of a violation, the Huynh-Feldt value was adopted when epsilon was >.75, although the Greehouse-Geisser value was adopted if otherwise (original Sphericity-assumed degrees-of-freedom are reported). Partial eta-squared (ƞ2) was
were decomposed using Tukey HSD post hoc procedure. Significance was declared at p
< .05.
Results
Horizontal/Forward Movements
As a general account of the target-directed aims, the means of reaction time,
movement time and constant error were 363.57 ms (SD = 45.44), 466.75 ms (SD = 52.35) and -.53 mm (SD = .70), respectively. Thus, response distributions (see Figure 1), there was a notable positive and negative skew in peak acceleration and peak deceleration, respectively. However, the displacements at peak velocity and movement end reflected a comparatively normal distribution. Indeed, the one-way ANOVA on z3 scores revealed a significant main effect of kinematic landmark, F(3, 30) = 7.77, p < .05, partial ƞ2 = .44, which indicated
significantly more positive skew for the displacement at peak acceleration compared to peak velocity and peak deceleration (ps < .05). In addition, there was a significant difference between the skewness at peak acceleration (M = .79, SD = .79), t(10) = 3.32, p = .01, and peak deceleration (M = -.78, SD = .99), t(10) = 2.63, p = .03, compared to 0 (mean score). However, there was no significant difference observed for the displacements at peak velocity (M = -.17, SD = .95), t(10) = .59, p = .57, and movement end (M = .05, SD = .34), t(10) = .57,
p = .58.
Meanwhile, the factorial ANOVA on the ranges of the within-participant distributions revealed a significant main effect of statistic, F(1, 10) = 2.28, p < .05, partial ƞ2 = .19, as well
as kinematic landmark, F(3, 30) = 32.69, p < .05, partial ƞ2 = .77. In addition, there was a
significant statistic x kinematic landmark interaction, F(3, 30) = 32.42, p < .05, partial ƞ2
within-participant standard deviation compared to the percentile statistic at peak deceleration (p
< .05).1
[Insert Figure 1, Figure 2 and Table 1 about here]
Vertical/Upward Movements
To corroborate the findings from our first set of data, the second data reflected target-directed movements with a mean reaction time, movement time and constant error of 300.37 ms (SD = 23.84), 447.08 ms (SD = 43.45) and -.13 mm (SD = 2.43), respectively.
Once more, the within-participant response distributions reflected a degree of skewness in the acceleration domain; namely, at peak deceleration (see Figure 3). The one-way ANOVA revealed a significant main effect of kinematic landmark, F(3, 45) = 8.55, p
< .05, partial ƞ2 = .36, which indicated a significantly greater negative skew for displacement
at peak deceleration compared to peak acceleration and peak velocity (ps < .05). The single-sample t-test also confirmed a significant negative skew for the displacement at peak deceleration compared to a theoretical value of 0 (mean score) (M = -.81, SD = .68), t(15) = 4.80, p = .00, although there was no significant difference for peak acceleration (M = .32, SD
= .94), t(15) = 1.37, p = .19, peak velocity (M = .28, SD = .67), t(15) = 1.67, p = .12, and movement end (M = -.15, SD = .42), t(15) = 1.40, p = .18.
Meanwhile, the factorial ANOVA revealed a significant main effect of statistic, F(1, 15) = 814.06, p < .05, partial ƞ2 = .48, which indicated a larger range between standard
although no significant statistic x kinematic landmark interaction, F(3, 45) = 1.69, p > .05,
partial ƞ2 = .10.2
[Insert Figure 3, Figure 4 and Table 2 about here]
Discussion
Theoretical propositions surrounding target-directed movement contend that there is a normal distribution of endpoint responses, where variations from the mean are the result of stochastic properties (Elliott et al., 2004; Meyer et al., 1988). The present study adapted two sets of data in order to examine the trial-by-trial distribution of limb locations and the
associated descriptors at early and late phases of movement. The results indicated a degree of skewness within the acceleration domain. That is, there was some evidence of a positive skew at peak acceleration, although the evidence predominantly pointed to a negative skew at peak deceleration. These violations in normality were corroborated by a limited overlap between the parametric (standard deviation) and non-parametric (percentile) descriptors of the response distribution. In contrast, there seemed to be a normal distribution for the limb displacements at peak velocity and movement end.
To date, the majority of studies featuring the measure of spatial variability have assumed that differences in the standard deviation of limb locations at early (peak acceleration, peak velocity, peak deceleration) and late (movement end) stages of the
sensory feedback (Khan et al., 2003). While there has been no known study to precisely attribute the sources of this variability, we may have presently assumed that the within-participant variability was stochastic in nature, as per the matter of endpoint variability (Meyer et al., 1988) and the associated effective target width (Welford, 1968). Such trial-by-trial behaviour ought to generate a normal or Gaussian distribution of limb locations
throughout the entire trajectory. However, the present data indicate that this assumption is premature at best as there were marked violations in the normal distributions at certain kinematic landmarks (peak acceleration, peak deceleration). Because the skewness was isolated to only some, and not all the landmarks, while a removal criteria (<100 ms and >1000 ms in reaction times, >800 ms in movement times) was set in advance of the analysis, it is highly unlikely that these findings were the result of some unnoticed artefact or failed movement/s (for examples of trial outliers, see Grierson & Elliott (2008) and Grierson, Lyons, & Elliott (2011)).
On further assessment of the trend of the response distributions; namely, the negative skew at peak deceleration, it is possible that we can derive even more detail about these particular aiming movements as opposed to attributing mere random error. That is, the current trend may represent potential contamination of within-participant variability based on a voluntary parameter such as an attempt of the performer to prematurely engage in
deceleration. These rare instances may reflect an anomalous safe approach to the end target as an alternatively random or extended position to peak deceleration would be possibly associated with a normal and positively skewed distribution profile, respectively. This suggestion is consistent with the tenets of optimization as performers seek to avoid an
unanticipated positive shift in limb-velocity compared to other limb-velocity perturbations (Grierson et al., 2011). In a similar vein, the potential of incurring an even greater cost of an overshoot when aiming downwards (requiring corrections against gravity) coincides with a shortened displacement at peak deceleration prior to ‘homing-in’ (Roberts, Burkitt, Elliott, & Lyons, 2016).
With this in mind, it is not unreasonable to suggest that the negative skew at peak deceleration pertains to the generation of early exploratory or alternative behaviours with a view to learning (Elliott et al., 2004; van Beers, 2009; Wolpert & Flanagan, 2010). Indeed, it has been previously shown that performers encounter profound changes in their target-directed movements and subsequent learning following feedback of previous trial events (Burkitt, Staite, Yeung, Elliott, & Lyons, 2015; Cheng, Luis, & Tremblay, 2008; Khan & Franks, 2003). Presumably, performers seek to explore how fast they can aim before
accumulating an error (Rabbitt, 1981). In the event that the performer moves so fast that they almost miss or no longer subtend the target boundaries then they will limit their reach until variability is reduced (see Joseph, King, & Newell, 2013, for commentary on transitory learning phases).
Khan & Binsted, 2010, for examples of alternative moments of spatial variability). In order to positively attribute the sources of this variance, future investigations may seek to closely link single-trial events with ongoing (online; trial n) or subsequent (offline; trial n+1) target attempts in open- and closed-loop conditions. If the response distributions of kinematic landmarks are differentially sensitive to such manipulations then we can more strongly attribute these effects to systematic or intended sources of variance.
On a separate note, the reported differences between the ranges based on ±1SD and ±34.13th percentile, as well as the observed differences in within-participant means and medians (see Tables 1 and 2), continue to reflect the same form of variability profile (see Figures 2 and 4). That is, there was a systematic increase between peak acceleration and peak deceleration prior to a decline at the end of the movement. This form is deemed the
characteristic feature of online control as changes between conditions should be primarily determined by relative rather than absolute metrics (Allsop et al., 2016; Khan et al., 2003). Thus, the presently conceived use and inference of spatial variability can successfully encompass variations across kinematic landmarks, although there may be some issues when separately comparing different levels of an independent factor (e.g., vision vs. no vision) at individual kinematics landmarks.
At this juncture, we begin to recognise that the use of spatial variability to-date may indiscriminately consist of random (involuntary) and systematic (voluntary) sources of variance that are associated with stochastic properties and trial-by-trial adaptation,
variability, may be better-served by a non-parametric equivalent such as percentile ranges. Meanwhile, the potential inference of systematic variations within the trajectory (e.g., trial-by-trial adaptation) may be more appropriately represented by measures of skewness in the distribution of spatial locations.
In conclusion, while the current evidence does not refute the explanatory power of within-participant standard deviation as a measure of spatial variability, it does suggest that there is sufficient recourse to assess the distribution of limb locations; especially for
References
Allsop, J. E., Lawrence, G. P., Gray, R., & Khan, M. A. (2016). The interaction between practice and performance pressure on the planning and control of fast target directed movement. Psychological Research, 81(5), 1004-1019. doi:10.1007/s00426-016-0791-0.
Burkitt, J. J., Staite, V., Yeung, A., Elliott, D., & Lyons, J. L. (2015). Effector mass and trajectory optimization in the online regulation of goal-directed movement.
Experimental Brain Research, 233(4), 1097-1107. doi: 10.1007/s00221-014-4191-7
Cheng, D. T., Luis, M., & Tremblay, L. (2008). Randomizing visual feedback in manual aiming: reminiscence of the previous trial condition and prior knowledge of feedback availability. Experimental Brain Research, 189(4), 403-410. doi: 10.1007/s00221-008-1436-3
Cluff, T., Crevecoeur, F., Scott, S. H. (2015). A perspective on multisensory integration and rapid perturbation responses. Vision Research, 110, 215-222. doi:
10.1016/j.visres.2014.06.011
Desmurget, M. & Grafton, S. (2000). Forward modeling allows feedback control for fast reaching movements. Trends in Cognitive Sciences, 4, 423-431. doi: 10.1016/S1364-6613(00)01537-0
incorporate novel object dynamics. The Journal of Neuroscience, 35(29), 10572-10580. doi: 10.1523/JNEUROSCI.1376-15.2015
Elliott, D. Carson, R. G., Goodman, D. & Chua, R. (1991). Discrete vs. continuous visual control of manual aiming. Human Movement Science, 10, 393-418.
Elliott, D., Hansen, S., Mendoza, J., & Tremblay, L. (2004). Learning to optimize speed, accuracy, and energy expenditure: a framework for understanding speed-accuracy relations in goal-directed aiming. Journal Motor Behavior, 36(3), 339-351. doi: 10.3200/JMBR.36.3.339-351
Elliott, D., Helsen, W. F., & Chua, R. (2001). A century later: Woodworth's (1899) two-component model of goal-directed aiming. Psychological Bulletin, 127(3), 342-357. doi: 10.1037//0033-2909.127.3.342
Faisal, A. A., Selen, L. P. J., & Wolpert, D. M. (2008). Noise in the nervous system. Nature
Reviews Neuroscience, 9, 292-303.
Fitts, P. M. (1954). The information capacity of the human motor system in controlling the amplitude of movement. Journal of Experimental Psychology, 47(6), 381-391. doi: 10.1037/h0055392
Fitts, P. M., & Peterson, J. R. (1964). Information capacity of discrete motor responses.
Grierson, L. E. M. & Elliott, D. (2008). Kinematic analysis of goal-directed aims made against early and late perturbations: An investigation of the relative influence of two online control processes. Human Movement Sciences, 27(6), 839-856. doi:
10.1016/j.humov.2008.06.001
Grierson, L. E. M., Lyons, J., & Elliott, D. (2011). The impact of real and illusory
perturbations on the early trajectory adjustments of goal-directed movements. Journal
of Motor Behavior, 43(5), 383-391. doi: 10.1080/00222895.2011.606441
Hansen, S., Elliott, D., & Khan, M. A. (2008). Quantifying the variability of
three-dimensional aiming movements using ellipsoids. Motor Control, 12(3), 241-251. doi: 10.1123/mcj.12.3.241
Hansen, S., Tremblay, L., & Elliott, D. (2005). Part and whole practice: chunking and online control in the acquisition of a serial motor task. Research Quarterly for Exercise and
Sport, 76(1), 60-66. doi: 10.1080/02701367.2005.10599262
Kennedy, A., Bhattacharjee, A., Hansen, S., Reid, C., & Tremblay, L. (2015). Online vision as a function of real-time limb velocity: another case for optimal windows. Journal of
Motor Behavior, 47(6), 465-475. doi: 10.1080/00222895.2015.1012579
Khan, M. A. & Binsted, G. (2010). Visual field asymmetries in the control of target-directed movements. In D. Elliott & M. A. Khan (Eds.), Vision and goal-directed movement:
Khan, M. A., Elliott, D., Coull, J., Chua, R., & Lyons, J. (2002). Optimal control strategies under different feedback schedules: kinematic evidence. Journal of Motor Behavior, 34(1), 45-57. doi: 10.1080/00222890209601930
Khan, M. A. & Franks, I. M. (2003). Online versus offline processing of visual feedback in the production of component submovements. Journal of Motor Behavior, 335(3), 285-295. doi: 10.1080/00222890309602141
Khan, M. A., Franks, I. M., Elliott, D., Lawrence, G. P., Chua, R., Bernier, P., et al., 2006. Inferring online and offline processing of visual feedback in target-directed
movements from kinematic data. Neuroscience and Behavioral Reviews, 30, 1106-1121. doi: 10.1016/j.neubiorev.2006.05.002
Khan, M. A., Lawrence, G., Fourkas, A., Franks, I. M., Elliott, D., & Pembroke, S. (2003). Online versus offline processing of visual feedback in the control of movement amplitude. Acta Psychologica, 113(1), 83-97. doi: 10.1016/S0001-6918(02)00156-7
Lyons, J., Hansen, S., Hurding, S., & Elliott, D. (2006). Optimizing rapid aiming behaviour: Movement kinematics depend on the cost of corrective modifications. Experimental
Brain Research, 174(1), 95-100. doi:10.1007/s00221-006-0426-6
Meyer, D. E., Abrams, R. A., Kornblum, S., Wright, C. E., & Smith, J. E. (1988). Optimality in human motor performance: ideal control of rapid aimed movements. Psychology
Oliveira, F. T. P., Elliott, D., & Goodman, D. (2005). Energy minimization bias:
Compensating for intrinsic influence of energy minimization mechanisms. Motor
Control, 9(1), 101-114. doi: 10.1123/mcj.9.1.101
Rabbitt, P. M. A. (1981). Sequential action. In D. H. Holding (Ed.), Human Skill (pp. 147-170). London: Wiley.
Roberts, J. W., Burkitt, J. J., Elliott, D., & Lyons, J. L. (2016). The impact of strategic trajectory optimization on illusory target biases during goal-directed aiming. Journal
of Motor Behavior, 48(6), 542-551. doi: 10.1080/00222895.2016.1161588
Roberts, J. W., Elliott, D., Lyons, J. L., Hayes, S. J., & Bennett, S. J. (2016). Common vs. independent limb control in sequential vertical aiming: The cost of potential errors during extension and reversals. Acta Psychologica, 163, 27-37. doi:
doi.org/10.1016/j.actpsy.2015.10.004
Roberts, J. W., Wilson, M. R., Skultety, J., & Lyons, J. L. (2018). Examining the effect of state anxiety on compensatory and strategic adjustments in the planning of goal-directed aiming. Acta Psychologica, 185, 33-40. doi: 10.1016/j.actpsy.2018.01.008
Schmidt, R. A., Zelaznik, H. N., Hawkins, B., Frank, J. S., & Quinn, J. T. (1979). Motor output variability: A theory for the accuracy of rapid motor acts. Psychological
Shea, J. B. & Morgan, R. L. (1979). Contextual interference effects on the acquisition, retention, and transfer of a motor skill. Journal of Experimental Psychology: Human
Learning and Memory, 5(2), 179-187. doi: 10.1037/0278-7393.5.2.179
Van Beers, R. J. (2009).Motor learning is optimally tuned to the properties of motor noise.
Neuron, 63(3), 406-417. doi: 10.1016/j.neuron.2009.06.025
Van Beers, R. J., Haggard, P., & Wolpert, D. M. (2004). The role of execution noise in movement variability. Journal of Neurophysiology, 91, 1050-1063. doi:
10.1152/jn.00652.2003
Welford, A. T. (1968). Fundamentals of skill. New York, US: Methuen.
Wolpert, D. M. & Flanagan, J. R. (2010). Motor learning. Current Biology, 20(11), R468. doi: 10.1016/j.cub.2010.04.035
Wolpert, D. M. & Ghahramani, Z. (2000). Computational principles of movement neuroscience. Nature Neuroscience, 3, 1212-1217. doi: 10.1038/81497
Woodworth, R. S. (1899). The accuracy of voluntary movement. Psychological Review, 3,
(Monograph Suppl.), 1-119.
Worringham, C. J. (1991). Variability effects on the internal structure of rapid aiming movements. Journal of Motor Behavior, 23(1), 75-85. doi:
Tables
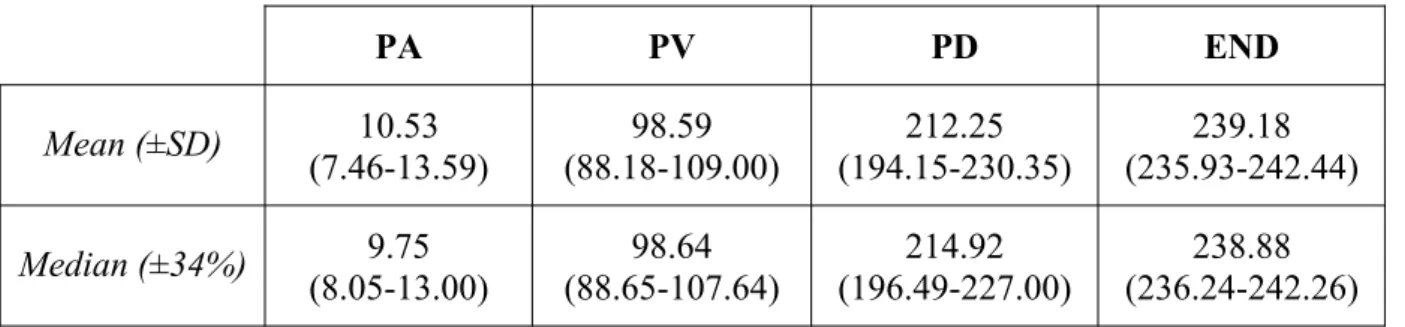
Table 1. Mean within-participant means (±SD) and medians (±34%) of the displacement at kinematic landmarks (mm) for cases aiming horizontal/forward
PA PV PD END
Mean (±SD) 10.53
(7.46-13.59) 98.59 (88.18-109.00) 212.25 (194.15-230.35) 239.18 (235.93-242.44)
Median (±34%) 9.75
(8.05-13.00) 98.64 (88.65-107.64) 214.92 (196.49-227.00) 238.88 (236.24-242.26)
Table 2. Mean within-participant means (±SD) and medians (±34%) of the displacement at kinematic landmarks (mm) for cases aiming vertical/upward
PA PV PD END
Mean (±SD) 7.08
(5.70-8.45) 59.75 (51.73-67.77) 138.17 (123.64-152.70) 156.33 (152.98-159.68)
Median (±34%) 7.07
Figure captions
Fig. 1 Combined within-participant frequency distributions of spatial locations at peak acceleration (PA), peak velocity (PV), peak deceleration (PD), and movement end (END) for the first set of movement data (horizontal/forward).
Fig. 2 Variability ranges defined by ±1 standard deviation (SD) and ±34.13th percentile (%) across kinematic landmarks for the first set of movement data (horizontal/forward).
Fig. 3 Combined within-participant frequency distributions of spatial locations at peak acceleration (PA), peak velocity (PV), peak deceleration (PD), and movement end (END) for the second set of movement data (vertical/upward).
Footnotes
1) Because the double-differentiated time-series displacement data used to obtain
acceleration may have exaggerated any irregularities in the kinematics, it is possible that the indicators of skewness or non-normal distributions resulted from an artefact of data processing. Thus, the present findings were corroborated by conducting the same sets of analyses following the re-filtering of velocity data prior to a further three-point central differentiation. For z3 scores, the main effect of kinematic landmark approached
conventional levels of significance, F(3, 30) = 2.67, p = .085, partial ƞ2 = .21, while there
was a significantly positive skew compared to 0 for peak acceleration, t(10) = 2.55, p
< .05 (peak acceleration: M = .32, SD = .42; peak deceleration: M = -.64, SD = 1.15). Meanwhile, comparisons between standard deviation and percentile ranges revealed significant main effect of statistic, F(1, 10) = 7.17, p < .05, partial ƞ2 = .42, and
kinematic landmark, F(3, 30) = 32.76, p < .05, partial ƞ2 = .77, although were superseded
by a significant statistic x kinematic landmark interaction, F(3, 30) = 4.65, p < .05,
partial ƞ2 = .32. Post hoc analysis confirmed a significantly larger range for standard
deviation (M = 31.59, SD = 9.24) compared to percentile (M = 26.29, SD = 12.65) scores at peak deceleration (p < .05). Furthermore, as the transition between
positive-to-negative acceleration coincides with the moment of peak velocity, the z3 scores from the zero-line crossing of the double-differentiated acceleration were compared with the peak of the single-differentiated velocity, which revealed no significant difference, T = 5, z = .27, p > .05. Collectively, it appears these separate analyses refute suggestions of a processing artefact.
the z3 scores revealed a significant main effect of kinematic landmarks, F(3, 45) = 9.93, p < .05, partial ƞ2 = .40, which indicated a significantly more negative score at peak
deceleration (M = -.89, SD = 72) compared to the remaining landmarks (peak
acceleration: M = .24, SD = .77; peak velocity: M = .32, SD = .68; movement end: M = -.15, SD = .43). These findings were corroborated by the single-sample t-test as there was a significantly lower score compared to 0 for peak deceleration, t(15) = 4.93, p < .05. Meanwhile, the analysis of standard deviation and percentile ranges showed significant main effects of statistic, F(1, 15) = 14.23, p < .05, partial ƞ2 = .49, and kinematic
landmark, F(3, 45) = 61.61, p < .05, partial ƞ2 = .81, which were superseded by a statistic
x kinematic landmark interaction, F(3, 45) = 4.29, p < .05, partial ƞ2 = .22. Post hoc