RVC OPEN ACCESS REPOSITORY – COPYRIGHT NOTICE
This is the peer reviewed version of the following article:
Dixon, J., Smith, K., Perkins, J., Sherlock, C., Mair, T. and Weller, R. (2016), COMPUTED TOMOGRAPHIC APPEARANCE OF MELANOMAS IN THE EQUINE HEAD: 13 CASES. Veterinary Radiology & Ultrasound. doi: 10.1111/vru.12345
which has been published in final form at http://dx.doi.org/10.1111/vru.12345.
This article may be used for non-commercial purposes in accordance with Wiley Terms and Conditions for Self-Archiving.
The full details of the published version of the article are as follows:
TITLE: COMPUTED TOMOGRAPHIC APPEARANCE OF MELANOMAS IN THE EQUINE HEAD: 13 CASES
AUTHORS: Dixon, J., Smith, K., Perkins, J., Sherlock, C., Mair, T. and Weller, R.
JOURNAL TITLE: Veterinary Radiology & Ultrasound
PUBLISHER: Wiley
PUBLICATION DATE: 22 January 2016 (online)
COMPUTED TOMOGRAPHIC APPEARANCE OF MELANOMAS IN THE EQUINE 1
HEAD: 13 CASES 2
3
Jonathon Dixon1, Ken Smith1, Justin Perkins1, Ceri Sherlock2, Tim Mair2, Renate 4
Weller1 5
6
1 Department of Clinical Sciences and Services, The Royal Veterinary College, 7
Hawkshead Lane, Hatfield, AL9 7TA 8
9
2 Bell Equine Veterinary Clinic, Butchers Lane, Mereworth, Kent, ME18 5GS 10
11
Key words: Computed Tomography, Equine, Melanoma, Neoplasia 12
13
Running Head: CT appearance of equine melanomas 14
15
Funding Sources: None 16
17
Corresponding author: [email protected] 18
Abstract 20
Melanomas are one of the most common neoplasms in the horse and are 21
frequently found in the head region. There is a genetic predisposition in horses 22
with a grey hair coat. Computed tomography (CT) is frequently used in referral 23
practice to evaluate the equine head but there are few reports describing the CT 24
appearance of melanomas in this location. The aim of this study was to describe a 25
retrospective, descriptive, case series of horses with this condition. Case records 26
from two referral hospitals were reviewed, and thirteen horses were identified 27
that had undergone CT of the head, with a diagnosis of melanoma based on 28
cytology, histopathology or visual assessment of black (melanotic) tissue. A 29
median of 11 melanomas was identified per horse (range 3-60), with a total of 30
216 masses. Melanomas were found most frequently in the parotid salivary 31
gland, guttural pouches, surrounding the larynx and pharynx and adjacent to the 32
hyoid apparatus. In non-contrast CT images, all melanomas were 33
hyperattenuating (median; 113.5 Hounsfield units (HU), IQR; 26 HU) compared 34
to masseter musculature (median; 69 HU, IQR; 5.5 HU). Fifty-six (25.9%) masses 35
were partially mineralized and forty-one (19.4%) included hypoattenuating 36
areas. Histopathological assessment of these melanomas suggests that the 37
hyperattenuation identified is most likely a result of abundant intracytoplasmic 38
melanin pigment. Melanomas of the equine head appear to have consistent 39
features on CT, which aids diagnosis of mass lesions and their distribution in this 40
area, although histopathological analysis or visual confirmation should still be 41
obtained for definitive diagnosis. 42
Introduction 44
Melanomas are one of the most frequently identified neoplasms in horses, 45
representing between 3 and 15% of tumours, with a known genetic 46
predisposition identified in the grey horse.1 Melanomas are frequently identified 47
in the perineal region, the base of the tail, the lips and the prepuce.1-3 However 48
they have also been frequently reported to affect the head and neck.4-6 49
In the head, melanomas have been described affecting the parotid salivary 50
glands, eye and eyelids, ears, guttural pouches, paranasal sinuses, lymph nodes 51
and other cutaneous sites.1, 5, 7-11 While some of these are visible on clinical 52
examination, some affect deeper structures which may only be identified via 53
endoscopy of the guttural pouches, computed tomography (CT) or magnetic 54
resonance (MR) imaging. There are several publications that describe the use of 55
CT for the evaluation of mass lesions in the head.12-14 56
Equine melanomas vary from being heavily pigmented to non-pigmented 57
(amelanotic). Most melanomas are pigmented and the dark brown to black 58
appearance of these masses is a result of abundant intracellular melanin 59
pigment.1 Melanin is formed from the oxidation and subsequent polymerization 60
of the amino acid L-tyrosine which occurs within the melanocytes.15 Melanin has 61
been noted to exhibit paramagnetic effects in MR images of both humans and 62
small animals.16-20 63
Many different neoplasms and mass like lesions have been reported to affect the 64
equine head, including but not limited to; adenocarcinoma, lymphosarcoma, 65
haemangiosarcoma, squamous cell carcinoma, osteosarcoma, myxoma, 66
meningioma, ossifying fibroma, anaplastic sarcoma, spindle cell tumour 67
sinonasal neoplasms with the exception of the ossifying fibroma, were identified 69
to be iso- or hypoattenuating when compared to the masseter muscle.13 In 70
another study, progressive ethmoidal haematomas were noted to be 71
hyperattenuating compared with masseter muscle and the hyperattenuation was 72
described most commonly as heterogeneous with a ‘swirling’ pattern.16 73
Computed tomography attenuation values alone do not differentiate between 74
various neoplasms, normal soft tissue structure or even purulent material.13 75
However, there are two cases within the reported literature describing CT 76
imaging findings in horses with melanoma, both of which demonstrated the 77
presence of a hyperattenuating mass.10, 21 78
The authors have identified melanomas in the head of horses using CT and these 79
masses were observed to be hyperattenuating to surrounding musculature, often 80
with a mineralized component. Our clinical experience matches case reports in 81
the human literature describing the CT features of melanoma in the head, in 82
particular the brain; frequently melanoma masses are hyperattenuating 83
compared to both brain parenchyma and adjacent musculature.26, 27 84
The aim of the present study was to describe the CT imaging features of 85
melanomas in the horse. The hypothesis is that melanomas will be consistently 86
hyperattenuating to surrounding masseter musculature on CT images. 87
88
Methods 89
Cases records of horses that had standing CT at the Equine Referral Hospital, The 90
Royal Veterinary College (RVC) between April 2010 until April 2015 and at Bell 91
Equine Veterinary Clinic (BEVC) between April 2013 and April 2015 were 92
on standing CT that was diagnosed as melanoma on the basis of cytological 94
examination of a fine needle aspirate, histopathological evaluation of an 95
incisional or excisional biopsy, or visual assessment of black tissue representing 96
the mass e.g. within the guttural pouch on endoscopy. The case history, 97
signalement, primary presenting complaint and clinical findings of all horses 98
included in this study were reviewed from the hospital records system, and 99
summarized for this study. Cases where either a complete CT studies or a 100
definitive diagnosis were not available were excluded from this study. 101
CT images were reviewed jointly by two authors, one ECVDI LA Associate (RW) 102
and one ECVDI LA track resident (JD) in a single sitting using a computer 103
workstation and DICOM viewing software (OsiriX 64 bit version 6.0.2, Pixmeo 104
SARL, Switzerland). Reviewers utilized multiplanar reconstructions (MPR) and 105
adjustments of the window width (WW) and window level (WL). 106
Reviewers recorded the number of masses identified, the anatomical location of 107
masses, the maximum mass dimensions, representative mean tissue attenuation 108
of each mass (Hounsfield unit, (HU)), comparative mean attenuation of the 109
masseter muscle, presence and attenuation values of hypoattenuating regions 110
within a mass, and the presence and attenuation values of any mineralization 111
within a mass. Representative attenuation values were obtained for each of the 112
variety of regions using the maximum possible round or oval shaped, hand 113
drawn region of interest (ROI) on a transverse image of each respective lesion. 114
Due to the variable size of lesions, ROI size could not be standardized. All CT 115
studies were reviewed by both the first and last authors to identify signs of 116
concurrent pathology. Abnormalities were recorded and significance determined 117
Histopathological reports and retained specimens were retrospectively reviewed 119
by a board certified veterinary pathologist (KS). 120
Data distribution was assessed by evaluating histograms; a Wilcoxon Signed 121
Rank test was consequently performed to assess the difference in Hounsfield 122
units between masses and the masseter muscle. P-values were set at 0.05 and 123
analysis was performed in SPSS (IBM SPSS Statistics, version 21.0, IBM Corp, 124
Armonk, NY, USA). Analysis of data was performed by the first and last authors. 125
126
Results 127
Thirteen horses met the inclusion criteria for this study (7 from The RVC, and 6 128
from BEVC). Breeds were 6 Irish Sports Horses, 2 Irish Draft Horses, 2 129
Connemaras, 1 Thoroughbred, 1 Arabian cross and 1 pony. There were 4 130
geldings and 9 mares. Median age was 12 years (range 6-24 years). All horses 131
had a grey hair coat. 132
Computed tomographic images were obtained in the standing, sedated horse as 133
has been previously described,28 using one of two multidetector CT scanners 134
(RVC: GE LightSpeed Pro 16, GE Healthcare, Buckinghamshire, UK and BEVC: GE 135
LightSpeed Plus, GE Healthcare, Buckinghamshire, UK), with typical scan 136
parameters of 1.25mm thick slices, 1.25mm interslice gap, tube rotation time of 137
0.5-0.8 seconds, kVp of 120 and mA of 200 and a variable pitch. CT scans were 138
typically performed from the junction between the first and second cervical 139
vertebrae rostrally to include the entire dental arcades to the level of the 140
diastema. Non-ionic iodinated contrast media (Iohexol, 300mg/ml, Omnipaque, 141
GE Healthcare, UK) was administered in a single case at a dose of 300mgI/kg IV 142
by repeated image acquisition at both 30 seconds and 90 seconds post injection. 144
Image reconstruction using both soft tissue and bone algorithms was routinely 145
performed. 146
The primary presenting signs were; soft tissue swelling in the parotid salivary 147
gland region in 6 horses, dysphagia in 3, and mass at the base of the ear, 148
exophthalmos, mass over the temporomandibular joint and unilateral nasal 149
discharge each affecting one horse. One of the CT examinations was performed 150
as part of a pre-purchase examination due to the detection of mass lesions in the 151
parotid salivary gland region on clinical examination. 152
Diagnosis of melanoma was based on sampling a sub-section of masses (1-2 per 153
horse) using histopathology in 6 horses, cytology in 2 and visualization of a black 154
mass within one or both guttural pouches in 5. 155
A total of 216 soft tissue masses compatible with melanoma were identified in 156
the 13 horses (median 11; range 3-60). The location of the melanomas detected 157
in these cases are detailed in Table 1, with melanomas identified most frequently 158
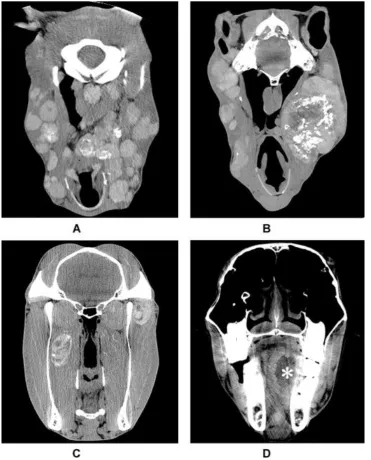
in the region of the parotid salivary gland, guttural pouches, surrounding the 159
larynx and pharynx and adjacent to the hyoid apparatus. There was a wide 160
variability in the size of melanomas (identified on transverse CT images) with 161
the smallest identified being 3 x 3mm and the largest 136 x 104mm in the 162
transverse plane. Example images are given in Figure 1 A-D. 163
Masses generally appeared as well demarcated homogenous areas of 164
hyperattenuation compared with adjacent soft tissue, with some containing 165
hypoattenuating or mineral attenuating areas. Median representative 166
attenuation of the 216 masses was 113.5 HU (IQR; 26 HU). Median attenuation of 167
individual horses’ masseter musculature, all 216 of the identifiable melanoma 169
masses were observed to be hyperattenuating. There was a significant difference 170
in attenuation values between the melanoma masses and the masseter muscle 171
(P=0.01). 172
Irregularly shaped but well-defined hypoattenuating regions were identified 173
within 19.4% (41/216) of the individual masses. The median attenuation of 174
these hypoattenuating regions was 45.1 HU (IQR; 29.5 HU). Of the 216 total 175
masses identified, 25.9% (56/216) were found to have mineral content within 176
the mass, with a median attenuation of 326 HU (IQR; 163.75 HU). 177
Concurrent abnormalities were identified in CT images of 6 horses. The most 178
frequently identified concurrent abnormalities included; two cases with 179
periapical infection of a cheek tooth (teeth 109 and 209), one of which had a 180
secondary sinusitis, two cases with temporohyoid articulation remodeling and 181
two cases with osteophytes affecting the temporomandibular joints. In 11/13 182
cases the melanomas were considered the primary clinical problem, and the 183
reason for performing advanced imaging. In the two cases where melanomas 184
were not the primary clinical complaint, one case had dental disease and 185
secondary sinusitis, and one case presented for a laryngeal foreign body (metal 186
wire). The use of CT in each of these cases facilitated a greater understanding of 187
the number and extent of masses within the head region, often identifying a 188
significantly greater number of lesions than clinical examination alone revealed. 189
Post contrast CT images were obtained in one horse with a parotid melanoma. 190
This enabled detailed assessment of the local vasculature, which aided in surgical 191
enhancement following contrast administration (72HU pre-contrast, 110HU post 193
contrast). 194
195
Histopathological evaluation 196
Specimens of melanomas from 3 horses were available for histological review. 197
On histological examination the typical appearance was that of an expansile to 198
infiltrative unencapsulated mass composed of small nests and short interwoven 199
bundles of polygonal to spindle-shaped cells with fine intracytoplasmic melanin 200
granules (neoplastic melanocytes) interspersed with aggregates of large round 201
cells containing abundant coarsely granular intracytoplasmic melanin 202
(melanomacrophages). The neoplastic melanocytes demonstrated mild nuclear 203
atypia and scattered mitoses: average less than 1 per 10 high power field (Figure 204
2). Intralesional haemorrhage was rare. Some sections contained irregular 205
areas of ischaemic-type necrosis that was undergoing mineralization (dystrophic 206
calcification). 207
208
Discussion 209
A median of 11 melanoma mass lesions were identified on CT images acquired 210
standing in 13 horses. All masses showed a similar consistent appearance on CT 211
images, appearing as a well-defined, predominantly homogenous mass lesion 212
(median attenuation of 113.5 HU) that was hyperattenuating compared with 213
masseter musculature (median attenuation of 69 HU). This finding suggests a 214
means to distinguish melanomas from the surrounding normal musculature; 215
hence measurement of the attenuation value should be included when reviewing 216
Melanomas are one of the most frequently identified neoplasms in the horse.1 218
Despite a large clinical CT caseload at the two hospitals in this study, there were 219
only 13 cases presented for computed tomographic evaluation with subsequent 220
lesion confirmation over the study period. It is likely that the low number of 221
horses identified with melanomas on CT is a result of lesions being identified and 222
treated within first opinion practice and the potential advantages of CT being 223
under-recognized. 224
In humans the hyperattenuating appearance of melanoma on CT has been 225
associated with intra-tumoural hemorrhage,26 however this was rarely found on 226
histopathological review of tissue sections in the present study. Hemorrhage on 227
CT can often be visualised as a hyperattenuating lesion due to the degree of 228
cellularity and subsequent breakdown products of a hematoma and therefore is 229
an important factor to consider.29, 30 In the absence of significant intralesional 230
haemorrhage we instead propose that the hyperattenuating appearance in the 231
lesions that we imaged to directly reflect the melanin content.18, 31 Melanin 232
pigment has been shown to have a high affinity for the binding of multiple metal 233
ions including iron, copper, manganese and zinc, and may demonstrate free 234
radical scavenging properties.17 Copper is utilized in the formation of melanin 235
pigment, being required for tyrosinase activity, and therefore may become 236
incorporated into the molecule. It is known that melanin pigment exhibits 237
paramagnetic effects when placed in an external magnetic field such as a clinical 238
MR imaging scanner, and it is possible that the paramagnetic effects are also a 239
direct result of this high metal ion binding affinity.16 The relatively high atomic 240
containing melanomas in CT images. The melanomas identified in the present 242
study were melanin-containing (melanotic) melanomas. 243
In one horse in the present series, which had 4 masses, attenuation values of the 244
melanoma lesions were in the range of 69-77HU. Although still hyperattenuating 245
compared to the masseter muscle in this individual (67HU), these values were 246
lower than those of the other twelve horses. The melanomas in this individual 247
were small and poorly delineated from the surrounding parotid salivary gland 248
parenchyma, hence the measured attenuation values may underestimate the true 249
attenuation because of partial volume effects. The authors chose to include this 250
case despite these challenges, as the subtlety of the masses identified represents 251
a real-life clinical problem that must be recognized when evaluating for the 252
presence of lesions on CT images. 253
Mineralization of the melanoma masses was observed commonly in this series 254
(25.9% of masses), with this often seen in association with adjacent 255
hypoattenuating regions. This corresponds to the histological finding of 256
melanomas with areas of necrosis adjacent to secondary areas of dystrophic 257
mineralization. This secondary change is rarely observed in melanomas in other 258
species.32-35 259
Post-contrast CT of standing horses is not a widely established technique and 260
was used for only one horse in this series therefore the potential benefit of 261
acquiring post-contrast images cannot be assessed on the basis of a single case. 262
The results of this study suggest that melanomas are readily visible on non-263
contrast CT images when the CT images are viewed on an appropriate WW and 264
700) and a soft tissue (WW; 350, WL; 50) window when evaluating the head of 266
the horse. 267
It is beyond the scope of this article to review in depth the treatment options for 268
melanomas of the head and this information is largely available elsewhere.1 A 269
range of treatment options was utilized in the patients within this study, and this 270
reflects clinician preferences, lesion location, the number and extent of the 271
lesions, the clinical consequences of the lesions and use of the horse. In some 272
cases, a greater number of masses were identified on the CT images than were 273
clinically suspected, with 60 masses identified in one patient. It therefore seems 274
appropriate to consider that some superficial lesions identified on clinical 275
examination may well represent only ‘the tip of the iceberg’ in regards to the true 276
number of masses present and diagnostic imaging is recommended to enable 277
individual equine patients to be accurately staged to permit informed decision 278
making about case management. 279
When examining lesions of this nature on CT images, other differential diagnoses 280
are that of alternative neoplasms. Several other neoplastic lesions including; 281
osteoma, ossifying fibroma, osteosarcoma and others have been reported to 282
contain mineral material and therefore may have a hyperattenuating appearance 283
on CT images.11, 13, 24 Predominantly heterogenous hyperattenuating progressive 284
ethmoidal haematomas are less likely differential diagnoses; as, these are 285
generally located in the sinuses or ethmoidal regions rather than within the soft 286
tissue.16 287
With respect to limitations of this study, one challenging finding was to 288
accurately identify each individual mass, particularly in cases where abundant 289
performing attenuation measurements, rather than a using a predefined sized 291
ROI, varying sized ROI’s were used in this study to evaluate the attenuation 292
values of the masses, masseter muscle and the hyper- and hypo- attenuating 293
areas within the masses. The largest ROI possible was used to reflect the 294
attenuation of the homogenous portion of the tissue of interest only, whilst 295
maximizing the sampling size in each location. Using too large a ROI may have 296
sampled perilesional tissues, and too small a ROI may not have incorporated 297
enough image information, either of which may have decreased the accuracy of 298
the measurements.36 299
In conclusion, melanomas in the equine head appear to have a consistent 300
appearance on CT images. This consistent appearance may aid differentiation of 301
melanomas from other soft tissue masses within the head and therefore aid 302
radiologists to identify such lesions. Melanomas in the equine head are 303
commonly numerous and appear hyperattenuating compared to masseter 304
muscle with a median attenuation of 113.5 HU. Melanomas may contain 305
hypoattenuating areas consistent with necrosis or mineral attenuating areas 306
consistent with dystrophic mineralization. Although histopathological 307
characterization of masses remains the gold standard, the authors suggest that 308
the imaging features identified may aid in forming appropriate differential 309
Acknowledgments 311
The authors thank Christopher R Lamb and Tommaso Gregori for their advice 312
and contributions to this study. 313
314
References 316
1. Phillips JC, Lembcke LM. Equine melanocytic tumors. Vet Clin North Am
317
Equine Prac. 2013;29: 673-687.
318
2. Cotchin E. A general survey of tumours in the horse. Equine Vet J. 1977;9: 319
16-21. 320
3. Seltenhammer MH, Simhofer H, Scherzer S, Zechner P, Curik I, Solkner J, et 321
al. Equine melanoma in a population of 296 grey Lipizzaner horses. Equine Vet J. 322
2003;35: 153-157. 323
4. McFadyean J. Equine melanomatosis. J Comp Pathol. 1933;46: 186-IN188. 324
5. Fintl C, Dixon PM. A review of five cases of parotid melanoma in the horse. 325
Equine Vet Educ. 2001;13: 17-24.
326
6. Valentine BA. Equine melanocytic tumors: a retrospective study of 53 327
horses (1988 to 1991). J Vet Intern Med. 1995;9: 291-297. 328
7. Moore JS, Shaw C, Shaw E, Buechner-Maxwell V, Scarratt WK, Crisman M, 329
et al. Melanoma in horses: Current perspectives. Equine Vet Educ. 2013;25: 144-330
151. 331
8. Albanese V, Newton JC, Waguespack RW. Malignant melanoma of the third 332
eyelid in a horse. Equine Vet Educ. 2015;27: e15-e19. 333
9. Barnett K, Platt H. Intraocular melanomata in the horse. Equine Vet J. 334
1990;22: 76-82. 335
10. Tietje S, Becker M, Bockenhoff G. Computed tomographic evaluation of 336
head diseases in the horse: 15 cases. Equine Vet J. 1996;28: 98-105. 337
11. Dixon P, Head K. Equine nasal and paranasal sinus tumours: part 2: a 338
contribution of 28 case reports. Vet J. 1999;157: 279-294. 339
12. Manso-Díaz G, García-López JM, Maranda L, Taeymans O. The role of head 340
computed tomography in equine practice. Equine Vet Educ. 2015;27: 136-145. 341
13. Cissell DD, Wisner ER, Textor J, Mohr FC, Scrivani PV, Theon AP. 342
Computed tomographic appearance of equine sinonasal neoplasia. Vet Radiol
343
Ultrasound. 2012;53: 245-251.
344
14. Textor JA, Puchalski SM, Affolter VK, MacDonald MH, Galuppo LD, Wisner 345
ER. Results of computed tomography in horses with ethmoid hematoma: 16 346
cases (1993-2005). J Am Vet Med Assoc. 2012;240: 1338-1344. 347
15. Lerner AB, Fitzpatrick TB. Biochemistry of melanin formation. Physiol Rev. 348
1950;30: 91-126. 349
16. Premkumar A, Marincola F, Taubenberger J, Chow C, Venzon D, 350
Schwartzentruber D. Metastatic melanoma: correlation of MRI characteristics 351
and histopathology. J Magn Reson Imaging. 1996;6: 190-194. 352
17. Enochs WS, Petherick P, Bogdanova A, Mohr U, Weissleder R. 353
Paramagnetic metal scavenging by melanin: MR imaging. Radiology. 1997;204: 354
417-423. 355
18. Uozumi A, Saegusa T, Ohsato K, Yamaura A. Computed tomography and 356
magnetic resonance imaging of nonhemorrhagic, metastatic melanoma of the 357
brain--case report. Neurol Med Chir (Tokyo). 1990;30: 143-146. 358
19. Grahn BH, Stewart WA, Towner RA, Noseworthy MD. Magnetic resonance 359
imaging of the canine and feline eye, orbit, and optic nerves and its clinical 360
20. Kato K, Nishimura R, Sasaki N, Matsunaga S, Mochizuki M, Nakayama H, et 362
al. Magnetic resonance imaging of a canine eye with melanoma. J Vet Med Sci. 363
2005;67: 179-182. 364
21. Sasaki N, Minami T, Yamada K, Satoh M, Inokuma H, Kobayashi Y, et al. 365
MDCT Images of the Head of a Horse with Malignant Melanoma. J Equine Sci. 366
2007;18: 55-58. 367
22. Dyson PK, Dunn KA, Whitwell K, Dennis R. Ataxia and cranial nerve signs 368
in a pony suffering a brainstem meningioma; clinical, MRI, gross and 369
histopathological findings. Equine Vet Educ. 2007;19: 173-178. 370
23. Silva AdC, Cassou F, Andrade B, Ramos LdO, da Paixão T, Alves G, et al. 371
Ossifying oronasal carcinoma in a horse. Brazilian Journal of Veterinary
372
Pathology. 2012;5: 128-132.
373
24. Crijns C, Vlaminck L, Verschooten F, Bergen T, De Cock H, Huylebroek F, et 374
al. Multiple mandibular ossifying fibromas in a yearling Belgian Draught horse 375
filly. Equine Vet Educ. 2015;27: 11-15. 376
25. Tremaine W. Progressive ethmoidal haematoma. Equine Vet Educ. 377
2013;25: 508-510. 378
26. Ginaldi S, Wallace S, Shalen P, Luna M, Handel S. Cranial computed 379
tomography of malignant melanoma. Am J Neuroradiol. 1980;1: 531-535. 380
27. Holtås S, Cronqvist S. Cranial computed tomography of patients with 381
malignant melanoma. Neuroradiology. 1981;22: 123-127. 382
28. Dakin S, Lam R, Rees E, Mumby C, West C, Weller R. Technical set‐up and 383
radiation exposure for standing computed tomography of the equine head. 384
Equine Vet Educ. 2014;26: 208-215.
385
29. Bradley WG, Jr. MR appearance of hemorrhage in the brain. Radiology. 386
1993;189: 15-26. 387
30. Parizel PM, Makkat S, Van Miert E, Van Goethem JW, van den Hauwe L, De 388
Schepper AM. Intracranial hemorrhage: principles of CT and MRI interpretation. 389
Eur Radiol. 2001;11: 1770-1783.
390
31. Kalkman E, Baxter G. Melanoma. Clin Radiol. 2004;59: 313-326. 391
32. Chénier S, Doré M. Oral malignant melanoma with osteoid formation in a 392
dog. Veterinary Pathology Online. 1999;36: 74-76. 393
33. Pellegrini AE, Scalamogna PA. Malignant melanoma with osteoid 394
formation. Am J Dermatopathol. 1990;12: 607-611. 395
34. Lucas DR, Tazelaar HD, Unni KK, Wold LE, Okada K, Dimarzio Jr DJ, et al. 396
Osteogenic melanoma: a rare variant of malignant melanoma. Am J Surg Pathol. 397
1993;17: 400-409. 398
35. Fukunaga M. Osteogenic melanoma. Apmis. 2005;113: 296-300. 399
36. Wörz S, Rohr K. Localization of anatomical point landmarks in 3D medical 400
images by fitting 3D parametric intensity models. Medical Image Analysis. 401
2006;10: 41-58. 402
Tables 404
Table 1: Summary of signalement, presenting complaints and melanoma measurements obtained from 13 horses. 405
Case Age in
years Breed Sex Presenting complaint Lesion locations Number of masses
identified
Median attenuation of masses (HU)
Maximum mass dimension in the transverse plane (mm)
Mineralization of masses present (Y/N)
Hypoattenuating areas present (Y/N)
1 12 Pony FE Parotid soft tissue swelling PX, LX, GP, EA, TMJ 32 109 136 x 104 Y Y
2 14 Connemara FE Right retrobulbar mass T, RB, MM, HY, TMJ 11 120.4 80 x 33 Y Y
3 10 ISH FE Soft tissue mass left TMJ TMJ, MR 3 127.2 37 x 32 Y N
4 24 TB FE Unilateral left nasal discharge PSG, LX, EA, MR 8 97.7 79 x 47 Y N
5 8 Connemara FE Parotid soft tissue masses PSG 4 71.8 27 x 35 Y N
6 15 Irish Draft MN Dysphagia and weight loss T, GP, C1, MR, HY,
EA, PSG 19 109.4 83 x 57 Y Y
7 11 ISH MN Dysphagia and quidding TMJ, MM 3 90.8 37 x 18 Y N
8 11 ISH FE Soft tissue masses PSG GP, PSG, LX, C1 10 107 32 x 26 N Y
9 16 Arabian
Cross FE Retropharyngeal swelling and persistent neck extension LX, C1, PSG, HY, GP 26 117 42 x 26 Y Y
10 6 ISH MN Parotid region masses TMJ, GP, PSG 19 103 20 x 20 N Y
11 14 ISH FE Parotid mass lesion and
around the base of the ears GP, C1, TMJ, LX, EA, PX, PSG 60 124.5 73 x 52 Y Y
12 8 Irish Draft FE Parotid mass lesions
identified at PPE
PSG 3 95 19 x 11 Y N
13 18 ISH MN Parotid soft tissue masses
and behavioral changes PSG, TMJ, EA, MR 18 100.5 52 x 36 Y Y
406
Abbreviations: Y/N; Yes/No, FE; female entire, MN; male neutered, TB; Thoroughbred, ISH; Irish Sports Horse, HU; Hounsfield Unit, PX; 407
Pharynx, LX; Larynx, GP; Guttural Pouches, EA; Base of ears, TMJ; Temporomandibular joint, T; Tongue, RB; Retrobulbar space, MM; 408
Masseter muscle, HY; Surrounding the hyoid apparatus, MR; Medial to the mandibular ramus, PSG; Parotid salivary gland region, C1; 409
Figure Legends 411
Figure 1: Transverse CT images displayed on a soft tissue WW/WL obtained 412
from four horses included, depicting a selection of the hyperattenuating 413
melanomas identified, with or without mineralization and/or hypoattenuating 414
foci. A; CT image at the level of the occipital bone from horse 11, B; CT image 415
from horse 1 at the level of the guttural pouches, C; CT image from horse 3 at the 416
level of the vertical ramus of the mandible, D; CT image from horse 6 at the level 417
of the cheek teeth (white * indicates lesion within the tongue). 418
Figure 2: Photomicrographs of equine melanoma. A; Unbleached section stained 420
with H&E. Note short interwoven bundles and closely packed nests of 421
pigmented melanocytes (arrow head) interspersed with coarsely granular 422
melanophages (large arrow). Original magnification x100. B; Bleached section 423
stained with H&E. Note mild to moderate nuclear atypia exhibited by neoplastic 424
melanocytes (arrow head) versus melanophages (large arrow). Original 425
magnification x200. 426