Telephone: +44 (0)1582 763133 Web: http://www.rothamsted.ac.uk/
Rothamsted Repository Download
A - Papers appearing in refereed journals
Richard, B., Richter, G. M., Cerasuolo, M. and Shield, I. F. 2019.
Optimizing the bioenergy water footprint selecting SRC willow canopy
phenotypes: regional scenario simulations. Annals of Botany. 124 (4), pp.
531-542.
The publisher's version can be accessed at:
• https://dx.doi.org/10.1093/aob/mcz006
The output can be accessed at:
https://repository.rothamsted.ac.uk/item/8w8wv/optimizing-the-bioenergy-water-footprint-selecting-src-willow-canopy-phenotypes-regional-scenario-simulations.
© 13 February 2019, CC-BY terms apply
1
1
Supplementary data Tables
2
3 Table S1: Leaf and canopy characteristics of four SRC willow cultivars used in this study.
4 The leaf length to width ratio was measured by planimeter imagery from 10 leaves per
5 cultivar collected from leaf 16 – 25 counting down from first fully emerged leaf at the tip of a
6 strong leading stem.
Cultivar Leaf length to width ratio*
Ploidy Parents Architecture LA Roth
‘Endurance’ 4.22 4.92 Pentaploid Salix rehderiana x S. dasyclados
Multiple stems, broad leaf ‘Terra Nova’ 5.69 5.32 Triploid (S. triandra x viminalis) x S.
miyabeana
Multiple stems, broad leaf ‘Resolution’ 7.93 8.40 Diploid (S. viminalis x Bjorn) x
Quest (S. viminales x Bjorn)
Fewer stems, narrower leaf ‘Tora’ 9.93 9.59 Diploid S. schwerinii x S. viminalis Fewer stems,
narrower leaf
7 *At both sites the difference between leaf length to width ratios was statistically significant (one way ANOVA,
8 F pr. <0.001) with a S.E.D. of 0.418 and 0.410 at Long Ashton (LA) and Rothamsted Research (Roth)
9 respectively.
10 **Bjorn is a sibling of Tora, i.e. same pedigree.
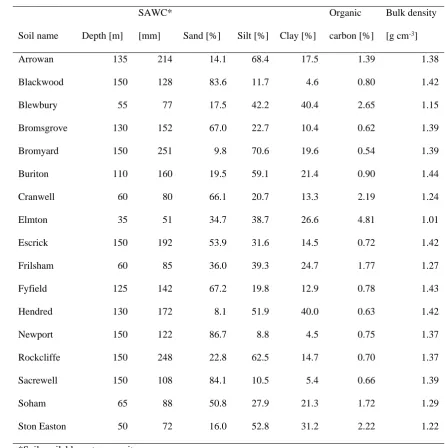
1 Table S2: Characteristics of the 17 soil types used in the scenario simulations with the
2 process-based model LUCASS for each site.
Soil name Depth [m]
SAWC*
[mm] Sand [%] Silt [%] Clay [%]
Organic carbon [%]
Bulk density [g cm-3]
Arrowan 135 214 14.1 68.4 17.5 1.39 1.38 Blackwood 150 128 83.6 11.7 4.6 0.80 1.42 Blewbury 55 77 17.5 42.2 40.4 2.65 1.15 Bromsgrove 130 152 67.0 22.7 10.4 0.62 1.39 Bromyard 150 251 9.8 70.6 19.6 0.54 1.39 Buriton 110 160 19.5 59.1 21.4 0.90 1.44 Cranwell 60 80 66.1 20.7 13.3 2.19 1.24 Elmton 35 51 34.7 38.7 26.6 4.81 1.01 Escrick 150 192 53.9 31.6 14.5 0.72 1.42 Frilsham 60 85 36.0 39.3 24.7 1.77 1.27 Fyfield 125 142 67.2 19.8 12.9 0.78 1.43 Hendred 130 172 8.1 51.9 40.0 0.63 1.42 Newport 150 122 86.7 8.8 4.5 0.75 1.37 Rockcliffe 150 248 22.8 62.5 14.7 0.70 1.37 Sacrewell 150 108 84.1 10.5 5.4 0.66 1.39 Soham 65 88 50.8 27.9 21.3 1.72 1.29 Ston Easton 50 72 16.0 52.8 31.2 2.22 1.22 *Soil available water capacity
3
1 Table S3. Hydrological model (soil water content, m3 m−3) evaluation for four willow
2 cultivars at Rothamsted Research between 2010 and 2016: n represents the number of
3 measurements, RMSE the root mean squared error and EF the model efficiency.
4
Endurance Terra Nova Resolution Tora
n 98 98 98 98
RMSE [m3 m−3]
0.034 0.031 0.044 0.027
EF 0.628 0.582 0.134 0.662
5
6
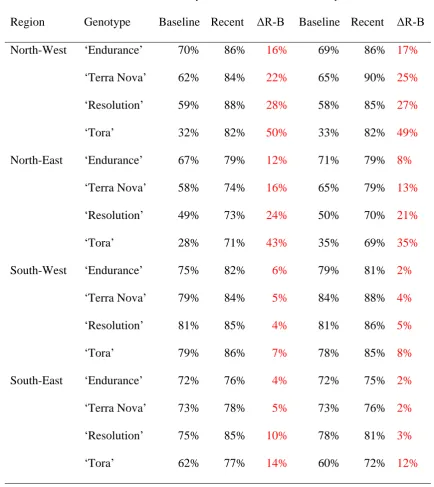
1 Table S4. Percentage to have an annual yield higher than an economical threshold of 9 t/ha
2 for four regions in the UK and four willow cultivars estimated for two sites per region and 17
3 soils per sites for a Baseline (from 1966 to 1988, start in 1965) and Recent (from 1991 to
4 2013, start in 1990).
5
Percentage of years above 9t ha-1
2year-rotation 3year-rotation
Region Genotype Baseline Recent ΔR-B Baseline Recent ΔR-B
North-West ‘Endurance’ 70% 86% 16% 69% 86% 17%
‘Terra Nova’ 62% 84% 22% 65% 90% 25%
‘Resolution’ 59% 88% 28% 58% 85% 27%
‘Tora’ 32% 82% 50% 33% 82% 49%
North-East ‘Endurance’ 67% 79% 12% 71% 79% 8%
‘Terra Nova’ 58% 74% 16% 65% 79% 13%
‘Resolution’ 49% 73% 24% 50% 70% 21%
‘Tora’ 28% 71% 43% 35% 69% 35%
South-West ‘Endurance’ 75% 82% 6% 79% 81% 2%
‘Terra Nova’ 79% 84% 5% 84% 88% 4%
‘Resolution’ 81% 85% 4% 81% 86% 5%
‘Tora’ 79% 86% 7% 78% 85% 8%
South-East ‘Endurance’ 72% 76% 4% 72% 75% 2%
‘Terra Nova’ 73% 78% 5% 73% 76% 2%
‘Resolution’ 75% 85% 10% 78% 81% 3%
5
Supplementary Data Figures
7
Fig. S3. Average modelled annual yields [t ha-1] (A-C) and associated coefficients of
variations (D-F) of four willow cultivars (‘Endurance’, green filled circle, ‘Terra Nova’, purple filled square, ‘Resolution’, orange open diamond and ‘Tora’, yellow open triangles) for a two-year growth cycle management between 1966 and 1988 (start in 1965) for two weather stations for two weather stations in the North-West (A, D), North-East (B, E) and South-West (C, F) of UK regarding the soil water capacities of 17 soils. An economic threshold of 9 t ha-1
above which profits are made is represented by a black line and coloured lines represent polynomial regressions of the genotypic values.
Av er ag e an nu al y ie ld [t h a -1 ] Co ef fic ie nt o f v ar ia tio n
Soil available water capacity [mm] 5 6 7 8 9 10 11 12 13 14
50 70 90 110 130 150 170 190 210 230 250
5 6 7 8 9 10 11 12 13 14
50 70 90 110 130 150 170 190 210 230 250
B
5 6 7 8 9 10 11 12 13 1450 70 90 110 130 150 170 190 210 230 250
Endurance Terra Nova Resolution Tora Economic threshold
C
A
0% 5% 10% 15% 20% 25% 30% 35%50 70 90 110 130 150 170 190 210 230 250
D
0% 5% 10% 15% 20% 25% 30% 35%50 70 90 110 130 150 170 190 210 230 250
E
0% 5% 10% 15% 20% 25% 30% 35%50 70 90 110 130 150 170 190 210 230 250
9
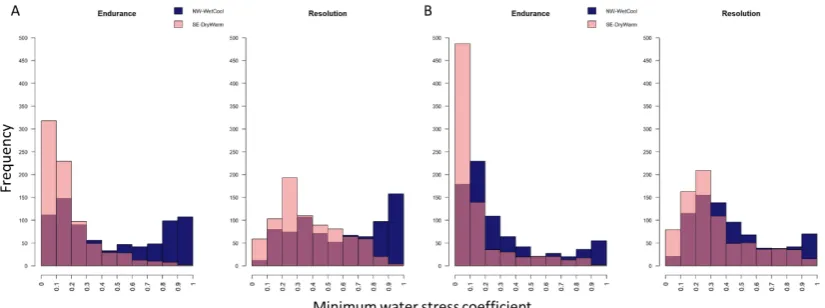
Fig. S5. Modelled WUE [g DM kg-1 H
2O] distribution comparison between ‘Endurance’

![Fig. S2. Simulated (lines) and observed (symbols) soil water content (m3 m−3) between 0.1m and rooting depth (A), and simulated ET [mm] (B) for the willow cultivars ‘Endurance’ (green, plain line and circle) and ‘Tora’ (yellow dashed line and open triangle) at Rothamsted Research in 2011.](https://thumb-us.123doks.com/thumbv2/123dok_us/1075831.1608264/7.595.72.496.133.663/simulated-observed-simulated-cultivars-endurance-triangle-rothamsted-research.webp)
![Fig. S3. Average modelled annual yields [t ha-1] (A-C) and associated coefficients of variations (D-F) of four willow cultivars (‘Endurance’, green filled circle, ‘Terra Nova’, purple filled square, ‘Resolution’, orange open diamond and ‘Tora’, yellow open](https://thumb-us.123doks.com/thumbv2/123dok_us/1075831.1608264/8.595.72.528.198.718/average-modelled-associated-coefficients-variations-cultivars-endurance-resolution.webp)
![Fig. S4. Cumulative simulated evapotranspiration (ET, [mm], from previous year October to September) of two SRC willow cultivars (‘Endurance’ in green and ‘Resolution’ in orange) and a two-year growth cycle management in the North-East (top) and South-West](https://thumb-us.123doks.com/thumbv2/123dok_us/1075831.1608264/9.595.74.471.173.723/cumulative-simulated-evapotranspiration-september-cultivars-endurance-resolution-management.webp)
![Fig. S5. Modelled WUE [g DM kg-1 H2O] distribution comparison between ‘Endurance’ (green) and ‘Resolution’ (orange) for “Baseline” (A, 1966 to 1988) and “Recent” (B, 1991 to 2013) scenarios in the North-East (top) and South-West (bottom) of UK (two weather stations and 17 soils per region)](https://thumb-us.123doks.com/thumbv2/123dok_us/1075831.1608264/10.595.78.471.145.665/modelled-distribution-comparison-endurance-resolution-baseline-scenarios-stations.webp)