Research Article
1
Transporter Associated with Antigen Processing 1
2
(TAP1) as a Potential Biomarker for Breast, Lung,
3
Liver and Ovarian Cancer using Health Informatics
4
Anika Tabassum1, Md. Nazmus Samdani2, Tarak Chandra Dhali3, Rahat Alam4, 5, Foysal
5
Ahammad*,5, 6, Abdus Samad*, 4, 5, Tomasz M. Karpiński*, 7
6
1 Biochemistry Department, School of Life Sciences, Independent University, Bangladesh;
7
8
2 Department of Pharmacy, University of Dhaka, Dhaka, Bangladesh; [email protected]
9
3 Department of Biotechnology and Genetic Engineering, Khulna University, Bangladesh;
10
11
4 Department of Genetic Engineering and Biotechnology, Faculty of biological science and Technology,
12
Jashore University of Science and Technology, Jashore-7408, Bangladesh; [email protected] (R.A);
13
[email protected] (A.S.)
14
5 Biological Solution Centre (BioSol Centre), Farmgate, Dhaka-1215, Bangladesh. [email protected]
15
(R.A), [email protected] (A.S.); [email protected] (F.A.)
16
6 Department of Biological Sciences, Faculty of Science, King Abdul-Aziz University (KAU), Jeddah- 21589,
17
Saudi Arabia. [email protected]
18
7 Chair and Department of Medical Microbiology, Poznań University of Medical Sciences, Wieniawskiego 3,
19
61-712 Poznan, Poland; [email protected]
20
* Correspondence Authors: [email protected] (F.A.); [email protected] (A.S.);
21
[email protected] (TMK)
22
Abstract: Transporter associated with antigen processing 1 (TAP1) gene codes for a transporter
23
protein, which is responsible for tumor antigen presentation in the MHC I or HLA complex. A
24
defect in the gene results in inadequate tumor tracking. TAP1 may also influence multidrug
25
resistance, which is an extreme threat in providing treatment by chemotherapeutic drugs. The gene
26
of TAP1 was analyzed bioinformatically. It gave us prognostic data as a confirmation of whether it
27
should be used as a biomarker. The expression level and pattern analysis were conducted using
28
ONCOMINE, GENT2, and GEPIA2 online platforms. Samples with different clinical outcomes
29
were investigated for expression and promoter methylation analysis was done in cancer vs. normal
30
tissues using UALCAN. The copy number alteration and mutation frequency and expression in
31
different cancer studies were analyzed using cBioPortal. The PrognoScan and KM plotter survival
32
analysis of significant data (p-value<0.05) was representing graphically. Pathway and Gene
33
ontology analysis of genes correlated to the TAP1 gene was presented using bar charts. After
34
arranging the data in a single panel and correlating expression to prognosis, understanding
35
mutational and alterations and comparing pathways, TAP1 may be a potential novel target to
36
evade a threat against chemotherapy and the study gives new aspects to consider for
37
immunotherapy in human breast, lung, liver and ovarian cancer.
38
Keywords: TAP1; transcriptional expression; methylation analysis; survival analysis;
39
co-expression; pathway analysis; health informatics
40
41
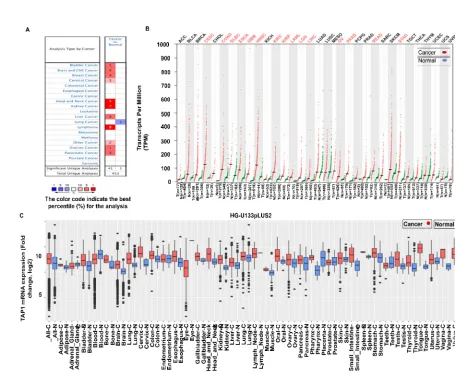
1. Introduction
42
Cancer has been a major contributor to mortality worldwide. In 2018, the global cancer
43
death rate was estimated to be about 9.6 million [1] cancers rates were very high contributors [1]. In
44
2019, there were 1,762,450 new cancer cases, and in 2020, 606,520 cases of deaths were estimated in
45
the United States of America alone [2]. At this rate, the significance of finding better treatments is
46
very high, even though we have options, such as chemotherapy, immunotherapy, or radiotherapy,
47
but they, unfortunately, have their limitations [3]. We tend to dive into the cellular mechanisms and
48
immunology to understand tumor progression better. A great part has been featured by
49
ATP-Binding Cassette (ABC) transporters in the development of cancer and, also in the immune
50
response towards cancer [4].
51
The ABC superfamily regulates the passage for ions and substrates, through cellular and
52
organelle membranes [4]. Transporter associated with antigen processing 1 (TAP1) protein resides in
53
the ABCB (ATP binding cassette subfamily B member) subfamily [4]. It forms a heterodimer with
54
TAP2 and functions the transportation of cytosolic proteins into the endoplasmic reticulum. The
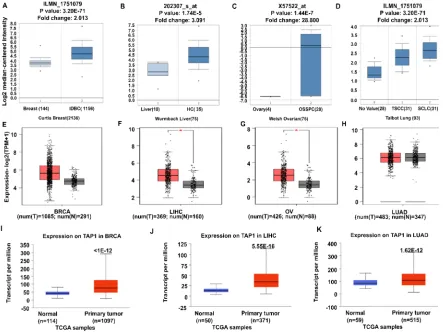
55
proteins are provided to the major histocompatibility complex I (MHC-I), which presents antigenic
56
peptides to get rid of the antigens by the help of cytotoxic T-cells. [5, 6] [7]. This immunological
57
response can be used in detecting tumor cells by tumor antigen presentation. It has been reported
58
that mutant TAP1 can hamper the MHC-I function of tumor surveillance [8]. As TAP1 influences the
59
tumor detection and without TAP1 the function of transporter (TAP) protein family and antigen
60
detection is insufficient, it can be utilized as a target to treat cancer patients via immunotherapy [9].
61
Most of the failure in chemotherapy during metastasis and invasion is occurring due to
62
multidrug resistance [10]. Therefore, it is necessary to target novel molecules, causing drug
63
resistance to decrease cancer deaths. The ABCB subfamily is known for the multidrug resistance
64
(MDR) function [11], the ability in which the cells confer simultaneous resistance to drugs of
65
different forms and structures. Thus, causes anti-cancer drug resistance [12]. ABC transporters limit
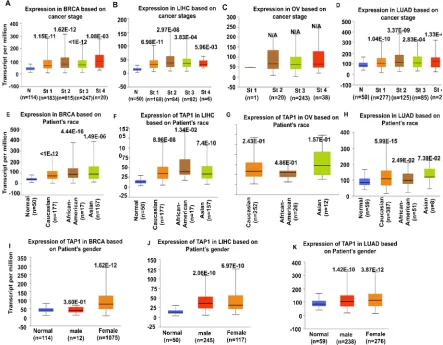
66
anti-cancer drug uptake, increases the action of efflux pump, affects cell and organelle membranes
67
[3], blocks cell death by anti-cancer drugs [13], detoxifies the drugs [14] and alters the cell cycle
68
which nullifies the effect of the drugs on tumor cells [15]. It was discovered that TAP1 and
69
P-glycoprotein domains, encoded by the ABCB1 gene, are homologically similar to binding sites and
70
both might contribute to MDR [16]. The ABCB1 effluxes drugs/substrates from the cell membrane
71
and is resistant to anti-cancer drugs like anthracyclines, taxanes, and many other compounds [17].
72
While TAP1 upregulation has been linked to better targeting of tumor cells, there is
73
contradictory evidence that shows the overexpression of TAP1 in cancer cells [18]. There are
74
associations of TAP1 in cancer involving various immune responses and analytical data of the TAP1
75
gene for specific cancers will help study the gene, as well as concluded if it should be used as a
76
biomarker.
77
2. Results
78
2.1. The TAP1 Gene Expression in Different Kinds of Cancer
79
In order to analyses the mRNA expression for the TAP1 gene in different kinds of cancer, we
80
used three databases. We used ONCOMINE to look into the comparison of TAP1 mRNA expression
81
for different cancer and their healthy cells (Figure 1A). The mRNA levels were overexpressed in the
82
bladder, brain and central nervous system (CNS), breast, cervical, head and neck, kidney, liver,
83
lymphoma, ovarian and pancreatic cancers while under-expressed only in the lung cancer, unlike
84
the healthy tissues. The GEPIA2 server was then used to study the profile of TAP1 expression levels
85
in multiple cancer types (Figure 1B). The data was extracted from TCGA, where we inquired in 33
86
tumor types paired with their normal samples for the mRNA expression of TAP1. We saw that
87
among other cancer types, BRCA (breast cancer), LIHC (liver hepatocellular carcinoma), LUAD
(lung adenocarcinoma), and OV (ovarian cancer) were significantly overexpressed. We also
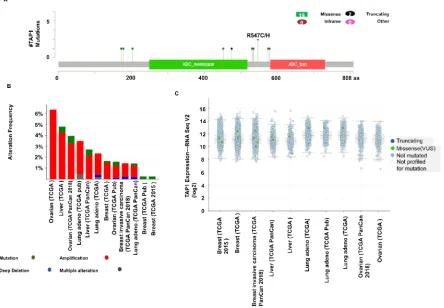
89
analyzed the TAP1 expression for different tumors and their respective counterparts using GENT2
90
(Figure 1C). The mRNA expression was high for breast, liver lung and ovary compared to the
91
normal tissues.
92
93
94
Figure 1. Expression of TAP1 in different cancers kinds: (A) cancer vs. normal upregulation (red) and
95
downregulation (blue) in left and right columns, respectively, with default parameters of a p-value:1E-4, fold
96
change: 2 and a % gene ranking: 10% for expression of mRNA in the ONCOMINE database (B) mRNA
97
transcription profile for TAP1 in various cancer kinds were detected by TCGA database via GEPIA2 (Gene
98
expression Profiling Interactive Analysis 2) website. In the dot plot, the red plot represents a tumor, and the
99
green plot represents normal tissues. Each dot represented the expression of samples. The tumor specimens
100
were compared to their counterparts to observe the expression criteria. (C) TAP1 expression profile in different
101
cancers and its counterparts were detected through Gene Expression across normal and tumor tissue (GENT 2)
102
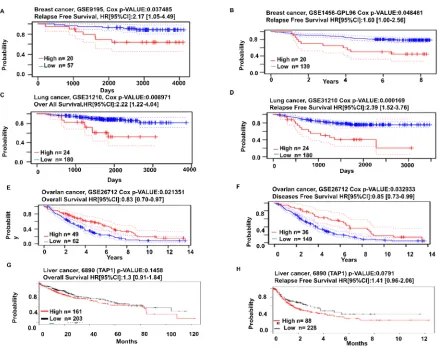
with boxplot, where boxes with red color indicate cancer cells, boxes with blue color indicate normal cells, the
103
middle line shows the median and the dots are the outliers.
104
105
2.2. The Pattern of TAP1 Expression in Breast, Lung, Liver and Ovarian Cancer
106
We further investigated the TAP1 gene expression pattern in various cancer kinds (Figure
107
2). We used the ONCOMINE database to observe the gene expression and fold changes. It was
108
proceeded by considering four cancer types: breast, lung, liver, and ovarian cancers. The expression
was seen to be upregulated in breast, liver, ovary, and lung cancers (Figure 2A-2D). The GEPIA2 tool
110
was used to look into the expression of the TAP1 gene (Figure 2E-2H), where the expression levels
111
for LIHC and OV cancers were significantly higher than the normal tissues. The expression in the
112
primary tumor and the normal was compared using the TCGA database in the UALCAN tool
113
(Figure 2I-2K). A significant overexpression for the TAP1 expression was seen in the primary tumor
114
in comparison with the normal in BRCA, LIHC, and LUAD.
115
116
117
Figure 2. Cancer vs. normal comparison was observed in various cancers for the pattern of TAP1 expression.
118
Box plot analysis for changes in the fold of TAP1 (log2 transformation of gene expression change) was
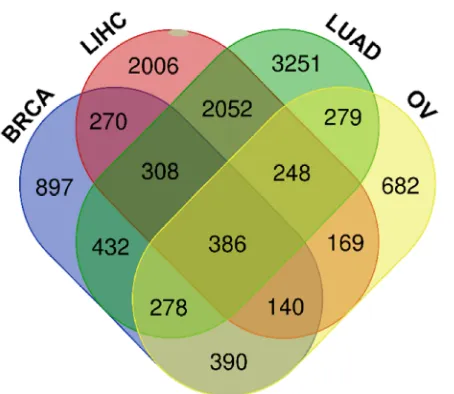
119
conducted using four cancers namely: breast, liver, lung and ovarian cancer where the left plot represents
120
normal and right plot represents tumor cells, and the highest and lowest levels are shown by an asterisk (A-D)
121
using the ONCOMINE analytical tool. (A) Invasive Ductal Breast Carcinoma, (B) Hepatocellular Carcinoma, (C)
122
Ovarian Serous Surface Papillary Carcinoma, (D) Tongue Squamous Cell Carcinoma, Squamous Cell Lung
123
Carcinoma. (E-H) The analytical expression pattern investigation of TAP1 was conducted by GEPIA2 utilizing
124
ANOVA differential method with threshold value: *p-value: 0.01. (I-K) UALCAN web and TCGA samples were
125
used to analyses the expression of TAP1 in primary tumor vs. normal cells.
126
127
2.3. Expression Analysis of TAP1 Gene with Clinical Characteristics
128
We analyzed the expression of the TAP1 gene with different clinical characteristics using the
129
UALCAN online database. The expression of the TAP1 gene in normal tissue was compared with
130
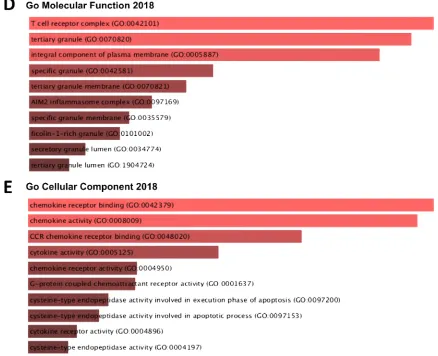
tissues in patients with different clinical outcomes for breast, liver, lung, and ovarian cancers (Figure
3 and Supplementary Table 1). Overexpression of TAP1 gene in cancer patient compared to normal
132
tissue was most in stage 2 for LUAD and LIHC cancer in four stages of cancer, stage 4 and stage 2
133
were among the highest for BRCA. Stage 3 had the least level of expression for TAP1 in BRCA, and
134
stage 4 and stage 1 was among the lowest for LIHC and LUAD (Figure 3A, B, D). There was no
135
significant TAP1 expression in ovarian cancer (Figure 3C). Overexpression of the TAP1 gene in
136
cancer patients compared to normal tissue was most for Asians in BRCA, LUAD, and OV. African
137
Americans had a high value for LIHC and lowest for OV and LUAD, whereas Caucasians had the
138
lowest rate for BRCA and LIHC (Figure 3E-H). TAP1 gene was over-expressed in females having
139
breast cancer than males (Figure 3I). TAP1 overexpression was more for females in comparison with
140
males in all cancers (Figure 3J-K).
141
142
Figure 3. The relationship of the expression of TAP1 with different clinical characteristics in cancer affected
143
people was shown in a box plot where the TAP1 mRNA expression level was detected through the UALCAN
144
web. (A-D) Expression analysis for patient’s attributes based on specific cancer stages for BRCA, LIHC, OV, and
145
LUAD, respectively. (E-H) The expression for the patient’s race for BRCA, LIHC, OV, and LUAD, and based on
146
a patient’s gender (I-k) for BRCA, LIHC, and LUAD, respectively.
147
148
2.4. Promoter Methylation of TAP1 Gene with Clinical Characteristics
149
We analyzed the level of TAP1 gene promoter methylation with different clinical
150
characteristics using the UALCAN online database. The promoter methylation of the TAP1 gene in
151
normal tissue was compared with tissues in patients with different clinical outcomes for breast, liver,
lung, and ovarian cancer (Figure 4 and Supplementary Table 2). Promoter methylation was
153
increased slightly in tumor samples (Figure 4A-C). Compared to normal tissue, patients having
154
stage1 and stage 3 breast cancer have increased promoter methylation and decreased promoter
155
methylation for stage 4 (Figure 4D), patients having liver cancer had the highest promoter
156
methylation in stage 3 and 1, and stage 4 had the lowest methylation in promoter among the four
157
stages (Figure 4E), patients having stage 3 and stage 4 lung cancer had more increased promoter
158
methylation than stage 1 and 2 in lung cancer (Figure 4F). Compared to normal tissue, Caucasian
159
patients had increased promoter methylation in BRCA, LIHC, and OV, and African American
160
patients had decreased methylation suffering from all cancers. Asians have the highest methylation
161
in LUAD (Figure 4G-I). In breast, liver, and lung cancer, TAP1 promoter methylation has increased
162
for males and is approximately unchanged for females compared to normal tissue (Figure 4J-L).
163
164
Figure 4. The relationship of the promoter methylation of TAP1 with different clinical characteristics in cancer
165
affected people was shown in a box plot where the TAP1 mRNA promoter methylation level was detected
166
through the UALCAN web. (A-C) The level of methylation of the primary tumor and in the counterparts in
167
BRCA, LIHC, and LUAD, respectively. (D-F) Promoter methylation level for patient’s characteristics based on
168
specific cancer stages for BRCA, LIHC, and LUAD, respectively. (G-I) Promoter methylation level for the
169
patient’s race for BRCA, LIHC, and LUAD and based on a patient’s gender (J-L) for BRCA, LIHC, and LUAD,
170
respectively. The beta value ranges from 0.076-0.226 (unmethylated-full methylated), which indicates DNA
171
2.5. Mutant mRNA, Gene Mutations and Copy Number Alterations of TAP1
173
By utilizing the cBioPortal database, genetic alteration of TAP1 in different cancers were
174
studied. Generated database queried to observe the genetic mutation of TAP1 in 7504 specimens
175
from 28 cases of breast, lung, liver, and ovarian cancers. Of the total queried samples, there was a 2%
176
alteration in the gene set or pathways with the somatic mutation frequency of 0.4%. Considering
177
multiple sample studies, in total 21 mutations, including 12 duplications, were reported for the
178
TAP1 gene area. (Figure 5A). We observed between 1 and 808 amino acids in the TAP1 pro-peptide
179
and TAP1 domain for the query. Amidst those mutations, 19 were missense, and 2 truncating
180
mutations were identified thoroughly. Breast adenocarcinoma and lung cancer had the highest level
181
of mutations found in them, and the mutations laid among a hotspot in R547C/H. A complete
182
formulation was identified in the R547C/H. The site contained mutations, such as missense
183
mutations, that were discovered in 8 breast adenocarcinoma specimens, 2 lung cancer expressed
184
nonsense mutations. For ovarian cancer datasets, alteration frequency was found highest (>6%)
185
among four cancer types (Figure 5B). Consequently, it generated the expression of TAP1 mRNA
186
(RNA Seq V2) among 12 cases of cancers by utilizing the cBioPortal (Figure 5C). Breast cancer, 6
187
cases, had the highest level of mutation in mRNA expression, and subsequently, the bladder cancer
188
was next in mutation with 4 affected.
189
190
Figure 5. Analysis of expression of mutant mRNA, gene mutations, and copy number alterations of tap1 gene
191
for different cancer studies using cBioPortal. (A) 21 Mutations were observed on samples between 1 and 808
192
amino acid residues in between pro-peptide and domain of TAP1 protein. (B) The frequency of alteration
193
showing: mutations (green), amplification (red), deep deletion (blue), and multiple alterations (gray) was
194
blue), a missense mutation (green), no mutation (light blue), and mutation not profiled (white) in TAP1
196
expression by RNA-Seq V2 method for a sample of 12 studies.
197
2.6. Prognostic Investigation for the TAP1 Expression among Cancer Patients
198
Different categories of cancer were considered for the prognosis of TPA1 mRNA expression
199
and we summarized the data using the prognostic databases with Cox p-value of a significance of
200
(p<0.05). To analyze the interaction as for the expression of TAP1 with the ratio of survival for breast,
201
lung, liver, and ovarian cancer patients, the PrognoScan database was used. In case of breast cancer,
202
GSE9195 and GSE1456-GPL96 sets provided data that patients with decreased expression of TAP1
203
gene (n = 57 and n = 139 respectively) had significant higher relapse-free survival in comparison with
204
the ones with a greater expression of TAP1 (n = 20, for both) (Figure 6A-6B). The results found for the
205
lung cancer dataset had the same consequences as the breast cancer results, for OS and RFS (Figure
206
6C-6D). Here the GSE31210 and GSE31210 datasets of lung cancer exhibited that the low expression
207
(n = 180, for both) of TAP1 mRNA exhibited a significantly higher OS in comparison with the higher
208
TAP1 mRNA expressed (n= 24, for both cases) group. On the other hand, the analysis of dataset
209
GSE26712 and GSE26712 of PrognoScan showed significantly lower OS and DFS of ovarian cancer,
210
for the lower TAP1 mRNA expression (n = 62 and n = 149, respectively) in contrast with the higher
211
levels of counterparts (n= 49 and n = 36, respectively) (Figure 6 E-6F). For in lower TAP1 expression
212
group (n= 203 and n= 228 respectively) on KM plotter for liver cancer high survival ratio was
213
reported in case of OS and RFS, respectively, compared to the higher expression of the counterparts
214
(n =161 and n = 88, respectively) (Figure 6G-6H). Primarily, the data-focused that indifferent to the
215
single ovarian cancer difference in the expression, high TAP1 expression is in a positive correlation
216
with the low recovery rate in breast, lung, and liver cancers.
219
Figure 6. Analysis of patient survival on TAP1 expression in different cancers. The probability of affected
220
people surviving with high (red) and low (blue) TAP1 expression. The plots were analyzed for cancers: (A–B)
221
relapse-free survival in breast, (C–D) overall survival and relapse-free survival in lung, (E-F) overall survival
222
and disease-free survival in ovarian and (G-H) overall survival and relapse-free survival in the liver, were
223
retrieved from the PrognoScan Database, with cox p-value of 0.05. The probability of survival with high (red)
224
and low (black) TAP1 expression curve concerning time in liver cancer (G-H) were retrieved from the KM
225
plotter.
226
2.7. Analyses of Pathway and Gene Ontologies of co-expressed genes of TAP1
227
Lastly, we figured out the genes that positively correlated with the TAP1 gene in BRCA,
228
LIHC, LUAD, and OV cancer by using the R2 genomics analysis and visualization platform
229
(Supplementary Table 3). The correlated genes were used in Venn Draw to draw a Venn diagram
230
giving us the common correlated genes in BRCA (3101 genes), LIHC (5580 genes), LUAD (7235
231
genes), and OV cancer (2572 genes) (Figure 7 and Supplementary Table 4).
233
Figure 7. Venn diagram of positively correlated genes to the TAP1 gene for BRCA, LUAD, LIHC, and OV,
234
collected from the Draw Venn web tool and R2 genomics web-based tool.
235
We extracted the positively correlated common genes to conduct an ontology investigation.
236
We used the Enrichr software in order to understand which signaling pathways were influenced by
237
the positively co-expressed genes and the TAP1 gene in BRCA, LIHC, LUAD, and OV. In the
238
pathway analysis of the KEGG database (Figure 8A), We saw that the most correlated 10 Kyoto
239
Encyclopedia of Genes and Genomes (KEGG) pathway of TAP1 and the gene which are in positive
240
correlation with TAP1, were primarily associated with cytokine-cytokine receptor pathway,
241
chemokine signaling pathway, hematopoietic cell lineage, primary immunodeficiency, rheumatoid
242
arthritis, cell adhesion molecules, Chagas disease, toll-like receptor signaling pathway, Salmonella
243
infection, and human immunodeficiency virus-1 infection. Cytokine-cytokine receptor pathway and
244
chemokine signaling pathway being the most significant pathways to be influenced (Figure 8A).
245
Panther database showed more significant interaction with inflammation mediated by chemokine
246
and cytokine signaling pathways. It also showed pathways like T cell activation, FAS signaling
247
pathway, cytoskeletal regulation by Rho GTPase, apoptosis signaling pathway, Huntington disease,
248
B cell activation, integrin signaling pathway, cell cycle and SSKR signaling map ST (Figure 8B). The
249
Enrichr tool also performed a gene ontology analysis to explore the different processes based on the
250
co-expressed genes. The co-expression in biological processes was most significant for chemokine
251
mediated signaling pathway (GO 0070098), inflammatory response, and lymphocyte chemotaxis
252
(Figure 8C). In molecular functions, the T cell receptor complex, tertiary granule, and integral
253
component of the plasma membrane (Figure 8D), and in GO cellular component, the chemokine
254
receptor binding and chemokine activity were mostly influenced (Figure 8E).
257
Figure 8. Signaling analysis of pathways and ontologies of genes with positive correlation with the TAP1 gene
258
in BRCA, LUAD, LIHC, and OV was presented graphically using Enricher Web. (A)Kyoto Encyclopedia of
259
Gene and Genomes (KEGG) Human pathways 2019, (B) Panther 2016, (C) Enrichment of GO Biological Process
260
(2018) terms in proteomic analysis, (D) Enrichment of GO Molecular Function (2018) terms in proteomic
261
analysis, (E) Enrichment of GO Cellular Component (2018) terms in proteomic analysis. Generated bars,
262
representing the ratio: % composition of terms in proteomic data: % composition of genomic annotation, are
263
ranked by p-value.
264
3. Materials and Methods
265
Differential expression of TCGA (The Cancer Genome Atlas) samples for different cancer
266
was observed in comparison with normal complements through the ONCOMINE database
267
(https://www.ONCOMINE.org/resource/login.html) [19]. The analysis of expression level was
268
conducted considering a threshold parameter of; p-value: 1E-4, fold change: 2, gene ranking: 10%.
269
The expression profile for genes throughout different cancer and their complementary normal
270
specimens was detected through the GEPIA2 website (http://gepia2.cancer-pku.cn/) [20] and GENT2
271
online platform (http://gent2.appex.kr/gent2/) [21] with default parameters. The GTEx
272
(Genotype-Tissue Expression) data and TCGA data were matched by the ANOVA differential
273
method and were used to detect the expression with default threshold settings through the GEPIA2
274
website.
275
TCGA sample gene expression and promoter methylation analysis was conducted with the
276
UALCAN website (http://ualcan.path.uab.edu/index.html) by comparing the TPM (transcript per
million) and beta value count of a healthy patient with patients having cancer, cancers patients with
278
different cancer stage, cancer patients of different race and gender [22].
279
The number and location of the mutations in the peptide sequence were detected using
280
cBioPortal (http://www.cbioportal.org/) [23, 24]. Frequency of alteration (Mutation, Amplification,
281
Deep Deletion and Multiple Alterations) was investigated using the cBioPortal web. It helped to
282
analyze the RNA seq V2 profile sorted by cancer study for TAP1 expression [23, 24].
283
Transcriptional expression of TAP1 protein and its relation to patient survival in cancer
284
patients was examined via PrognoScan and Kaplan–Meier plotter was utilized in examining the
285
effect on overall survival (OS), relapse-free survival (RFS) and Diseases Free Survival (DFS) by
286
multivariate and univariate investigation of TAP1 expression with p-value: 0.05 as a parameter [25].
287
The genomic investigation and visualization platform R2: Genomics Analysis and
288
Visualization Platform (https://hgserver1.amc.nl/) was used to find the positively co-expressed
289
genes of TAP1 OF TCGA sample for breast, liver, lung, and ovarian cancer. Venn diagrams
290
(http://bioinformatics.psb.ugent.be/webtools/Venn/) was used to determine the common positively
291
co-expressed genes of all the cancers. Enricher (http://amp.pharm.mssm.edu/Enrichr/enrich#) was
292
used to present the pathways and ontologies sorted by p-value ranking as a bar diagram for the
293
common positively co-expressed genes with default parameters [26].
294
4. Discussion
295
TAP protein portrays a crucial role in the MHC I pathway as it is responsible for delivering
296
proteins to endoplasmic reticulum from cytosol, utilizing the energy harvested by ATP hydrolysis.
297
The peptides are then displayed by MHC I in the infected cells so that it will be identified by the T
298
cells [7]. Because of its role in tumor antigen presentation, it can be used in cancer immunotherapy
299
[27]. The TAP protein constitutes of TAP1 and TAP2 heterodimers that are highly significant for the
300
antigen presentation and a defect in one of the genes can conclude to an unstable TAP protein [28].
301
An adequate TAP protein cannot perform properly and lead to improper tumor antigen
302
presentation and evasion of cancer immunity.
303
The tumor cells present tumor antigens, which are detected and killed by cytotoxic T cells.
304
TAP1 gene codes, a transporter protein which being a component of MDR/TAP of ABC transporter
305
family, has a vital role in chemotherapeutic drug resistance [29]. The TAP1 encoded protein is
306
involved in the processing of antigens it contributes to anti-cancer drug resistance and hence, has an
307
effect on the survival rates of patients and can play a part in cancer progression due to its MDR
308
activity.
309
As tumor deaths depend on the transportation of proteins with the help of TAP1, it becomes
310
a prospective biomarker for cancer. Though low TAP1 expression is related with tumor
311
development and alteration of TAP1 may lead to evasion of cytotoxic T-cell killing of some cancer
312
cells [30], but studies are downregulating TAP1 as a way to promote neoantigens as tumor
313
immunity [31]. The consideration of microenvironment for tumor seems essential regarding the
314
expression of a gene as TAP1 as its regulation may be determined by proteins like STAT1 and IRF1.
315
Therefore, resulting in varied expressions of the gene in different cancers [32]. We need analytical
316
data to show the standpoint of TAP1 in various cancers. It is vital to have a systematic report for
317
TAP1 in order to evaluate approaches towards future treatment. We, here, gather computational
318
integrative omics data analysis for TAP1 in multiple cancers.
In previous studies, we have seen defective TAP protein resulting in an inadequate tumor
320
antigen presentation, leading to tumor progression [33]. A decreased level of TAP1 was related to
321
various cancers, for example, cancer of the colon [34], lung [35], and cervix [36]. A differential TAP1
322
expression has been linked to the liver [37] and renal cancer [32]. Studies also reported that a higher
323
expression of TAP1 mRNA was found in stage II breast tumors and an increased level of expression
324
was identified in high-grade breast cancers [38]. To understand the role of TAP1 expression in
325
different cancers, we used ONCOMINE, GEPIA2, and GENT2 databases, where we got an increase
326
in expression for breast, liver, lung, and ovarian cancers, and a contrasting underexpression for lung
327
cancer in the ONCOMINE analysis. We could sum up from our analysis that overall, TAP1 has a
328
high expression in these cancers.
329
We focused on the expression of TAP1 in four cancers kinds, breast, liver, lung, and ovarian
330
cancers, next. The analytical expression pattern in these cancers gave us a clearer idea about the
331
regulation of the gene in each cancer and the fold change in the expression in cancer in comparison
332
with the normal one in the ONCOMINE database. It provided us with data regarding the
333
quantitative difference between normal and cancer cells, where all the cancers showed a noticeable
334
fold change in the TAP1 expression. A significant rise in the expression of Liver Hepatocellular
335
Carcinoma and ovarian cancer was seen in the ULCAN web. The TCGA database showed primary
336
tumors to have a significant increase in expression for BRCA, LIHC, and LUAD. For both the
337
analysis, we found that LIHC had a higher expression. As reported earlier, TAP1 expression is
338
increased multi-fold times in patients affected with the hepatitis C virus, which is a significant factor
339
of liver cancer [39] [40].
340
Furthermore, we wanted to see if a patient with cancer had any clinical characteristics
341
related to the TAP1 gene and how it varies in different cancers. We found that for BRCA, LIHC, and
342
LUAD, all had a high expression of TAP1 gene for stage 2 carcinomas, providing us with evidence
343
that TAP1 is still present with an increased amount in stage 2 tumor in various cancers. The
344
expression pattern fluctuates throughout the stages. In BRCA, it was low for the first stage and
345
increased in the second, decreased substantially in stage 3, and increased again in stage 4. LIHC and
346
LUAD, both had a similar pattern in terms of expression. We reported an increase in expression for
347
stage 2 and stage 3, and a decrease for stage 1 and stage 4. An explanation for such fluctuating
348
results could be that the immune infiltrates are present in the cells, which induce interferon-gamma,
349
and that induces TAP1 [38]. The IFN-y induction results when tumor cells escape targeting and
350
INF-y induces TAP1 to trigger tumor detection as a part of the immune response. The study
351
highlighted the relationship of ethnicity and gender with the pattern of TAP1 expression, with
352
significant results.
353
Epigenetically changed DNA sequences contribute to gene expression and promoter
354
methylation can downregulate the gene expression in cancers. It is expected that proteins in HLA/
355
MHC complex will be downregulated in tumors [41]. The promoters of the TAP1 gene were seen to
356
be methylated in primary tumors, but the Stage 2 tumors tend to have a lower methylation rate,
357
which acknowledges our result with expression patterns. Furthermore, lung cancer patients, stage 3
358
and stage 4 lung cancer have more increased methylation, and for breast cancer, the lowest promoter
359
methylation was for stage 4, and LIHC had the highest methylation for stage 3. Methylation in the
360
promoter may conclude in inhibition of the gene transcription [42] and thus, contribute to the
361
expression pattern according to this study. The ULCAN analysis for different races TAP1 expression
362
we found Caucasians to have high methylation for BRCA, LIHC, and OV, and Asians were found to
have the highest methylation for LUAD. Males had more methylated promoters than females,
364
congruent with the high expression patterns in females for TAP1.
365
Exploration of the copy numbers, types of mutations, and alteration of the genome will help
366
understand the function of the TAP gene in cancer progression. A change such as these can result in
367
altered gene expression [43]. Previously, we saw that lung cancer caused by impaired human
368
leukocyte antigen (HLA)- 1 complex had altered the TAP1 gene. The TAP1 gene influences the
369
HLA-1 complex maturation. An altered TAP1 gene results in an ineffective HLA-1 complex and
370
helps escape tumor detection by the immune cells [44, 45]. So, we looked into the mutations in the
371
TAP1 domain using the cBioPortal database. Mutation sites were analyzed, and 21 mutations were
372
found between 1 and 808 amino acids of TAP1 propeptide and TAP1 domain, in which 19 were
373
missense and 2 were truncating. The mutation hotspot, R547C/H, was in between 500 and 600 amino
374
acid residues. In query for the frequency of alteration, the highest frequency occurred in ovarian
375
cancer with (>6%), and the highest mutant mRNA in RNA Seq V2 was found in breast cancer.
376
It was essential to see if TAP1 affected the survival rate of patients with various cancers. We
377
investigated breast, liver, lung, and ovarian cancers patients’ prognosis related to the TAP1
378
expression. The database PrognoScan, a microarray database, and km plotter were used to achieve
379
the data for survival rate. Prognostic analysis on the liver, lung, and breast cancers showed a
380
negative correlation for TAP1 expression and overall, relapse-free and/or disease-free patient
381
survival. However, for ovarian cancer, the survival curve was higher for higher TAP1 expression.
382
Giving us an expression that with an increased level of TAP1, there is a weaker probability of
383
survival for the mentioned cancers. We analyzed the positively coexpressed genes with TAP1 and
384
produced a Venn diagram using R2 genomics and Venn Draw to get the common correlated genes in
385
BRCA, LIHC, LUAD, and OV. The identification of different pathways influenced by TAP1 and the
386
common correlated genes can give us an idea about the mechanisms possibly being affected. An
387
ontology analysis was performed using Enrichr. In KEGG pathway analysis, cytokine-cytokine
388
receptor and chemokines seem to be most influenced. Cytokine receptors are involved in the
389
initiation of JAK and signal transducer and activation of the transcriptions (STAT) pathway.
390
JAK-STAT pathway stops the progression of tumor cells via tumor surveillance, but an excessive
391
activation of this pathway was found in malignant tumors [46]. An inflammatory response caused
392
by cancer results in a rise in chemokines [47]. Panther pathway showed a positive correlation with
393
inflammation mediated by chemokine and cytokine signaling pathways. The GO pathways looked
394
into the biological, cellular, and molecular pathways. Other than chemokines and inflammatory
395
response, a significant interaction was with lymphocytes chemotaxis, which is responsible for
396
migrating T cells into the tumor microenvironment [48]. Moreover, T cell receptor complex and
397
tertiary granule and integral component of the plasma membrane were influenced, too, which are an
398
indication of the immune response.
399
5. Conclusion
400
In our study, we did a computational analysis of the TAP1 gene in multiple cancers. We
401
found a correlation between the TAP1 gene and tumor progression. The analytical mining sites were
402
used, such as ONCOMINE, GEPIA2, GENT2, KM plotter, UALCAN, etc., to get relevant data.
403
Accompanied by the gene expression pattern in different cancer stages, ethnicity, and gender, we
404
looked into the promoter methylation too. We figured out the downregulation of promoter
methylation can play a part in TAP1 regulation, analyzed a negative correlation for gene expression
406
and the survival rate, reported the mutation in TAP1, frequency alteration, and the pathways of
407
correlated genes. We used different prognostic tools to get an idea about the gene in different
408
cancers and our data had some interesting insights. Further investigations are needed in order to
409
understand the TAP1 role in cancer progression, tumor immune evasion and possible biomarker.
410
411
Supplementary Materials: Table S1: Correlation of TAP1 expression for normal vs. different cancer patients
412
and the clinicopathological parameters (TCGA data), Table S2: Promoter methylation of TAP1 in various
413
clinicopathological parameters of different cancers (TCGA data), Table S3: R2 genomics analysis and
414
visualization platform, Table S4: Common positively co-expressed genes.
415
Authors Contributions: AS, FA and TMK designed the project; TCD performed the analysis of data; AT and
416
MSS evaluated and interpreted the results; RA, TCD, AT and MSS prepared the draft manuscript; AS, TMK and
417
FA critically reviewed and finalized the manuscript. Finally, all authors approved the final version for journal
418
submission.
419
Funding: Not applicable.
420
Acknowledgments: The authors like to thank the Deanship of Scientific Research (DSR), King Abdul-Aziz
421
University and Biological Solution Centre (BioSol Centre), for their technical support.
422
Conflict of Interest: All authors declared no conflict of interest.
423
Abbreviations:
424
ABC ATP-binding cassette
ABCB ATP binding cassette subfamily B member
BRCA Breast cancer
CNS Central nervous system
DFS Diseases free survival
GTEx Genotype -tissue expression
HLA Human leukocyte antigen
IRF Interferon regulatory factor
LIHC Liver hepatocellular carcinoma
LUAD Lung adenocarcinoma
MHC-I Major histocompatibility complex
MDR Multidrug resistance
OV Ovarian cancer
OS Overall survival
RFS Relapse free survival
STAT Signal transducer and activator of transcription
TCGA The cancer genome atlas
TPM Transcript per million
TAP Transporter
TAP1 Transporter associated with Antigen Processing 1
References
426
1. F. Bray, J. Ferlay, I. Soerjomataram, R. L. Siegel, L. A. Torre, and A. Jemal, "Global cancer statistics 2018:
427
GLOBOCAN estimates of incidence and mortality worldwide for 36 cancers in 185 countries," CA: A
428
Cancer Journal for Clinicians, vol. 68, no. 6, pp. 394-424, 2018/11/01 2018.
429
2. R. L. Siegel, K. D. Miller, and A. Jemal, "Cancer statistics, 2019," (in eng), CA Cancer J Clin, vol. 69, no. 1,
430
pp. 7-34, Jan 2019.
431
3. M. M. Gottesman, "Mechanisms of cancer drug resistance," Annual review of medicine, vol. 53, no. 1, pp.
432
615-627, 2002.
433
4. M. Dean, Y. Hamon, and G. Chimini, "The human ATP-binding cassette (ABC) transporter superfamily,"
434
Journal of lipid research, vol. 42, no. 7, pp. 1007-1017, 2001.
435
5. R. Abele and R. Tampë, "Function of the transport complex TAP in cellular immune recognition,"
436
Biochimica et Biophysica Acta (BBA)-Biomembranes, vol. 1461, no. 2, pp. 405-419, 1999.
437
6. B. Lankat-Buttgereit and R. Tampé, "The transporter associated with antigen processing TAP: structure
438
and function," FEBS letters, vol. 464, no. 3, pp. 108-112, 1999.
439
7. R. Abele and R. Tampé, "The ABCs of immunology: structure and function of TAP, the transporter
440
associated with antigen processing," Physiology, vol. 19, no. 4, pp. 216-224, 2004.
441
8. L. Van Kaer, P. G. Ashton-Rickardt, H. L. Ploegh, and S. Tonegawa, "TAP1 mutant mice are deficient in
442
antigen presentation, surface class I molecules, and CD4-8+ T cells," (in eng), Cell, vol. 71, no. 7, pp.
443
1205-14, Dec 24 1992.
444
9. Y. Lou et al., "Restoration of the Expression of Transporters Associated with Antigen Processing in Lung
445
Carcinoma Increases Tumor-Specific Immune Responses and Survival," Cancer Research, vol. 65, no. 17, p.
446
7926, 2005.
447
10. M. F. Ullah, "Cancer multidrug resistance (MDR): a major impediment to effective chemotherapy," Asian
448
Pac J Cancer Prev, vol. 9, no. 1, pp. 1-6, 2008.
449
11. V. Vasiliou, K. Vasiliou, and D. W. Nebert, "Human ATP-binding cassette (ABC) transporter family,"
450
Human genomics, vol. 3, no. 3, p. 281, 2009.
451
12. C.-P. Wu, C.-H. Hsieh, and Y.-S. Wu, "The emergence of drug transporter-mediated multidrug resistance
452
to cancer chemotherapy," Molecular pharmaceutics, vol. 8, no. 6, pp. 1996-2011, 2011.
453
13. S. W. Lowe, H. E. Ruley, T. Jacks, and D. E. Housman, "p53-dependent apoptosis modulates the
454
cytotoxicity of anti-cancer agents," Cell, vol. 74, no. 6, pp. 957-967, 1993.
455
14. S. V. Ambudkar, S. Dey, C. A. Hrycyna, M. Ramachandra, I. Pastan, and M. M. Gottesman, "Biochemical,
456
cellular, and pharmacological aspects of the multidrug transporter," Annual review of pharmacology and
457
toxicology, vol. 39, no. 1, pp. 361-398, 1999.
458
15. W. S. Dalton and R. J. Scheper, "Lung resistance-related protein: determining its role in multidrug
459
resistance," Journal of the National Cancer Institute, vol. 91, no. 19, pp. 1604-1605, 1999.
460
16. M. A. Izquierdo, J. J. Neefjes, A. E. L. Mathari, M. J. Flens, G. L. Scheffer, and R. J. Scheper,
461
"Overexpression of the ABC transporter TAP in multidrug-resistant human cancer cell lines," British
462
Journal of Cancer, vol. 74, no. 12, pp. 1961-1967, 1996/12/01 1996.
463
17. J.-P. Gillet, T. Efferth, and J. Remacle, "Chemotherapy-induced resistance by ATP-binding cassette
464
transporter genes," Biochimica et Biophysica Acta (BBA)-Reviews on Cancer, vol. 1775, no. 2, pp. 237-262, 2007.
465
18. H. Lage et al., "Enhanced expression of human ABC-transporter tap is associated with cellular resistance
466
19. D. R. Rhodes et al., "ONCOMINE: a cancer microarray database and integrated data-mining platform," (in
468
eng), Neoplasia, vol. 6, no. 1, pp. 1-6, Jan-Feb 2004.
469
20. Z. Tang, C. Li, B. Kang, G. Gao, C. Li, and Z. Zhang, "GEPIA: a web server for cancer and normal gene
470
expression profiling and interactive analyses," Nucleic acids research, vol. 45, no. W1, pp. W98-W102, 2017.
471
21. G. Shin, T.-W. Kang, S. Yang, S.-J. Baek, Y.-S. Jeong, and S.-Y. Kim, "GENT: gene expression database of
472
normal and tumor tissues," Cancer informatics, vol. 10, p. CIN. S7226, 2011.
473
22. D. S. Chandrashekar et al., "UALCAN: a portal for facilitating tumor subgroup gene expression and
474
survival analyses," Neoplasia, vol. 19, no. 8, pp. 649-658, 2017.
475
23. E. Cerami et al., "The cBio cancer genomics portal: an open platform for exploring multidimensional
476
cancer genomics data," ed: AACR, 2012.
477
24. J. Gao et al., "Integrative analysis of complex cancer genomics and clinical profiles using the cBioPortal,"
478
Sci. Signal., vol. 6, no. 269, pp. pl1-pl1, 2013.
479
25. H. Mizuno, K. Kitada, K. Nakai, and A. Sarai, "PrognoScan: a new database for meta-analysis of the
480
prognostic value of genes," BMC medical genomics, vol. 2, no. 1, p. 18, 2009.
481
26. M. V. Kuleshov et al., "Enrichr: a comprehensive gene set enrichment analysis web server 2016 update,"
482
Nucleic acids research, vol. 44, no. W1, pp. W90-W97, 2016.
483
27. M. Leclerc et al., "Recent Advances in Lung Cancer Immunotherapy: Input of T-Cell Epitopes Associated
484
With Impaired Peptide Processing," (in English), Frontiers in Immunology, Review vol. 10, no. 1505,
485
2019-July-03 2019.
486
28. M. Raghavan, "Immunodeficiency due to defective antigen processing: the molecular basis for type 1 bare
487
lymphocyte syndrome," (in eng), The Journal of clinical investigation, vol. 103, no. 5, pp. 595-596, 1999.
488
29. M. Dean, A. Rzhetsky, and R. Allikmets, "The human ATP-binding cassette (ABC) transporter
489
superfamily," (in eng), Genome Res, vol. 11, no. 7, pp. 1156-66, Jul 2001.
490
30. M. Leclerc, G. Guillebot De Nerville, I. Tihy, I. Malenica, L. Mezquita, and F. Mami-Chouaib, "Recent
491
advances in lung cancer immunotherapy: input of T-cell epitopes associated with impaired peptide
492
processing," Frontiers in immunology, vol. 10, p. 1505, 2019.
493
31. G. Garrido et al., "Tumor-targeted silencing of the peptide transporter TAP induces potent antitumor
494
immunity," (in eng), Nat Commun, vol. 10, no. 1, p. 3773, Aug 21 2019.
495
32. M. Kaczmarek et al., "Analysis of expression of MHC class I molecules and TAP genes in malignant
496
human cell lines," (in eng), Folia Histochem Cytobiol, vol. 45, no. 3, pp. 205-14, 2007.
497
33. A. K. Johnsen, D. J. Templeton, M. S. Sy, and C. V. Harding, "Deficiency of Transporter for Antigen
498
Presentation (TAP) in Tumor Cells Allows Evasion of Immune Surveillance and Increases
499
Tumorigenesis," The Journal of Immunology, vol. 163, no. 8, p. 4224, 1999.
500
34. A. Ling et al., "TAP1 down-regulation elicits immune escape and poor prognosis in colorectal cancer," (in
501
eng), Oncoimmunology, vol. 6, no. 11, pp. e1356143-e1356143, 2017.
502
35. H. L. Chen, D. Gabrilovich, R. Tampé, K. R. Girgis, S. Nadaf, and D. P. Carbone, "A functionally defective
503
allele of TAP1 results in loss of MHC class I antigen presentation in a human lung cancer," (in eng), Nat
504
Genet, vol. 13, no. 2, pp. 210-3, Jun 1996.
505
36. F. V. Cromme et al., "Loss of transporter protein, encoded by the TAP-1 gene, is highly correlated with
506
loss of HLA expression in cervical carcinomas," Journal of Experimental Medicine, vol. 179, no. 1, pp.
507
335-340, 1994.
508
37. K. Herzer et al., "Upregulation of major histocompatibility complex class I on liver cells by hepatitis C
509
virus core protein via p53 and TAP1 impairs natural killer cell cytotoxicity," (in eng), J Virol, vol. 77, no.
510
38. A. M. Henle, A. Nassar, D. Puglisi-Knutson, B. Youssef, and K. L. Knutson, "Downregulation of TAP1
512
and TAP2 in early stage breast cancer," (in eng), PLoS One, vol. 12, no. 11, p. e0187323, 2017.
513
39. H. B. El-Serag, "Hepatocellular carcinoma and hepatitis C in the United States," Hepatology, vol. 36, no. 5B,
514
pp. s74-s83, 2002.
515
40. K. Herzer et al., "Upregulation of major histocompatibility complex class I on liver cells by hepatitis C
516
virus core protein via p53 and TAP1 impairs natural killer cell cytotoxicity," Journal of virology, vol. 77, no.
517
15, pp. 8299-8309, 2003.
518
41. S. Qifeng, C. Bo, J. Xingtao, P. Chuanliang, and Z. Xiaogang, "Methylation of the promoter of human
519
leukocyte antigen class I in human esophageal squamous cell carcinoma and its histopathological
520
characteristics," The Journal of Thoracic and Cardiovascular Surgery, vol. 141, no. 3, pp. 808-814, 2011/03/01/
521
2011.
522
42. M. Moarii, V. Boeva, J.-P. Vert, and F. Reyal, "Changes in correlation between promoter methylation and
523
gene expression in cancer," BMC Genomics, vol. 16, no. 1, p. 873, 2015/10/28 2015.
524
43. C. Garnis, T. P. H. Buys, and W. L. Lam, "Genetic alteration and gene expression modulation during
525
cancer progression," Molecular Cancer, vol. 3, no. 1, p. 9, 2004/03/22 2004.
526
44. C. Pereira et al., "Genomic Profiling of Patient-Derived Xenografts for Lung Cancer Identifies B2M
527
Inactivation Impairing Immunorecognition," (in eng), Clin Cancer Res, vol. 23, no. 12, pp. 3203-3213, Jun 15
528
2017.
529
45. H. de la Salle et al., "HLA class I deficiencies due to mutations in subunit 1 of the peptide transporter
530
TAP1," The Journal of Clinical Investigation, vol. 103, no. 5, pp. R9-R13, 03/01/ 1999.
531
46. M. Lee and I. Rhee, "Cytokine Signaling in Tumor Progression," (in eng), Immune network, vol. 17, no. 4,
532
pp. 214-227, 2017.
533
47. L. Chen et al., "Inflammatory responses and inflammation-associated diseases in organs," (in eng),
534
Oncotarget, vol. 9, no. 6, pp. 7204-7218, 2017.
535
48. C. Y. Slaney, M. H. Kershaw, and P. K. Darcy, "Trafficking of T Cells into Tumors," Cancer Research, vol.
536
74, no. 24, p. 7168, 2014.
537
538