http://www.sciencepublishinggroup.com/j/jppa doi: 10.11648/j.jppa.20190301.14
ISSN: 2640-2688 (Print); ISSN: 2640-2696 (Online)
Development of a Disaster Safety Sentiment Index via
Social Media Mining
Seon Hwa Choi
Earthquake Hazard Reduction Center, National Disaster Management Research Institute, Ulsan, Korea
Email address:
To cite this article:
Seon Hwa Choi. Development of a Disaster Safety Sentiment Index via Social Media Mining. Journal of Public Policy and Administration. Vol. 3, No. 1, 2019, pp. 29-38. doi: 10.11648/j.jppa.20190301.14
Received: March 7, 2019; Accepted: April 28, 2019; Published: May 23, 2019
Abstract:
People use social media platforms such as Twitter to record their personal thoughts and opinions. Social media platforms reflect people’s sentiments as they are, and an accurate understanding of sentiments on social media could be useful and significant for disaster management. In this research, sentiment type modeling and sentiment quantification are proposed to understand the sentiments presented on social media platforms. Sentiment types are primarily analyzed based on the three major sentiments of affirmation, caution, and observation. Then, for a detailed understanding of sentiment progress according to the progress of a disaster or accident and the government’s response, negative sentiments are categorized into anxiety, disappointment, depression, sadness, and displeasure to enhance the analysis, while positive sentiments are categorized into pleasure, happiness, and relief; Russell’s circumplex model is used to develop a model of eight primary sentiments to acquire an overall understanding of the public’s sentiments. Then, the sentiment index of each sentiment is quantified. Based on the results, the overall sentiment status of the public is monitored, and in the event of a disaster, the public’s sentiment fluctuation rate can be quantitatively observed. Moreover, the influence of disasters and accidents on public sentiments, or the sentiment indices of different accidents, can be compared to identify the accidents that affect public sentiment and public needs after a disaster, and the insights can be used for policy-making.Keywords:
Big Data, Disaster Management, Emotion Analysis, Social Media1. Introduction
Social media has become a necessity rather than an option for users, as indicated by the skyrocketing number of social media users in recent years. Social media serves to efficiently and immediately satisfy the needs of connectedness and belonging, which are basic human needs as defined by social psychologist Maslow [1]. Likewise, social media enables users to express their thoughts and opinions as is, in a new form of space where numerous individuals are present as connected beings. Therefore, social media contains public sentiments in their raw form and can, thus, be a resource from which to extract general sentiments.
Disaster management using social media analysis can occur at two different stages. First, the rapidly changing social situation can be identified in real time. This can be used in the response stage of disaster management. Second, the reaction after the event and the demand for a specific course of action can be analyzed. This information can be
concept of debriefing to disaster management and develop systems and technologies to support a comprehensive evaluation that reflects public sentiment after a disaster has occurred.
Public sentiment that is identified via social media can serve as an important index to support policy-making for disaster management, particularly, during the response and debriefing stages of disaster management.
First, continuously monitoring changes in sentiment expressed during a disaster or dangerous situation in the response stage can help determine the optimum response time for minimizing damage. The sentiments vary as the disaster or dangerous situation develops. For instance, in analyzing the change in public sentiments throughout a day in August 2014, when there were damages due to heavy rainfall in the Busan and Gyeongnam regions in South Korea, one can find that the sentiments changed in the order of “anxiety – annoyance – seriousness – dissatisfaction.” There was a sudden increase in the sentiment of annoyance as an increasing number of citizens became annoyed by the continued heavy rainfall in the morning, before any damage had even occurred. The sentiment then changed to seriousness, when damage started to occur in various places in the afternoon. Therefore, customized disaster management could be implemented through a serious announcement to
raise awareness regarding the potential danger to citizens when there is an increase in annoyance.
Second, the debriefing stage involves periodically identifying how safe the public feels in that moment and how this perceived level of safety changes after a disaster occurs. With this information, policymakers can focus on the government’s disaster management policies to improve the public’s sense of national security. People exhibit high sensitivity through social media reactions when they feel endangered, regardless of whether they have experienced damage themselves, as observed during common disasters such as fine dust, earthquakes, and intense periods of lightning. In the case of Twitter, the number of retweets per hour is usually greater than the number of tweets per hour. However, when users sense tremors from an earthquake, or are in fear of lightning, the reverse occurs—the number of tweets exceeds the number of retweets [3]. In other words, users are prompted to share details of the frightening situation they are in and express their fear to others. When this type of behavior becomes collective, it represents public sentiment regarding safety. Therefore, this information from social media can be used to regularly monitor the public’s sense of security and can be fed back to strengthen comprehensive safety measures.
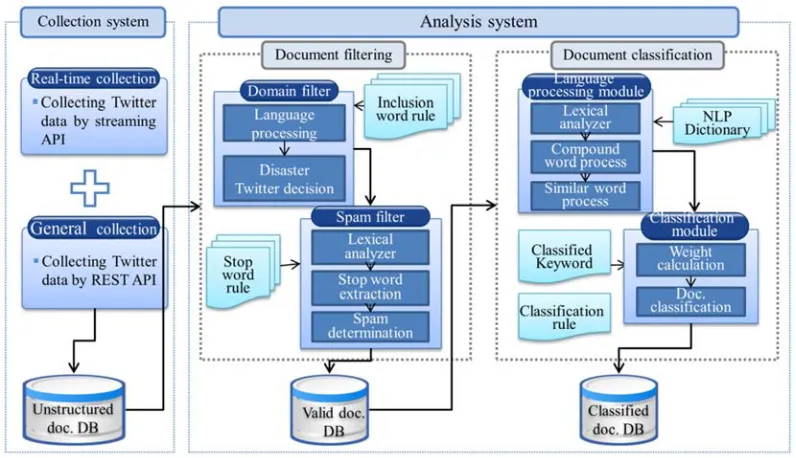
Figure 1. Language processing of Social Big Board.
Finally, in the debriefing stage, after the disaster has become prolonged or ended, public sentiment reflected through social media can be utilized in post-analysis and the policy evaluations of the government’s disaster response. This makes it possible to maintain a system for collecting opinions and feedback and communicating with the public. In the case of the 5.4-magnitude earthquake in Pohang, Korea in 2017, analyses of public sentiment showed many negative opinions, pointing to anxiety as a result of fear as well as the damage caused by earthquakes, shoddy
accommodation to participants in the College Scholastic Ability Test who were staying in the area and to victims’ families, increased the public’s sentiment of happiness. Moreover, the announcement of the Test’s postponement on the night of the earthquake, the government’s quick response over the next three days, and immediate measures in response to public demands increased the public sentiment of relief (for details, refer to Figure A1 in the supplementary information section of this paper).
To utilize public sentiment for disaster management, a fundamental technology for social media utilization first needs to be developed. To this end, a real-time social media monitoring system, Social Big Board, has been developed and is being used for research since 2013. Social Big Board is a real-time tweet monitoring system that autonomously collects tweets from Korea that are written in Korean, filters the tweets related to disaster and safety, and classifies the tweets into 71 disaster safety categories, thereby providing various pieces of information and insights such as on emerging disaster issues, tweeting frequency by region, and the original tweets [4]. This system is divided into a collection and an analysis system, as shown in Figure 1, and consists of a natural language processing engine and a text mining engine for processing Korean. It is intended to support disaster safety policies by identifying public needs, behavioral patterns, and sentiments relating to disaster safety. The Social Big Board is operated by the National Disaster Management Research Institute and has been used for expert post-disaster management analysis since 2016. Since 2017, the Ministry of the Interior and Safety has published the "Disaster Safety Analysis Results and Critical Management Disaster Safety Accidents" monthly report, which analyzes issues on social media using the Social Big Board. In addition, it provides real-time monitoring results with respect to the situation management system of the central disaster situation room.
This paper introduces the sentiment modeling and the quantification technique of sentiment indices used in Social Big Board.
2. Related Works and Disaster Sentiment
Modeling
Analyzing sentiments can be considered as related to text mining, where the meaning of a particular expression in a text is extracted [5]. In general, sentiment analysis is the process of identifying the attitude of a speaker or an author in terms of the polarity (positive or negative) of the overall context of a particular topic or document [6]. A majority of works on analyzing the sentiment of social media users focuses on developing the algorithms for analysis and refining the sentiment categories. In the analysis of positive and negative sentiments, which is the most common type of analysis, first, the positivity or negativity is determined through a context analysis to analyze the positive and negative sentiments from a large amount of unstructured data
from Twitter. If, as a result, the sentiment cannot be determined, stemming, token analysis, and stop word analysis are performed [7]. This method has been proposed as an optimal algorithm given the characteristics of big data. Unlike with previous services that analyzed only two sentiment types of positive and negative, there is a sentiment analysis technique that uses 17 categories, subdividing the polarity of positive and negative sentiments. This present work subdivided the sentiment categories based on the classification of sentiments in English-speaking countries and in Korea, to reflect the sentiment pattern in social media. By monitoring a specific keyword based on sentiment analysis with such detailed categories, one can not only perform an overall analysis of opinions in terms of positive and negative, but also further classify the positive opinions into detailed categories such as “feeling touched” or “satisfied,” and the negative opinions into categories such as “dislike” or “anger.” Since the strategy for handling an issue may vary with such sentiment categories, this method has the advantage of allowing a more accurate monitoring [8]. This technique can be useful for companies in identifying customer opinions on a product. A study on improving the accuracy of identifying preferences, acceptance, and support from social media, enhanced the performance of sentiment analysis by using various sentiment terms such as acronymized expressions (e.g., “LOL”) or emoticons, which do not comply with general grammar [9]. Another study points out that we must establish a dictionary specialized for cyberspace language to effectively perform sentiment analyses on cyberspace. To overcome the limitation of the lack of clear criteria for defining categories for social sentiments expressed through social media, this study newly defined sentiment vocabulary based on the intimacy between social media users, and used the sentiment vocabulary as the fundamental data for measuring social sentiments of humans on cyberspace, where social relationships are reflected [10].
model of Social Big Board was extended from the three original sentiment categories to five, namely anxiety, seriousness, sadness, dissatisfaction, and positive sentiments, including relief, so that sentiments can be identified in more detail. From a Twitter dataset relating to disasters, sentiment keywords during disasters were extracted and the pattern therein reviewed. Subsequently, a sentiment dictionary was established based on various expressions including general sentiment expressions, sensory expressions, descriptive expressions, evaluative expressions, noun phrases, adjective phrases, and adverbs. Moreover, sentiment expressions that are irrelevant to disaster situations (e.g., “fascinating,” “sophisticated,” or “LOL”), or words that are ambiguous (e.g., “hate” or “like”) were excluded from the sentiment categories for disaster management [11].
The five sentiments are formed by subdividing the negative sentiments toward a disaster, and there is a need to subdivide the positive sentiments further. In this study, we subdivide the positive sentiments among those used previously in Social Big Board. Moreover, we propose a method of modeling eight representative sentiments based on Russell’s circumplex model, and a method of quantifying the sentiment indices of each sentiment to identify the overall public sentiment. It is expected that these improvements will enable the monitoring of overall public sentiments and the quantitative examination of the variations in public sentiments in the case of a disaster.
3. Modeling and Quantification of
Sentiments Related to Disasters
3.1. Modeling of Sentiments
Russell, an emotional psychologist, placed various human sentiments along the two axes of pleasant-unpleasant and aroused-unaroused [12]. By statistically analyzing the similarity between 28 sentiment words evaluated by participants, Russel placed various sentiments along the two axes, leading to a two-dimensional model. In this study, we referred to this circumplex model of Russell (refer to Figure A2 in the supplementary information section) when identifying a wide range of public sentiments, which includes various categories of human sentiments.
The sentiment model for disaster management was defined along two axes, namely “sadness-happiness” and “anxiety-disappointment.” On the “sadness-happiness” axis, “sadness” represents extreme negative sentiments of complaint, misery, depression, and pessimism, and “happiness” represents extreme positive sentiments of pleasure, gladness, and warm-heartedness. On the “anxiety-disappointment” axis, one of
the two extremes is defined as “anxiety,” which represents the degree of arousal and surprise involved in “sadness” and “happiness.” The other extreme is “disappointment,” which represents the sentiments in the unaroused state with calmness, tranquility, and peacefulness. Based on the two axes of “sadness-happiness” and “anxiety-disappointment,” we can define four additional sentiments with varying degrees. Specifically, the negative sentiment between “sadness” and “anxiety” is defined as “displeasure,” where the negative sentiments are highly activated and a great extent of agony, pain, nervousness, and worry is experienced. Finally, the eight representative sentiments of the disaster sentiment model were identified as “anxiety,” “pleasure,” “happiness,” “relief,” “disappointment,” “depression,” “sadness,” and “displeasure” (Figure 2).
Figure 2. Primary sentiments developed using Russell’s circumplex model.
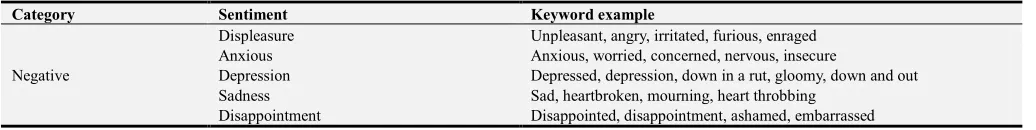
By reviewing the 2,603 sentiment keywords used in the previous sentiment analysis with five sentiment categories, the keywords were reclassified with respect to the eight newly defined sentiment categories. Moreover, additional disaster-related words and sentiment keywords were reviewed, and the keywords were refined. In this manner, a dictionary of sentiment words was established with 754 keywords (Table 1). There was a decrease in the number of sentiment keywords for the detailed model having eight sentiment categories because some keywords that are difficult to map to a specific sentiment were excluded. For instance, sentiment keywords such as “grateful,” “satisfactory,” “thankful,” “great work,” “beautiful,” “conscientious,” and “brave” were excluded, because it is difficult to map these keywords to any category of positive sentiments.
Table 1. Keyword examples of the eight sentiment types.
Category Sentiment Keyword example
Negative
Displeasure Unpleasant, angry, irritated, furious, enraged
Anxious Anxious, worried, concerned, nervous, insecure
Depression Depressed, depression, down in a rut, gloomy, down and out
Sadness Sad, heartbroken, mourning, heart throbbing
Category Sentiment Keyword example
Positive
Relief Relieved, sense of relief, goodness, thank heavens
Pleasure Pleasant, happy, feel good, joyful
Happiness Happy, happiness, heart warming
3.2. Quantification of Extent of Sentiments and Development of Sentiment Indices
To quantify the extent of sentiments, we considered tweets from 2012 to 2015. The stages of quantifying the extent of sentiments are as follow. (1) The daily frequencies of occurrences of keywords for each sentiment category, and their synonyms are extracted. (2) Subsequently, the frequency is normalized to minimize the effect of differences between frequencies of each sentiment category and between each day of the week or each issue. The frequency of keywords (freq(ei,, j)) for each day (j) and sentiment category (ei) is divided by the overall frequency of tweets of the day concerned (freq(j)), and a certain value (S) is multiplied for scaling to derive the normalized frequency (Nfreq(ei, j)).
, ,
(3) Lastly, the ratio of normalized daily frequency to the normalized maximum frequency of the sentiment in question is calculated and is defined as the sentiment index.
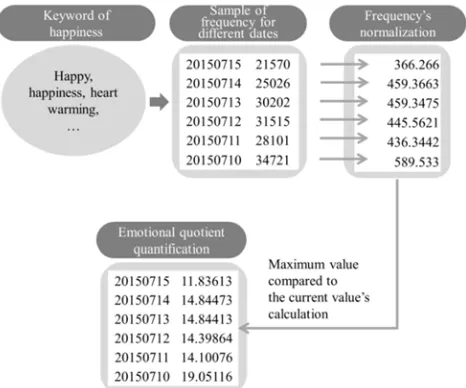
For instance, for the “happiness” sentiment category, we sum the frequencies of not only the keyword, “happy,” but also all synonyms such as “happiness” or “warms my heart” and find that the frequency of keywords relating to “happiness” on Twitter was 21,570 on the 15th of July 2015. The frequency extracted as such is converted to the normalized frequency (366.266), and in turn, to the sentiment index of 11.836 on the 15th of July 2015 using the maximum normalized frequency (3,094.473) of the “happiness” category. In other words, the sentiment index shows how the normalized frequency of a specific day compares to the maximum of the sentiment in question (Figure 3.).
Figure 3. Example calculation of sentiment index for “happiness”.
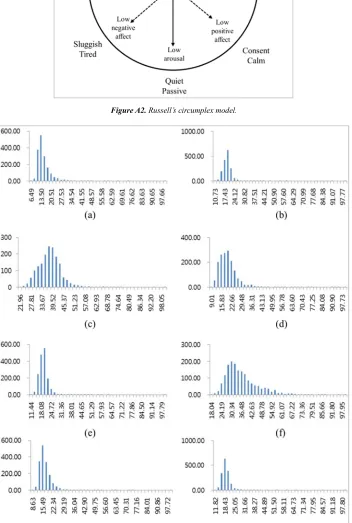
The events with the greatest sentiment indices for each sentiment category are New Year’s Day 2014 for “happiness,” the Ladies’ Code accident (Sep. 30, 2014) for “sadness,” the false report of all passengers being rescued during the Sewol ferry incident (Apr. 16, 2014) for “relief,” the 2012 Presidential Election (Dec. 20, 2012) for “depression,” the decision to award a silver medal to Yuna Kim during the 2014 Sochi Winter Olympics (Feb. 21, 2014) for “displeasure,” the 2013 Thanksgiving Day for “pleasure,” the day after the 2014 General Elections (Apr. 12, 2014) for “disappointment,” and the impact of Typhoon Bolaven for “anxiety” (Aug. 28, 2012). Figure A3 shows the histograms of each sentiment index.
Using the above method, the eight sentiment indices are calculated daily, and the accumulation of daily sentiment indices can be utilized in identifying the variations in the public sentiments, or the influence of variations in public sentiments on incidents. Moreover, by defining a more detailed model compared to the initial one, one can now perform a more elaborate analysis that can distinguish between happiness and relief among positive sentiments, rather than a binary identification of sentiments between positive and negative.
3.3. Verification of the validity of the sentiment index
The sentiment model for disaster safety proposed in this paper aims to quantify the atmosphere of general public sentiments and to identify how the sentiments vary with disasters, accidents, and damages. To verify the validity of the sentiment index, it was compared to the perceived level of safety reported every month by the Ministry of Public Safety and Security [13].
The report on the perceived level of safety aims to investigate and publicize the level of safety perceived by the public regarding societal life in general and disaster events. In addition, the report considers public perception of government measures to eradicate crimes such as domestic violence, sexual violence, and school violence. Comprehensive safety measures can be revised and enhanced based on the result. The perceived safety is investigated via phone calls or online questionnaires completed by experts, the public, and teenagers. The participants indicate the perceived safety as “safe,” “not safe,” or “ordinary,” and the ratio of responses is used to derive the perceived level of safety.
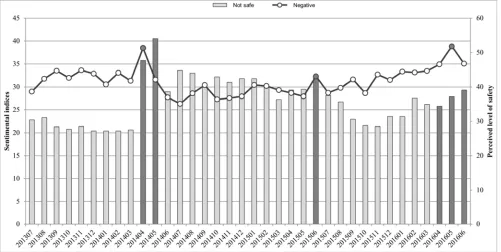
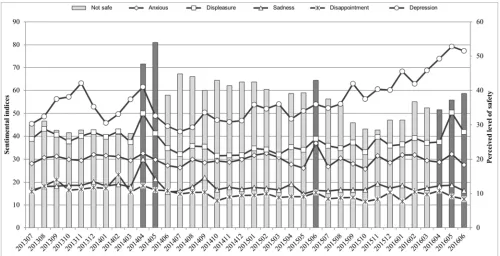
which is compared to the monthly response ratio of “not safe.” There is a sudden increase in the “not safe” response ratio in April and May 2014, when the Sewol ferry incident occurred. It can be seen that the “negative” sentiment index is also at the maximum during this period. There is also a stiff increase in “not safe” responses and the “negative” sentiment index during the nationwide spread of the MERS virus in June 2015. The perceived level of safety decreases temporarily
until late 2015 but starts to increase again in early 2016. On the other hand, the “negative” sentiment index continuously increases after the MERS infection incidents and increases even further after the accidents and incidents that threaten individual safety, such as the motiveless murder of a female college student at Gangnam station (May 2016) and the gang rape of a female teacher in Shinahn (June 2016), which is different from perceived level of safety.
Figure 4. Trends in perceived level of safety and negative sentimental indices.
The sentiment index proposed in this paper can be used for analyzing the results on perceived level of safety in the following two aspects. First, perceived level of safety is measured through questionnaires and may vary depending on the method or form of the questionnaire used. Moreover, the incidents not considered in the questionnaire cannot be analyzed. In particular, as shown by the results on perceived level of safety in 2016, the increase in “not safe” responses despite the lack of a notable large-scale disaster cannot be analyzed using the previous method of comparing to structured statistics such as on disaster occurrences, property damages, and loss of human life. In this case, the sentiment index derived based on social media can be used for a comprehensive analysis, which may also provide a clue to the perceived safety result. It was also verified that there is an actual correlation between occurrences of disaster-related tweets and the perceived level of safety.
Second, when considering the results for the perceived level of safety, one can analyze the variations in sentiments in greater detail using the sentiment indices, which have been subdivided into eight different sentiments. Moreover, the fundamental cause of the sentiment concerned can be deduced by analyzing the original tweet. The “negative” sentiment index in Figure 4 can be subdivided into five negative sentiments, as shown in Figure 5, to examine the
trend in more detail. In May 2016, the sentiment of “depression” is found to be dominant at 79% of the maximum “depression” sentiment index during the 2012 Presidential Election (’12.12.20). “Displeasure” was found to be 50% of the maximum, and “anxiety” was found to be 30% of the maximum. Analyzing the original tweets that expressed sentiments in May and June 2016, we find that the tweets express concerns toward the trend of sexual violence being overlooked compared to other violent crimes and the spread the culture of “not a rape if not caught”. Moreover, there is a “displeasure” sentiment toward the social norms of attributing sexual harassment to mistakes in judgment by female individuals and of criticizing the female victim. Based on the original tweets, we could identify that there was an anxiety toward continuous occurrences of sexual violence, which became a large social issue, and a fear toward sexual violence ultimately leading to other violent crimes such as murder.
of safety. Moreover, it can quantitatively examine the variations in public sentiments toward disaster safety and describe the influence of disasters or accidents on public sentiments in eight subdivided sentiment categories.
Furthermore, it allows a more detailed analysis of the cause of the sentiment, owing to the subdivision into eight sentiment categories, which is suitable for the objective of supporting disaster safety policies.
Figure 5. Trends in perceived level of safety and five negative sentimental indices.
4. Conclusion
In this study, we proposed a sentiment category model and a technique for the quantification of sentiment indices using Social Big Board, a real-time disaster monitoring system based on social media.
Social Big Board is a system that provides various features for supporting disaster safety policies using text mining and machine learning. Although it has the advantage of running in real time, which allows immediate identification of rapid changes in social context and disaster-related issues, this study has a limitation in social media coverage, as it considers only Twitter. This problem can be resolved if some of the restrictions regarding accessing the user information available on social media, which are in place for the users’ privacy protection, can be relaxed. Another remaining task is to establish a thorough verification system for social media data, the reliability of which is not guaranteed.
There were three sentiment categories in the initial sentiment model, namely positive, negative, and “wait and see.” To identify the changing trend in public sentiment as disasters or accidents progressed or the sentiment toward government responses, the negative sentiments were further categorized, improving the analysis. Finally, the positive sentiments were subdivided into three categories, and eight representative sentiments were modeled, referring to Russell’s circumplex model. Moreover, sentiment indices for each sentiment were quantified. Based on this, the general public sentiment can be monitored, and the cumulative daily
sentiment indices can be used to examine variations in public sentiments by analyzing sentiment trends. Moreover, the influence of disasters and accidents on public sentiments, or in other words, the sentiment indices of different accidents, can be compared to identify the accidents that affect public sentiment, which information can be used for policy-making.
The sentiment index is a piece of scientific information based on the analysis of public sentiments toward society in general, relating to disaster and safety management. It can also be used as a piece of social context information for analyzing the perceived level of safety, which is investigated and announced by the Ministry of Public Safety and Security. Moreover, it can be used to support policy-making in the identification of public needs after a disaster.
and feedback and communicating with the public.
To support various initiatives, such as establishing disaster safety policies, it is necessary to continuously improve the sentiment model by comparing the results from the sentiment model with eight categories and the previous models with three and five categories with events of disasters and statistical data. Moreover, to suit the objective of monitoring
and addressing disaster safety, the dictionary of sentiment keywords must be improved, and the classification must become selective and focused. In addition, by adding English processing to the sentiment model of the currently Korean-only Social Big Board, the monitoring area can be expanded by analyzing international disaster safety sentiment trends.
Appendix
Figure A2. Russell’s circumplex model.
References
[1] Jeon Y. S., Kim Y. S., & Jeong S. Y. (1995). Management. Gyeonggi-do: Bobmunsa.
[2] Miller, J. (2012). Psychosocial Capacity Building in Response to Disasters, New York: Columbia University Press.
[3] National Disaster Management Research Institute. (2015). Development of social media utilization guideline for disaster management and enlargement of analysis resources. Final report. Seoul: NDMI.
[4] Choi, S. H., Lee, J. G., & Yeo W. G. (2014). Disaster management competence reinforcement for self-governing bodies using big data. Local Administration Monthly Magazine, 730, 16–19.
[5] Liu, B. (2008). Opinion mining & summarization-sentiment
analysis. Retrieved from:
http://wwwconference.org/www2008/program/program-tutorials-TA6.html.
[6] Sentiment analysis (2019). Retrieved from: http://en.wikipedia.org/wiki/Sentiment_analysis.
[7] Back, B. H., Ha, I. K., & Ahn, B. C. (2014). An extraction method sentiment information from unstructured big data on SNS. Journal of Korea Multimedia Society, 17 (6), 671–680.
[8] Ryu, P. M., Kim, H. J., Kim, H. K., and Park, S. K. (2012). Social media issue detection & monitoring based on deep language analysis techniques. Communications of Korean Institute of Information Scientists and Engineers, 30 (6), 47– 58.
[9] Shin, S. M., & Lee, T. S. (2015). A study on sentiment classification for SNS data analysis. Proceedings of Korean Institute of Information Scientists and Engineers Dec 17-19 2015, Pyeongchang: KIISE Press.
[10] Cha, Y. S., Hwang, M. C., & Kim, S. L. (2011). An empirical study on modeling social emotion evoked during social network service. Proceedings of Korean Society of Emotion and Sensibility. Nov 11, 2011. Gyeongju: KSES Press. [11] National Disaster Management Research Institute. (2014).
Development of social big data semantic monitoring technology. Final report. Seoul: NDMI.
[12] Russell, J. A. (1980). A circumplex model of affect. Journal of Personality and Social Psychology, 39 (6), 1161–1178. [13] The Ministry of Public Safety and Security. The report on the