Article
Internalization of Negative External Cost of Logistics
and Incentive Mechanism
Zhanzhong Wang *,†, Zhouling Tsai †, Jing Fu † and Guangdong Tian
School of Transportation, Jilin University, Changchun 130022, China; [email protected] (Z.T.); [email protected] (J.F.); [email protected] (G.T.)
* Correspondence: [email protected]; Tel.: +86-139-0431-6393 † These authors contributed equally to this work.
Abstract: The implementation of green logistics can reduce the increasingly serious environmental damage and improve the operating efficiency of logistics enterprises. In this paper, through quantitative calculation of logistics negative external costs, including traffic accidents, atmospheric pollution, noise pollution, and pollution caused by packaging, we build accounting standards to calculate the negative external cost of logistics enterprises that mainly generate pollution from transportation and packaging. Then, assuming the impetus provided by government implementing incentive mechanisms in a free market economy, we establish a ‘Logistics Negative External Cost Internalizing’ model, which quantitatively analyzes the relationships among freight rate, freight volume, investment of enterprise for implementing green logistics, and the subsidy given by government, under the comparison of the two modes ‘enterprise operates first’ and ‘government subsidizes first’. The results show that the introduction of ‘government subsidizes first’ incentive mechanism and increasing freight rate are helpful in promoting the process of logistics market greening.
Keywords: green logistics; negative externality of logistics; internalization of logistics negative external cost; incentive mechanism
1. Introduction
The value created by logistics occupies an important position in China's national economy. From 2000 to 2015 the average annual growth rate of China's social logistics was about 20%, far greater than the growth of the national economy. As the natural environmental destruction caused by logistics is worsening, China and other countries around the world for their own logistics industries have developed corresponding cost accounting standards and analysis patterns. However, the damage to the ecological environment and natural resources produced in logistics activities have not been included in these logistics cost accounting systems. Researchers have carried out a great deal of work on the negative external impacts of logistics, basing much of this research on studies of the negative impacts on the environment. Research into the external cost of logistics is mainly focused on transportation, and the mechanism of internalizing external cost is mainly focused on the implementation of taxation.
Currently, scholars are demonstrating the necessity of internalizing the negative external cost of logistics from various aspects; the vast majority of them either theoretically or qualitatively analyze the issue of negative external cost internalization of logistics.
Johansson analyzed the externality cost of traffic congestion and constructed a congestion tax model after analyzing and calculating the social net income of various road users [1].
Kawase and Matsuoka have pointed out that Japan has enacted a new environmental tax plan in 2004 in which it is regulated that residents of every household in Japan will be subject to annual environmental taxes of 3,000 yen [3].
Jakob noticed that although negative external costs are taken into account, they are difficult to calculate. He used New Zealand as an example to calculate the total cost of private transport and public transport, and evaluated the externalities and internalities of the transportation costs [4].
Lemp analyzed and estimated the source of the negative external cost in transport, the results showing that the external cost of light trucks is much higher than that of passenger cars [5].
Lee taking the Large-Scale Network in the Asia-Pacific Region as a case study, have proposed the design of a sustainable logistics network based on stochastic programming in an uncertain environment, but only minimized the total cost of logistics [6].
To incorporate environmental management into everyday decision-making, Ubeda introduced variables in the vehicle minimization path that satisfy green criteria while also meeting efficiency goals [7].
Scholars such as Marchet have researched and compiled a number of related articles in which discuss the significance of sustainable development in logistics enterprise decision-making. However, most of the research in Archet’s compendium was mainly based on case analysis and investigation and rarely involved simulation analysis and modeling research [8].
Lui analyzed the necessity of calculating and including negative externalities into total costs, and established a distribution network design model with consideration of negative externalities produced by distribution transportation [9].
Mesa-Arango researched the benefits of in-vehicle consolidation in increasing truck payload utilization, as well as reducing the negative externalities caused by freight transportation [10].
Africa’s externality costs were included in a logistics measurement system when Havenga discussed this issue and found that transport costs suffer a great pressure from the oil price and the internalization of externality costs. Also established was a logistics costs model incorporating externality costs based on a gravity-oriented freight flow model, where it was found that national logistics costs can be reduced more easily as compared to company-level logistics on the condition of good coordination of company-level transport [11].
Lera-Lopez adopted both double-hurdle and Moulton's models to evaluate the willingness of populations who live next to roads to pay for the negative externalities costs generated by logistics activities [12].
Fumasoli established an impact model to determine the effects of the characteristics of freight trains on capacity consumption in mixed traffic railway networks, the result shows that the use of freight trains can reduce the relative capacity consumption of freight trains and can reduce freight transport negative externalities [13].
Meersman analyzed how to mitigate negative externalities associated with land-based transport by taking a micro-research approach and proved that road pricing has a potential impact on the cost function of logistics [14].
2. Negative external costs accounting
Marshall and Pigou put forward the concept of externality in the early 20th century. As applied in the field of logistics, ‘externality’ mainly refers to the fact that logistics activities additionally have negative impacts on other individuals’ interests. The negative externalities of transportation and distribution generally include various damage, such as pollution emissions producing by conveyances, noise, traffic jams and accidents, etc. Negative externalities of warehousing mainly embody environmental pollution arising from bad warehouse management, including toxic and harmful gases leaking and the damage or rot of cargoes. Negative externalities of handling and hauling that are caused by the operation of related machineries include noise, dust, waste, etc. Packaging negative externalities usually refer to white pollution caused by packaging materials and resources wasted because of excessive packaging. But due to the imperfection of current statistical accounting systems, enterprises’ have usually not taken the responsibility for these non-market costs, and thus it is extremely difficult for logistics markets to optimize resource allocation.
According to negative external logistics cost quantitative calculations, enterprises can set freight rates reasonably, and the government can formulate appropriate environmental policies as well. This can impel enterprises to take on their corresponding social responsibilities. In this paper, the negative external logistics cost accounting is divided into air pollution cost accounting, traffic accident cost accounting, traffic congestion cost accounting, noise pollution cost accounting, and negative external cost accounting of packaging.
2.1. Air pollution cost accounting
This article selected the freight transportation enterprise, and only considered freight vehicle emissions. By improving Baoqiang Xia’s [15] calculation formula of road transport emissions, the freight vehicle emissions calculation formula can be obtained:
1 n
i
W k i ik
i i
Q
Q N F
q
=
=
( ( ) ) (1)where
k
represents the different pollutant categories (k
= 1, 2, 3, these pollutants being CO, NOX and CH), ifor the vehicle type (i= 1, 2...n
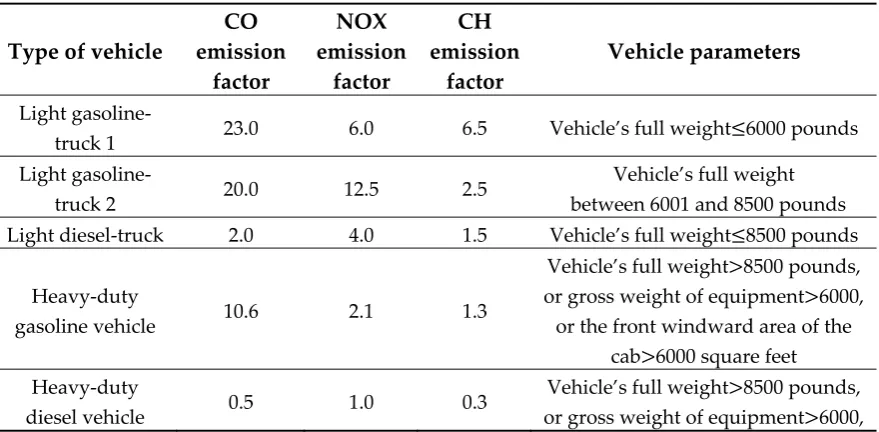
), QW k for total pollutants emissions of the class kpollutant, Ni for car ownership of the type ivehicle, Qi for the transport turnover volume of the type i vehicle, qi for the average capacity of the type i vehicle, Fik for the average emission factor of the type ivehicle that emits the class k pollutant. The value of the emission factor refers to Table 1.
Table 1. Different types of vehicle emission factors.
Type of vehicle
CO emission
factor
NOX emission
factor
CH emission
factor
Vehicle parameters
Light
gasoline-truck 1 23.0 6.0 6.5 Vehicle’s full weight≤6000 pounds Light
gasoline-truck 2 20.0 12.5 2.5
Vehicle’s full weight between 6001 and 8500 pounds Light diesel-truck 2.0 4.0 1.5 Vehicle’s full weight≤8500 pounds
Heavy-duty
gasoline vehicle 10.6 2.1 1.3
Vehicle’s full weight>8500 pounds, or gross weight of equipment>6000,
or the front windward area of the cab>6000 square feet Heavy-duty
diesel vehicle 0.5 1.0 0.3
or the front windward area of the cab>6000 square feet
We use the atmospheric pollution discharge standards in ‘regulation of discharge pollutant standards’ of China for reference. The air pollution negative external cost calculation formula is
3
1
a k W k
k
C E Q
=
=
(2)where Ca is the cost of pollutant discharge and Ek is the unit external cost of the class k pollutant.
2.2. Traffic accident cost accounting
The current measurements of traffic accident cost include the ‘traffic accident model’ and ‘accident comprehensive economic loss measurement model’ [16]. This paper comprehensively considered the research achievements of predecessors and data availability, then adopted the improved method of ‘willingness to pay’. The traffic accident cost calculation formula is
c
s c
C = I + D Q (3)
where Csis the cost of the traffic accident, Ic is the indirect loss cost of unit personnel, and Ic comprises the labor value loss of the casualty, the spirit loss of a casualty’s close relative, and the consumption loss of social service agencies [17]. Also, Dc is the direct cost of unit property loss[18]
z c
q
T D
Q γ ×
= (4)
where Tz is the loss caused by national traffic accidents and
γ
is the freight transport turnover onthe percentage of total passenger travel and freight transport turnover all over China; Qq is the total freight transport turnover of China. Both Ic and Dc are represent the average of which the loss under unit turnover, and Q for the freight transport turnover of a given enterprise.
2.3. Noise pollution cost accounting
The impact of traffic noise is extensive and difficult to calculate; thus it is hard to calculate the loss caused by noise pollution. With reference to the European average noise pollution cost [19], the calculation formula for the average noise pollution cost of China is:
1 1
n un u
u u
G
C
C
R
Q
G
ρ
ρ
=
×
×
×
(5)where Cn is the loss of noise pollution and Cu n is the average loss of noise pollution in Europe.
1
ρ and G1, respectively, represent the population density and G D P in a given area. ρu and
u
G , respectively, represent the population density and G D P in Europe. Ru is the euro exchange rate for the RMB.
2.4. Traffic congestion cost accounting
Now traffic congestion cost accounting is usually concentrated on urban road passenger transport, but we focus on highway freight transportation. Therefore, traffic congestion loss in urban distribution is ignored in this paper.
As the materials of logistics packaging mainly consist of plastics, wood packing and polyfoam, this paper employs defensive expenditures to calculate the processing cost of the discarded packaging materials. The calculation formula is
(
)
1
1
n
B m m m
m
C
B M
θ
=
=
−
(6)where CB is the negative external cost of packaging And the subscript
m
denotes the category of packing material (such as plastic, wood and polyfoam,m
=1,2,…,n
). Bm is the unit processing cost of the typem
packing material, M m is its unit mass, and θm is its recoverability rate.To sum up, this paper takes C to represent the logistics negative external costs of freight transportation enterprise, the calculation formula for C being
s n B
a
C
=
C
+
C
+
C
+
C
(7)3. Logistics external cost internalization and incentive mechanism modelling
Enterprises prefer lower costs, a fact that hinders the implementation of high-cost green logistics. Only when the government regulates the economy can we solve the question of market failure in developing green logistics. To encourage enterprises to adopt green logistics, we internalize the cost of logistics negative external cost, then analyze the incentive mechanism under government intervention.
3.1 Problem description
3.1.1. Assumptions of the model.
There are two kinds of full-scale enterprises, enterprises x and enterprises y, of which enterprises x are green logistics enterprises and enterprises y are traditional logistics enterprises, both in the condition of a perfectly competitive market. The amounts of environmental taxation and government subsidies are calculated according to the logistics negative external cost. Also, government administration costs are ignored, which means all environmental taxations from enterprises y collected by the government are subsidies going to enterprises x for implementing green logistics. The production of freight transportation satisfies the production function of ‘Cobb-Douglas’, under the circumstance that pursuing maximum economic benefit is the target of all enterprises.
3.1.2. Parameter specification.
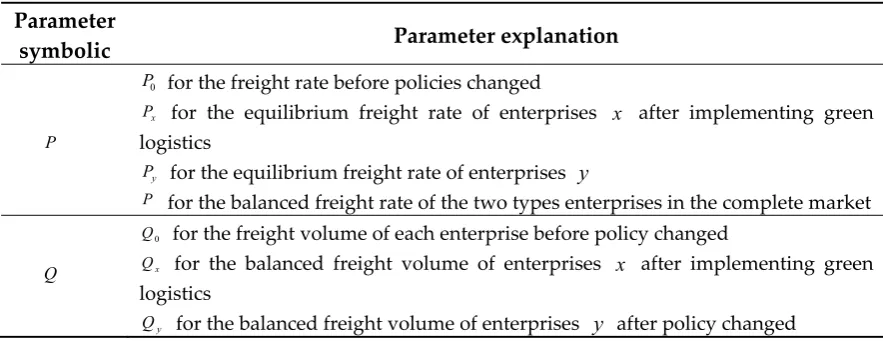
All parameters of the model refer to Table 2.
Table 2. Parameter definition and specification
Parameter
symbolic Parameter explanation
P
0
P for the freight rate before policies changed
x
P for the equilibrium freight rate of enterprises x after implementing green
logistics
y
P for the equilibrium freight rate of enterprises y
P for the balanced freight rate of the two types enterprises in the complete market
Q
0
Q for the freight volume of each enterprise before policy changed
x
Q for the balanced freight volume of enterprises x after implementing green
logistics
y
A Ax for technical level of enterprises x after implementing green logistics
y
A for technical level of enterprises y without implementing green logistics
X The amount of labor that the enterprise invests
Y The amount of capital invested by the enterprise
α The elastic coefficient of manpower output
β The elastic coefficient of capital output
γ The amount of government subsidies or punishments to the enterprise
a
The amount of capital for implementing green logistics invested by enterprise xC The negative external cost of enterprises, C C C C C= + + +a s n B, Cx is the negative
external cost of enterprise x
3.2 Scheme of model establishment
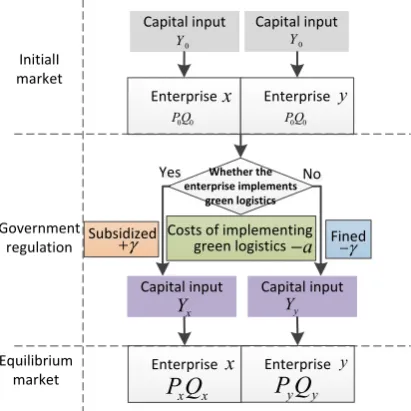
Figure 1 shows the framework of this paper: how to construct the internalization of the external cost model. According to the assumptions and under the regulation of government, the two types of enterprises x and enterprises y maneuver in a perfect competitive environment, finally leading to an equilibrium freight rate.
Capital input Capital input Capital input
Costs of implementing green logistics Enterprise Enterprise
Enterprise Enterprise InitialI
market
Government regulation
Equilibrium market
Capital input
Whether the enterprise implements
green logistics
Subsidized Fined
Yes No
0 0 PQ 0 0
PQ 0 Y
γ −
γ
+
0 Y
y y
P Q
x x
P Q
xy x
Y Yy
y x
a −
Figure 1. Model Specification of negative external costs internalization
3.3 Model establishment
The priority that government assigns in the distribution of subsidies to enterprises determines the two modes of the logistics negative external cost internalizing model: ‘enterprise operates first’ and ‘government subsidizes first’.
3.3.1. Enterprise operates first
In this mode, enterprise x invests
a
yuan into implementing green logistics, so that the capital for enterprise operation isY a− . Enterprise y needs to payγ
yuan for environmental tax, and then the capital for enterprise operating isY −γ
. By government regulation, the competitive market levels off, the objective function meeting the total revenue no less than the total revenue that without government regulation, a condition that is given by(
)
] [
(
)
0 0After compilation and transition, the critical function is given by
0 0
2
2
x x x y y
P Q
+
γ
−
C
+ +
a P Q
=
P Q
(9)Freight volume Q meets ‘Cobb-Douglas’ production function, that is Q AX Y= α β, there is a correlativity between negative external cost and freight volume, so we simplified the formula as
C = K Q . Under the equilibrium market, the freight rate is unified. Function is given by
(
)
(
)
β α β α x y y x x x y xA Y a
A Y K Q X Q X P C P Q P γ = − = − = = = (10)
By the combination of (9) and (10), the relation between P,
a
andγ
can be expressed by(
)
2 ( )(
)
2 0 0x x y
PA Xα Y −a β +
γ
−KA Xα Y −a β + +a PA Xα Y −γ
β = P Q (11)Reforming the formulaQx =A Xx α
(
Y a−)
β,a
can be expressed by1 x x Q a Y A X β α = −
(12)
Then according to (9), (10) and (12), the relationship between P, Qxand
γ
can be expressed by(
)
1
0 0
2 x 2
x x y
x Q
PQ KQ Y PA X Y P Q
A X β β α α
γ
γ
+ − + − + − = (13)
Reforming the formula Qy =A X Yy α
(
−γ
)
β,γ
can be expressed as1 y y Q Y A X β α
γ
= − (14)Then according to (9), (13) and (14), the relationship between P, Qx and Qy can be expressed
by
1 1
0 0
2 y 2
x y
y x
x x
Q Q
PQ Y KQ Y PQ P Q
A X A X
β β α α + − − + − + = (15)
3.3.2. Government subsidizes first
In this mode, when enterprise x invests
a
yuan in implementing green logistics, and gain government subsidies ofγ
yuan as well, then the capital for enterprise operating isY a
− +
γ
. The capital for enterprise operations is still Y −γ
. As above, the objective function is given by(
)
] [
(
)
0 0[
P Q
x x−
C
x−
Y a
− +
γ
+
P Q
y y−
Y
−
γ
] 2
≥
P Q
−
2
Y
(16)After compilation and transition, the critical function is given by
0 0
2
x x x y y
P Q
−
C
+ +
a P Q
=
P Q
(17)(
)
(
)
x x y y x x x yQ A X Y a
Q A X Y C KQ
P P P
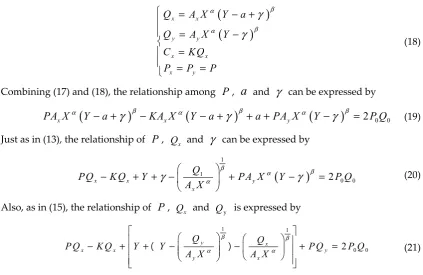
β α β α γ γ = − + = − = = = (18)
Combining (17) and (18), the relationship among P,
a
andγ
can be expressed by(
)
(
)
(
)
2 0 0x x y
PA Xα Y − +a
γ
β −KA Xα Y − +aγ
β + +a PA Xα Y −γ
β = P Q (19)Just as in (13), the relationship of P, Qx and
γ
can be expressed by(
)
1 1 0 0 2 xx x y
Q
PQ KQ Y PA X Y P Q
A X β β α α γ γ − + + − + − =
(20)
Also, as in (15), the relationship of P, Qx and Qy is expressed by
1 1 0 0 2 y x x x y y x Q Q
P Q K Q Y Y P Q P Q
A X A X
β β α α − + + − − + =
( ) (21)
Based on the model established above, we can analyze the mutual influence relations of P,
a
,γ
, Qx and Qy, and further guide the external cost internalization of enterprises.4. Model verification and discussions
4.1 Case introduction
A certain logistics enterprise of ChangChun provides distribution services, the main business being to transport headlights of cars for car factories. The enterprise has a staff of 200, with two million yuan operating investment, the annual freight volume is 46 million ton-kilometer. According to vehicle type, the operating fees are shown in Table 3.
Table 3. Operating Costs of the logistics enterprise
Vehicle type Vehicle
number
Freight rate in Full load
(yuan / per vehicle)
Sharing costs
(yuan)
16 m Tractor and span carriers 16 32307 25385
16 m pallet carriers 24 30753 22485
16 m flat cars 30 29643 20885
21 m flat cars 10 30309 26585
In this paper, we take the average freight rate of the different type of trucks; the average freight rate is 0.59 yuan per ton-km. The distance between area 1 and area 2 is 3000 km, and a full load is carried from area 1 to area 2. The packaging material, which is removed in area 2, is returned to area 1. The transport mode is truck-load, with vehicles and transportation details shown in Table 4.
O-D Vehicle type
Freight volume per vehicle(t)
Transport turnover volumes per vehicle(t.km
)
Annual total transport turnover volumes
(t.km)
Area 1 to area 2
16m tractor and
span carriers 3.5 10500 3024000
16m pallet carriers 3.5 10500 4536000
16m flat cars 3.3 9900 5346000
21m flat cars 4.5 13500 2430000
Area 2 to area 1
16m tractor and
span carriers 3.5 10500 3024000
16m pallet carriers 3.5 10500 4536000
16m flat cars 3.3 9900 5346000
21m flat cars 4.5 13500 2430000
4.2 Negative external costs accounting
After computation, the air pollution cost is 1.2Q×
10
−2 yuan, the traffic accident cost is 1.96Q×2
10− yuan, the noise pollution cost is 16.29Q yuan, and the traffic congestion cost is1.78×10−2 Q
yuan. Eventually, according to (6), the total external cost of the enterprise is 16.33Q yuan.
4.3 Analyzing the Model
According to negative external logistics cost quantitative calculations, enterprises can set freight rates reasonably, and the government can formulate appropriate environmental policies as well. This According to the data of operation and benefits of the enterprise, we fitted out the production function of the enterprise, assuming that the technical level of the enterprise can be improved by 5% after implementing green logistics; then the value of Ay became 1.05. Based on the
negative-external-costs internalization model, corresponding functions are deduced and then discussed. This paper mainly employs graphs to analyze the relationships among investments in green logistics, government subsidies, freight rate and the freight volumes of enterprises. In the graph, the full line represents ‘government subsidizes first’, and the dotted line represents ‘enterprise operates first’.
4.3.1. Analysis of the relationships among freight rate P, capital input of green logistics
a
and government subsidiesγ
.Figure 2.The Relationship between
a
andγ
under certain PFigure 3. The Relationship between
γ
andP under certain
a
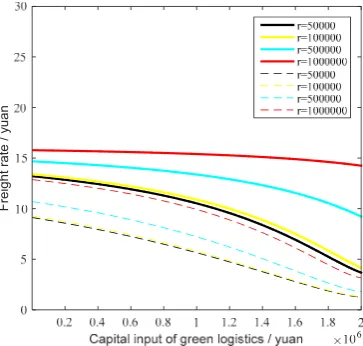
Figure 4. The Relationship between
a
andP under certain
γ
From the curve tendencies for the two modes in figure 1, we know that market equilibrium can be achieved more quickly in the ‘government subsidizes first’ mode with lower freight rates. At the initial stage of achieving market equilibrium, enterprises have to bear all the negative external cost after the implementation of green logistics. This means the total cost of an enterprise is higher, thus the enterprise needs plenty of subsidies from government. But with the increase of capital invested in implementing green logistics, enterprise negative external costs are cut. And when the investment amount is reduced to the inflection point in the graph at a constant rate, the government subsidy rate will gradually slow with the increase in green logistics investment amounts. The result is that finally all enterprises in the market will implement green logistics and the government does not need to give subsidies or impose fines.
According to Figure 3, under the mode ‘government subsidizes first’, the freight rate changes faster in an early-stage market and tends to stabilize around 17, and the high freight rate is because of the high negative external costs. With the increase of government subsidies, the freight rate changes rapidly under the mode ‘enterprise operates first’, and if the government subsidies are low, the freight rate in the market will rise and stay higher. Otherwise, if the government subsidies increase to a certain point then the freight rate in the market will start to move down.
Figure 4 shows that when the government subsidies stay the same, the freight rate of the mode ‘enterprise operates first’ is lower on the occasion of the same investment in green logistics. In the mode ‘government subsidizes first’, there is more investment in green logistics when the freight rate
Gov
ernm
ent subsidies / y
uan
Fr
ei
ght
r
a
te
/ y
stays the same. The figure can explained in this way: when the government subsidies stay the same, enterprises need to implement green logistics, so the freight rate in the market will rise to a higher level in a short time. With the improvement of green logistics investment, the technology of the enterprise improves as well, so the negative external cost of the enterprise reduces and the freight rate is gradually reduced.
4.3.2. Analysis of relationships among freight rate P, freight volumes of green logistics Qx, and
government subsidies
γ
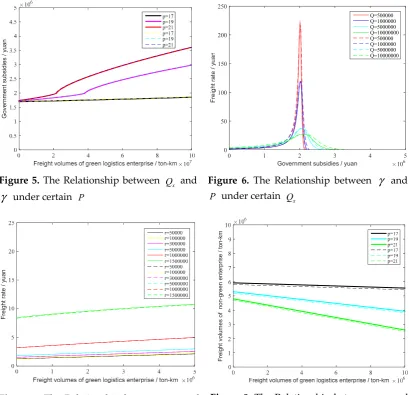
.According to Figures 5, 6 and 7, the fact that almost the same curve results in the two modes means that the relationships among freight rate, freight volumes and government subsidies are nearly the same. The curve’s trend can be explained thus: as the negative external costs increase with the increase of transport freight volume, increased freight volume and high green logistics costs will lead to a higher freight rate and require more government subsidies.
Figure 5. The Relationship between Qx and
γ
under certain PFigure 6. The Relationship between
γ
andP under certain Qx
Figure 7. The Relationship between Qx and
P under certain
γ
Figure 8. The Relationship between Qx and
y
Q under certain P
4.3.3. Analysis of the relationships between freight rate P, freight volumes of green logistics Qx
and freight volumes of non-green logistics Qy
According to Figure 8, the changing trend of freight volumes of the two modes is the same, but the total freight volumes of the mode ‘government subsidizes first’ is larger. With the freight volumes of green logistics enterprises increasing, the freight volumes of non-green logistics enterprises are
Government subsi
di
es / y
uan
Government subsidies / yuan 106
0 1 2 3 4 5 0
50 100 150 200 250
Q=500000 Q=1000000 Q=5000000 Q=10000000 Q=500000 Q=1000000 Q=5000000 Q=10000000
Freight
rat
e /
y
uan
F
reight
volum
es
of
non-green ent
erpris
e /
t
on-k
reduced. This means that if we expect more enterprises to implement green logistics, the government should subsidize more, so that the total freight volumes of green logistics enterprises can be improved.
5. Conclusions
The internalization of the negative external cost model, taking transportation enterprises as an example, compares many aspects, such as transport freight rates, the total amount of traffic, the cost of green logistics, and the rewards and punishment of government, and uses functions and graphics to analyze the interaction of all these factors clearly and intuitively. Combining the information of a logistics transportation enterprise, this paper calculates the negative external cost of the enterprise’s logistics activities. Through the comparison of two incentive models ‘enterprise operates first’ and ‘government subsidizes first’, the model ‘government subsidizes first’ will have a more positive effect in promoting green logistics, and will be beneficial to the stability of the market freight rate. However, in this mode, the government’s rewards and punishments cannot lower the transport freight rate enough, and the market freight rate will remain at a high level in the end. As for the effect of improving the green logistics enterprise’s competitiveness, ‘government subsidizes first’ is better than ‘enterprise operates first’ because the negative external cost of logistics will be higher along with the freight volume, so that a large amount of money is needed to eliminate the negative externalities. With high government subsidies in the mode ‘government subsidizes first’, a green logistics enterprise will gain a higher return on investment because of higher overall investment. Last but not least, as the logistics negative externalities are difficult to eliminate thoroughly, green logistics enterprises can efficiently reduce their negative externalities by improving freight rates properly.
The model we established follows market economic patterns by calculating the negative external cost of logistics enterprises and clearly analyzing the relationships of the variables through graphs. Despite limitations, it still can provide an excellent basis for decision-making, both for enterprises and governments, when it comes to developing green logistics. As for the limitations, this paper has focused on transport enterprises, an approach that is representative, but has its limits. Because there exist a multitude of enterprises of different sizes and scales and business forms in the real market, it appears quite difficult to construct a model that fits all situations; more complex scenarios would require further research. Besides this, we can further consider the operational costs of the government in the process of regulation.
References
1. Johansson, B.; Mattsson, L.-G. Road pricing:theory,empirical assessment and policy. . Kluwer Academic
Publishers: 1995.
2. Van Woensel, T.; Creten, R.; Vandaele, N. Managing the environmental externalities of traffic logistics: The
issue of emissions. Prod Oper Manag 2001, 10, 207-223.
3. Kawase, R.; Matsuoka, Y.; Fujino, J. Decomposition analysis of co2 emission in long-term climate
stabilization scenarios. Energy Policy 2006, 34, 2113-2122.
4. Jakob, A.; Craig, J.L.; Fisher, G. Transport cost analysis: A case study of the total costs of private and public
transport in auckland. Environmental Science & Policy 2006, 9, 55-66.
5. Lemp, J.D.; Kockelman, K.M. Quantifying the external costs of vehicle use: Evidence from america's
top-selling light-duty models. Transportation Research Part D-Transport and Environment 2008, 13, 491-504.
6. Lee, D.-H.; Dong, M.; Bian, W. The design of sustainable logistics network under uncertainty. Int J Prod Econ
2010, 128, 159-166.
7. Ubeda, S.; Arcelus, F.J.; Faulin, J. Green logistics at eroski: A case study. Int J Prod Econ 2011, 131, 44-51.
8. Marchet, G.; Melacini, M.; Perotti, S. Environmental sustainability in logistics and freight transportation.
Journal of Manufacturing Technology Management 2014, 25, 775-811.
10. Mesa-Arango, R.; Ukkusuri, S.V. Benefits of in-vehicle consolidation in less than truckload freight
transportation operations. Transport Res E-Log 2013, 60, 113-125.
11. Havenga, J.; Simpson, Z. Reducing national freight logistics costs risk in a high-oil-price environment. The
International Journal of Logistics Management 2014, 25, 35-53.
12. Lera-Lopez, F.; Faulin, J.; Sanchez, M.; Serrano, A. Evaluating factors of the willingness to pay to mitigate
the environmental effects of freight transportation crossing the pyrenees. In 17th meeting of the euro working
group on transportation, ewgt2014, Benitez, F.G.; Rossi, R., Eds. Elsevier Science Bv: Amsterdam, 2014; Vol. 3,
pp 423-432.
13. Fumasoli, T.; Bruckmann, D.; Weidmann, U. Operation of freight railways in densely used mixed traffic
networks – an impact model to quantify changes in freight train characteristics. Res. Transp. Econ. 2015, 54,
15-19.
14. Meersman, H.; Sys, C.; Van de Voorde, E.; Vanelslander, T. Road pricing and port hinterland competitiveness:
An application to the hamburg-le havre range. Int. J. Sustain. Transp. 2016, 10, 170-179.
15. Baoqiang, X. Study on road transport emission based on externality theory. Master, Beijing jiaotong
university, 2009.
16. Lindberg, G. Traffic insurance and accident externality charges. J Transp Econ Policy 2001, 35, 399-416.
17. Jing, D. Research on the calculation theory and method of the external cost of the transportation system in
china. Master, Beijing jiaotong university, 2010.
18. Gang, Z.; Cong, L. Quantitative analysis and calculation of the negative externality of beijing transportation
system. Ecological Economy 2014, 30, 57-63.
19. Hong, L.; Wenjun, L. Beijing-tianjin-hebei region transportation environmental cost assessment - based on the analysis of pollution loss method and the cost of environmental governance method. Price:Theory & Practice 2015, 52-54.
Conflicts of Interest: The authors declare no conflict of interest.