Prediction of biopore- and matrix-dominated flow from X-ray CT-derived
macropore network characteristics
Article in Hydrology and Earth System Sciences · October 2016
DOI: 10.5194/hess-20-4017-2016
CITATIONS 6
READS 384
7 authors, including:
Some of the authors of this publication are also working on these related projects:
Yucca Mountain Performance Confirmation View project
BonaRes - Centre for Soil Research | BonaRes-Zentrum für Bodenforschung View project Muhammad Naveed
University of the West of Scotland
33PUBLICATIONS 155CITATIONS
SEE PROFILE
Markus Tuller
The University of Arizona
245PUBLICATIONS 2,312CITATIONS
SEE PROFILE
Ramaprasad Kulkarni
The University of Arizona
13PUBLICATIONS 39CITATIONS
SEE PROFILE
Hans- Jörg Vogel
Helmholtz-Zentrum für Umweltforschung
159PUBLICATIONS 3,564CITATIONS
SEE PROFILE
www.hydrol-earth-syst-sci.net/20/4017/2016/ doi:10.5194/hess-20-4017-2016
© Author(s) 2016. CC Attribution 3.0 License.
Prediction of biopore- and matrix-dominated flow from X-ray
CT-derived macropore network characteristics
Muhammad Naveed1, Per Moldrup3, Marcel G. Schaap4, Markus Tuller4, Ramaprasad Kulkarni4,5, Hans-Jörg Vogel6, and Lis Wollesen de Jonge2
1Institute of Biological and Environmental Sciences, University of Aberdeen, King’s College, Aberdeen AB24 3FX, UK
2Department of Agroecology, Faculty of Science and Technology, Aarhus University, Blichers Allé 20, Postbox 50,
8830 Tjele, Denmark
3Department of Civil Engineering, Aalborg University, Sohngaardsholmsvej 57, 9000 Aalborg, Denmark
4Department of Soil, Water and Environmental Science, The University of Arizona, 1177 E. 4th Street,
Tucson, AZ 85721, USA
5Department of Electrical and Computer Engineering, The University of Arizona, 1230 E Speedway Blvd.,
Tucson, AZ 85721, USA
6Department of Soil Physics, Helmholtz Center for Environmental Research-UFZ, Theodor Lieser Straße 4,
06120 Halle (Saale), Germany
Correspondence to:Muhammad Naveed ([email protected])
Received: 21 October 2015 – Published in Hydrol. Earth Syst. Sci. Discuss.: 20 November 2015 Revised: 15 September 2016 – Accepted: 17 September 2016 – Published: 6 October 2016
Abstract. Prediction and modeling of localized flow pro-cesses in macropores is of crucial importance for sustain-ing both soil and water quality. However, currently there are no reliable means to predict preferential flow due to its in-herently large spatial variability. The aim of this study was to investigate the predictive performance of previously de-veloped empirical models for both water and air flow and to explore the potential applicability of X-ray computed to-mography (CT)-derived macropore network characteristics. For this purpose, 65 cylindrical soil columns (6 cm diame-ter and 3.5 cm height) were extracted from the topsoil (5 cm to 8.5 cm depth) in a 15 m×15 m grid from an agricultural field located in Silstrup, Denmark. All soil columns were scanned with an industrial X-ray CT scanner (129 µm reso-lution) and later employed for measurement of saturated hy-draulic conductivity, air permeability at −30 and−100 cm matric potential, and gas diffusivity at −30 and −100 cm matric potential. Distribution maps for saturated hydraulic conductivity, air permeability, and gas diffusivity reflected no autocorrelation irrespective of soil texture and organic matter content. Existing empirical predictive models for sat-urated hydraulic conductivity and air permeability showed poor performance, as they were not able to realistically
1 Introduction
The importance of macropore flow for the partitioning of pre-cipitation between runoff and infiltration, for plant water up-take and plant growth, for biogeochemical cycling rates, and for potential risks of ground water contamination, is widely recognized (Iversen et al., 2011; de Jonge et al., 2004; Fox et al., 2004; Moustafa, 2000). Thus, over the last decade, ma-jor research efforts have been devoted to improving the un-derstanding of macropore flow and associated governing pa-rameters, and to developing predictive macropore flow mod-els (Jarvis, 2007). Macropore flow and transport refers to the localized and commonly very rapid movement of water and solutes through the soil profile. Macropores resulting from biological activity (root channels, worm holes, etc.), geo-logical forces (subsurface erosion, shrinkage and swelling, etc.), and agricultural management (e.g., plowing) serve as the main channels for this rapid and long-distance flow and transport of water, air, and contaminants. Macropore flow is largely determined by soil structure and is generally a domi-nating process in loamy and clayey soils (Jarvis et al., 2009) where large inter-aggregate pores and biopores often act as pathways for rapid flow and transport. The transition from matrix to macropore flow (equilibrium to non-equilibrium) depends on the pore size distribution and pore continuity, and the degree of soil saturation (Bouma, 1981). Macropore flow often occurs in pores with equivalent effective cylindrical di-ameters larger than 0.3 mm, which indicates that the matric potential needs to be close to 0 and the water content close to saturation for these pores to be activated (Jarvis, 2007).
Soil and crop management practices strongly modify soil structure and thus the extent of macropore flow and trans-port. Wang et al. (2013) and Gonzalez-Sosa et al. (2010) studied the impact of land use on the hydraulic properties of the topsoil of the Loess Plateau of China and for a subur-ban catchment in France, respectively. Both studies have re-ported greater saturated hydraulic conductivities for forested land, intermediate for permanent pasture, and lower for farm-land soils. This is primarily due to the abundance of biota and less disturbance in forests and permanent pastures when compared to cultivated lands (Naveed et al., 2014a; Nor-gaard et al., 2013; Pérèsa et al., 2012). Application of ani-mal manure and fertilizers can also influence macropore flow, first by altering soil structure and second by promoting the density of earthworms, particularly deep penetrating anecic worms (Naveed et al., 2014b). Climatic conditions (seasonal temperature and precipitation variations) might also affect soil structure and macropore flow through interactions with physical processes such as cyclic freezing/thawing and wet-ting/drying (Hu et al., 2012). Due to the complex interactions and the significant number of influencing factors, a large spa-tial variability of saturated hydraulic conductivity has been reported by several authors (Wang et al., 2013; Raczkowski et al., 2012; Iversen et al., 2011). Therefore, the predictive capabilities of empirical models/pedotransfer functions for
saturated hydraulic conductivity are limited because they ig-nore the effects of key site factors and underestimate the sig-nificance of soil structure (Vereecken et al., 2010). Recently, pedotransfer functions for saturated hydraulic conductivity that account for soil structure have been developed, but they are rarely applied due to the complexity of input parameters and the still significant prediction inaccuracies (Jarvis et al., 2013; Iversen et al., 2011; Lilly et al., 2008).
Along with the prediction of macropore water flow (i.e., saturated hydraulic conductivity), prediction of macropore airflow (i.e., air permeability and diffusivity) is also of essence. Air permeability is a key parameter for the design of soil vapor extraction remediation methods. Air diffusiv-ity is of importance because the availabildiffusiv-ity of oxygen to plant roots via diffusion is a basic factor for plant produc-tivity. Various empirical models have been proposed in the past for the prediction of air permeability (Chamindu Deep-agoda et al., 2011; Kawamoto et al., 2006) and air diffusivity (Chamindu Deepagoda et al., 2011; Moldrup et al., 2000). However, none of the above studies have evaluated their ap-plicability after distinguishing between biopore- and matrix-dominated flow domains.
Recent developments in soil imaging techniques not only allow visual observations, but also quantification of pore net-work complexity. Application of X-ray computed tomogra-phy (CT) provides emerging alternative means for estimat-ing subsurface macropore flow and transport (Wildenschild and Sheppard, 2013). Over the last decade, numerous studies related to the characterization of macropore structure (i.e., macroporosity, macropore size distribution, volume, surface area, and tortuosity) have been conducted with X-ray CT for different land use and management systems (Katuwal et al., 2015; Larsbo et al., 2014; Hu et al., 2014; Naveed et al., 2013; Vogel et al., 2010; Luo et al., 2010). However, to date there have been only very few published studies on quantitatively relating macropore network characteristics to the observations of macropore flow. Katuwal et al. (2015) found that CT-derived macroporosity for the limiting section of a soil column was strongly correlated with air permeabil-ity and 5 % tracer arrival time. Larsbo et al. (2014) reported significant correlations between X-ray CT-derived macrop-ore network characteristics and flow and transport parame-ters. Paradelo et al. (2013) found that CT-derived macrop-orosity was strongly correlated with saturated hydraulic con-ductivity, solute dispersivity, and contaminant breakthrough. Luo et al. (2010) reported that macroporosity, path number, hydraulic radius, and macropore angle were the most useful X-ray CT-derived parameters for predicting macropore flow and transport under saturated conditions.
Vereecken et al., 2010), there is only little published work related to gas diffusivity. Furthermore, existing pedotransfer functions/empirical models do not discern between matrix-and biopore-dominated flow domains, which is of signifi-cance for understanding and accurate prediction of prefer-ential flow as demonstrated in the results section. In the second part of this study we derive novel macropore net-work characteristics from X-ray CT observations for the pre-diction of saturated hydraulic conductivity, air permeabil-ity, and gas diffusivpermeabil-ity, which demonstrated their utility for improving accuracy of gas and water flow predictions. The simplest form of the Kozeny–Carman equation proposed by Ahuja et al. (1984) is parameterized with novel CT-derived parameters such as effective percolating macroporosity for biopore-dominated flow and total macroporosity for matrix-dominated flow, and improvement of prediction accuracy is discussed.
2 Materials and methods
2.1 Study site and soil sampling
The 1.69 ha study site located in Silstrup in northwestern Denmark (56◦5505600N, 8◦3804400E) is composed of glacial till, a dominant geological formation covering about 43 % of all farmland in Denmark (Geological Survey of Denmark and Greenland, 1999). The top meter of the soil is highly frac-tured and bioturbated, containing 100 to 1000 biopores per m2. The field was not tilled for about 3 years prior to soil sampling. It has been plowed in December 2008 to 23 cm depth and harrowed twice to 5 cm depth in March 2009. Since then the soil was only disturbed when slurry was in-jected in 10 cm depth in April 2009 and in 5 cm depth in September 2009. A thorough overview of management prac-tices at the study site between 2006 and 2010 is provided in Norgaard et al. (2013).
Sixty-five undisturbed cylindrical soil cores (6 cm inner diameter and 3.5 cm height) were extracted from the top-soil (5 to 8.5 cm depth) in summer 2012. At the time of sampling the field was cultivated with red fescue (Festuca rubraL.). The soil columns were sampled on a 15 m×15 m grid with an additional five sampling locations between grid points (Fig. 2). All soil columns were extracted by pushing a customized core sampler with aluminum sampling cylinders into the soil and removing the surrounding material step by step. Extracted soil columns were immediately covered with tight plastic lids, placed in plastic bags, and carefully trans-ported to the laboratory to avoid smearing and compaction effects. The soil columns were stored in an environmentally controlled room at 2◦C until the start of the measurements. In addition, bulk soil samples were collected from each point at the same soil depth for texture and organic carbon analysis.
2.2 X-ray computed tomography scanning and analysis
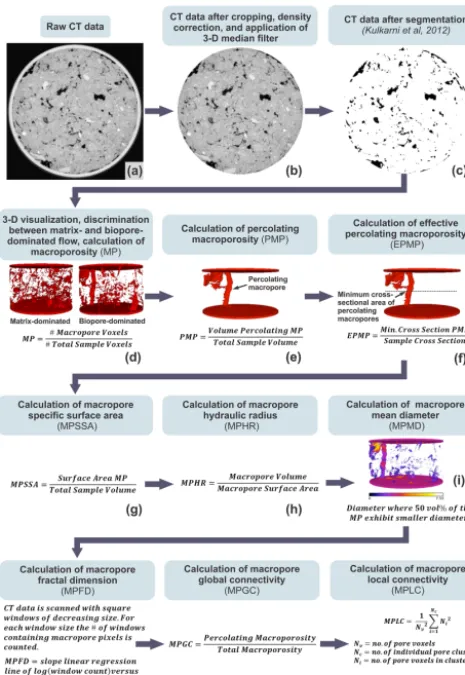
An industrial X-ray CT scanner (X-Tek HMX225) at the Helmholtz Center for Environmental Research in Halle in Germany was used to scan the intact soil columns at a voltage of 180 kV and a current of 400 µA. A copper filter was placed between the X-ray source and the soil columns to alleviate beam hardening. The shadow projections (radiographs) were reconstructed with a Feldkamp cone-beam algorithm (Feld-kamp et al., 1984) to obtain 16-bit grayscale 3-D data com-prised of 500×500×300 voxels at a resolution of 129 µm (Fig. 1a). For subsequent analysis, the 3-D grayscale volumes were cropped to remove the container wall and disturbed re-gions on the top and bottom of the sample, numerically cor-rected for intensity differences caused by beam hardening and other scanning artifacts with a sequential algorithm de-veloped by Iassonov and Tuller (2010), and a 3-D median filter (Jassogne et al., 2007) with a radius of 6 voxels was applied to the grayscale volumes to remove noise (Fig. 1b). Though median filtering is computationally more demand-ing than conventional smoothdemand-ing filters, it is less sensitive to outlier values, and thus preserves edges. A locally adaptive Bayesian Markov random field (MRF) algorithm (Iassonov et al., 2009; Kulkarni et al., 2012) that was seeded with adap-tive K-means clustering (Chen et al., 1998) was used to seg-ment the intensity-corrected and filtered data to distinguish macropores from the soil matrix (Fig. 1c). The homogene-ity parameterβ in the MRF model was set to 2. For details of the applied MRF segmentation algorithm, see Kulkarni et al. (2012) and Tuller et al. (2013).
Figure 1. Flowchart illustrating all performed CT-data enhance-ment, segmentation, and analysis steps.
of the core) and the cross-sectional area of the soil column (Fig. 1f). Macropore specific surface area (MPSSA) was cal-culated as the ratio of the surface area of macropores and the volume of the soil column (Fig. 1g). This was accom-plished with Image-J plugin “Analyze Particles”. Macropore hydraulic radius (MPHR) was defined as the ratio of macro-pore volume and macromacro-pore surface area (Fig. 1h) applying Image-J plugin “Analyze Particles”. The macropore mean di-ameter (MPMD) was estimated with a local 3-D thickness algorithm proposed by Dougherty and Kunzelmann (2007) and embedded in Image-J plugin “Bone-J”. This algorithm defines the pore diameter as the diameter of the largest sphere that fits within the pore. The histogram of the thickness map was used for estimating macropore size distribution and macropore mean diameter (Fig. 1i). Macropore fractal di-mension (MPFD) was calculated as a measure of the het-erogeneity of the spatial distribution of macroporosity with Image-J plugin “Bone-J” (Fig. 1j). Macropore global con-nectivity (MPGC) was defined and calculated as the ratio of the percolating macroporosity and the total macroporosity of the soil column (Fig. 1k). The macropore local connec-tivity (MPLC) was estimated with Image-J plugin “Bone-J”
Figure 2.Contour maps depicting the spatial distribution of soil
tex-tural properties and macropore flow parameters;(a)clay (< 2 µm),
(b)silt (2–50 µm),(c)sand (50–2000 µm),(d)organic matter con-tent,(e)saturated hydraulic conductivity (cm h−1),(f)air perme-ability (µm2)at−100 cm matric potential, and(g)gas diffusivity at−100 cm matric potential. Visualizations of samples marked as I, II, III, and IV are depicted in Fig. 3.
(Fig. 1l). MPLC equals 1 if all pores are connected in one percolating cluster and 0 if porosity is fragmented into many clusters of similar size. X-ray CT-derived pore network char-acteristics for all scanned and analyzed core samples are pro-vided in Supplement Table S1.
2.3 Soil physical measurements
carbon was determined with a LECO carbon analyzer (St. Joseph, MI, USA) coupled with an infrared CO2detector. A multiplication factor of 1.72 was used to convert soil organic carbon to soil organic matter. The sand, silt, clay, and organic matter contents for the 65 investigated samples are listed in Table S2.
After X-ray CT scanning, air permeability and gas diffu-sivity at−30 and−100 cm matric potentials, and saturated hydraulic conductivity (Ksat), were measured on the same columns. The soil columns were placed in a sand box and sat-urated from the bottom with tap water. After saturation, ten-sion was successively applied to establish matric potentials of −30 and −100 cm, respectively. Air permeability (Ka) was then measured with the steady-state method described in Iversen et al. (2001) at both−30 and−100 cm matric poten-tials. A pressure of 5 hPa was applied to assure laminar flow during the measurements. The Ka was calculated based on the Darcy equation considering the pressure difference across the soil cores:
Q=Ka1p as
ηaLs
, (1)
where Q (L3T−1) is the volumetric flow rate,Ka (L2) is air permeability,1p(M L−1T−2)is the pressure difference across the column, η (M L−1T−1)is the dynamic viscos-ity of air, as (L2)is the cross-sectional area, andLs (L) is the length of the column. Gas diffusivities (DP/D0)at−30 and−100 cm matric potentials were measured with the one-chamber method developed by Schjønning et al. (2013).
AfterDP/D0measurements, the soil columns were resat-urated, and the saturated hydraulic conductivity (Ksat)was measured with the constant head method (Klute and Dirk-sen, 1986). All measured flow parameters are provided in Table S3.
2.4 Modeling
Ahuja et al. (1984) developed a relationship (EPM, effec-tive porosity model) between saturated hydraulic conductiv-ity (Ksat)and effective porosity (φe)based on the generalized Kozeny–Carman equation:
Ksator KaorDP/D0=AφeB, (2)
whereKsatis saturated hydraulic conductivity,Kais air per-meability, DP/D0 is gas diffusivity, andA andB are em-pirical constants. Ahuja et al. (1984) definedφeas the total porosity minus the soil volumetric water content at field ca-pacity assumed at a matric potential of−33 kPa. Based on a simple calculation applying the capillary rise equation, this means thatφeis the porosity contributed by pores larger than about 9 µm in diameter. We first parameterized the original Ahuja et al. (1984) model withφeequivalent to the air-filled porosity at−30 kPa. Then, X-ray CT-derived macroporosity (MP) was used forφefor matrix-dominated flow, and X-ray
CT-derived effective percolating macroporosity (EPMP) was applied forφefor biopore-dominated flow. Note that because of the 129 µm resolution of the CT scans, the CT-derived pa-rameters MP and EPMP represent significantly larger pores than originally suggested in Ahuja et al. (1984). This seems quite reasonable and interesting to test as macropore flow of-ten occurs in pores with equivalent effective cylindrical di-ameters larger than 300 µm (Jarvis, 2007). Rawls et al. (1998) reported that several researchers found the slopeAto vary between 1.59 and 3.98 and the intercept to vary between 440 and 34 000 cm d−1.
2.5 Statistics
Data collected for soil textural properties and macropore flow parameters were first subjected to classical statistical analy-sis to obtain descriptive statistics, including minimum, max-imum, mean, median, standard deviation, skewness, and co-efficient of variation (CV). The degree of spatial variability of soil textural properties and macropore flow parameters was determined with ordinary Kriging. The ArcMap 10.1 software (Esri Inc., Redlands, CA, USA) was used to gen-erate contour maps for each measured soil property. Spear-man rank order correlation coefficients between macrop-ore network characteristics and macropmacrop-ore flow parameters were calculated with the commercial SigmaPlot 11.0 soft-ware package (Systat Softsoft-ware, Inc., San Jose, CA, USA). Selected correlations were also graphically displayed and an-alyzed with linear, power, or exponential regression mod-els. While the applicability of linear models was evaluated, power or exponential models yielded significantly better re-sults in most cases. The models were only fitted if they were significant atp< 0.01.
3 Results and discussion
3.1 Spatial variability of soil texture, organic matter, and macropore flow parameters
clay contents (Fig. 2a) were on the northern side of the field, whereas soils with high organic matter contents occupied the southern side (Fig. 2d). Thus, clay and organic matter gra-dients run in opposite directions at the study site. Soils with high silt contents (Fig. 2b) were in the western part of the field, whereas soils with high sand contents were in the east-ern part (Fig. 2c). Relevant information about the semivari-ograms for each interpolated map is provided in Table 2.
Descriptive statistics for saturated hydraulic conductivity (Ksat), air permeability (Ka), and gas diffusivity (DP/D0) at −30 and −100 cm matric potentials are provided in Ta-ble 1. Large positive skewness and quite different mean and median values were observed for all five macropore flow pa-rameters. TheKsat,Ka, andDP/D0at−30 and−100 cm ma-tric potentials showed the largest variations across the study site with a CV ranging from 92 to 218 %. High CV values were observed due to the presence of biopores in some of the soil columns, while not in others. Renderings of the samples marked as I, II, III, and IV in Fig. 2 are depicted in Fig. 3. Samples I and II are matrix-flow-dominated and samples III and IV are biopore-flow-dominated. Irrespective of the extent of the study area, large variations inKsatwere also reported in other studies (e.g., Wang et al., 2013; Sharma et al., 2011; and Iqbal et al., 2005). Kriged maps forKsat,Ka, andDP/D0 (Fig. 2e–g) look quite similar, with some areas randomly ex-hibiting a high level of macropore flow, while matrix flow dominated in other regions irrespective of soil texture and organic matter content.
3.2 Predictive performance of empirical models
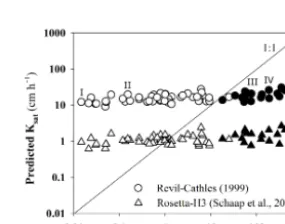
For many hydrological applications, saturated hydraulic con-ductivity (Ksat) is estimated from more readily available proxy variables such as texture and bulk density. Various empirical models/pedotransfer functions (e.g., Iversen et al., 2011; Jarvis et al., 2009; Schaap et al., 2001; Wösten et al., 1999; Revil and Cathles, 1999) have been previously pro-posed for predicting saturated hydraulic conductivity. We have observed poor predictive performance of empiricalKsat models such as proposed by Revil and Cathles (1999) and Schaap et al. (2001) (Fig. 4) and for models proposed by Wösten et al. (1999), Vereecken et al. (1989), and Cosby et al. (1984) (not shown). While the measured saturated hy-draulic conductivities span over 5 orders of magnitude due to the presence of a wide range of macropores and biopores in the core samples, model predictions yielded a very nar-rowKsatrange (Fig. 4). The primary reason for the failure of existing empirical models/pedotransfer functions is that they only consider soil texture and bulk density, and thus are not able to realistically capture macropore flow, particularly for highly structured and bioturbated soils. In general, empirical models overpredictedKsatin the case of matrix flow (empty symbols), while they underpredicted Ksat for soil columns with biopore flow (filled symbols). Because results were ob-tained for samples of limited size from the A horizon, it
Figure 3.Three-dimensional visualizations of sample soil columns
and associated measured macropore flow parameters.Ksat is
sat-urated hydraulic conductivity, andKa−100 andDP/D0−100 are
air permeability and gas diffusivity at−100 cm matric potential, re-spectively.
Figure 4.Predictive performance of empirical saturated hydraulic
conductivity (Ksat)models. Filled symbols represent samples with
biopore-dominated flow and empty symbols represent samples with matrix-dominated flow. Visualizations of samples marked as I, II, III, and IV are depicted in Fig. 3.
should be noted that for larger scales the structural charac-teristics and associated flow parameters, especially the pa-rameters related to pore connectivity, might change.
Table 1.Descriptive statistics for selected soil physical properties (no. of samples=65).
Variable Minimum Maximum Mean Median Standard Skewness CV % deviation
Clay (g 100 g−1) 14.18 18.93 15.82 15.54 1.36 0.65 9 Silt (g 100 g−1) 23.30 33.32 30.12 30.10 1.66 −1.21 6 Sand (g 100 g−1) 44.89 59.00 50.71 50.72 2.14 0.32 4 Organic matter (g 100 g−1) 2.90 3.75 3.35 3.38 0.20 −0.42 6 Saturated hydraulic conductivity (cm h−1) 0.02 418.2 40.15 1.38 89.48 2.84 218 Air permeability at−30 cm,Ka−30 (µm2) 0.03 109.19 10.87 3.21 22.33 3.03 205 Air permeability at−100 cm,Ka−100 (µm2) 0.19 151.10 14.72 5.42 27.13 3.26 184 Gas diffusivity at−30 cm,DP/D0−30 1.0×10⁻⁴ 1.8×10⁻² 2.6×10⁻³ 1.7×10⁻³ 3.0×10⁻³ 2.74 123 Gas diffusivity at−100 cm,DP/D0−100 4.0×10⁻⁴ 2.5×10⁻² 5.2×10⁻³ 4.0×10⁻³ 5.0×10⁻³ 2.31 92
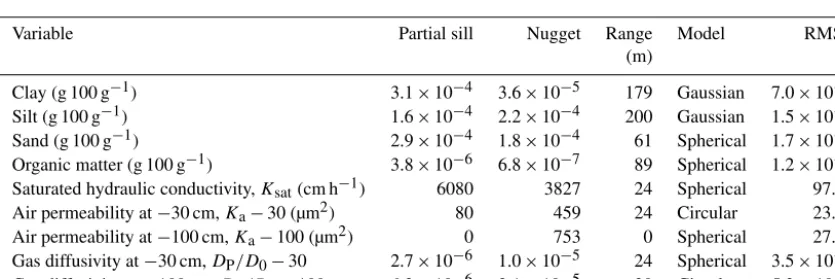
Table 2.Partial sill, nugget, range, Kriging interpolation model, and root mean square error (RMSE) for semivariograms for each interpolated
map. All interpolations were performed with ESRI ArcMap 10.1.
Variable Partial sill Nugget Range Model RMSE
(m)
Clay (g 100 g−1) 3.1×10⁻⁴ 3.6×10⁻⁵ 179 Gaussian 7.0×10⁻³ Silt (g 100 g−1) 1.6×10⁻⁴ 2.2×10⁻⁴ 200 Gaussian 1.5×10⁻² Sand (g 100 g−1) 2.9×10⁻⁴ 1.8×10⁻⁴ 61 Spherical 1.7×10⁻² Organic matter (g 100 g−1) 3.8×10⁻⁶ 6.8×10⁻⁷ 89 Spherical 1.2×10⁻³ Saturated hydraulic conductivity,Ksat(cm h−1) 6080 3827 24 Spherical 97.23
Air permeability at−30 cm,Ka−30 (µm2) 80 459 24 Circular 23.45
Air permeability at−100 cm,Ka−100 (µm2) 0 753 0 Spherical 27.54
Gas diffusivity at−30 cm,DP/D0−30 2.7×10⁻⁶ 1.0×10⁻⁵ 24 Spherical 3.5×10⁻³
Gas diffusivity at−100 cm,DP/D0−100 6.3×10⁻⁶ 2.1×10⁻⁵ 30 Circular 5.3×10⁻³
al., 2006; Chamindu Deepagoda et al., 2011). We have tested the predictive performance of the recently developed density-correctedKa model (Chamindu Deepagoda et al., 2011) as shown in Fig. 5a and b. The density-correctedKamodel per-formed reasonably well for soils with low Ka values (some of the columns with matrix-dominated flow), but completely failed for soils with greaterKavalues, especially in the pres-ence of continuous structural cracks or biopores. Starting with Buckingham (1904) a more rigorous effort has been made in the previous century to develop empirical models for the prediction of gas diffusivity (Chamindu Deepagoda et al., 2011). The tested WLR–Marshall model (Moldrup et al., 2000) predicted gas diffusivity reasonably well for soil samples associated with matrix flow and underestimated gas diffusivity for soil samples with biopore flow at−30 cm ma-tric potential (Fig. 5c). This indicates that preferential dif-fusive flow occurs at greater matric potentials close to satu-ration even though gas diffusivity is a concentsatu-ration-driven transport parameter. However, at−100 cm matric potential, the WLR–Marshall model (Moldrup et al., 2000) predicted gas diffusivity well for all soil samples irrespective of matrix or biopore flow (Fig. 5d).
3.3 Correlations between macropore flow parameters and macropore network characteristics
Figure 5.Predictive performance of empirical models for air per-meability (Ka)and gas diffusivity (DP/D0)at−30 and−100 cm
matric potentials.(a, b)Chamindu Deepagoda et al. (2011) model;
(c, d)WLR–Marshall model (Moldrup et al., 2000). Filled symbols
represent samples with biopore-dominated flow and empty sym-bols represent samples with matrix-dominated flow. Visualizations of samples marked as I, II, III, and IV are depicted in Fig. 3.
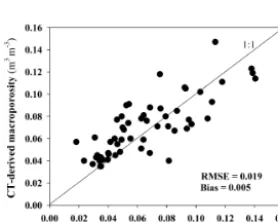
Figure 6.CT-derived macroporosity plotted as a function of
physi-cally measured air-filled porosity at−30 cm matric potential.
i.e., if there is a lot of noise and partial volume effects as shown in Naveed (2014).
Spearman rank order correlation analysis for macrop-ore flow parameters and macropmacrop-ore network characteris-tics was performed for all soil columns (Fig. 7a), for soil columns with biopore(s) connected from the top to the bot-tom (Fig. 7b), and for soil columns with inter-aggregate macropores or disconnected biopores (Fig. 7c). Many of the CT-derived macropore network characteristics were strongly correlated (Fig. 7). This is because large macroporosity is associated with large macropore surface area and better con-nectivity of macropores. This is in agreement with other re-cent studies (e.g., Katuwal et al., 2015, and Larsbo et al., 2014). The macropore mean diameter and hydraulic radius were however poorly correlated with other macropore net-work characteristics. Significant Spearman rank order
cor-Figure 7.Spearman rank order correlation analysis for(a)all
sam-ples (n=65),(b)samples with biopore flow (n=16), and(c) sam-ples with matrix flow (n=49); stars indicate significant correlations atpvalue < 0.01. MP is macroporosity, PMP is percolating macro-porosity, EPMP is effective percolating macromacro-porosity, MPSSA is macropore specific surface area, MPHR is macropore hydraulic ra-dius, MPMD is macropore mean diameter, MPFD is macropore fractal dimension, MPGC is macropore global connectivity, MPLC is macropore local connectivity,Ksatis saturated hydraulic
conduc-tivity (cm h−1),Ka−30 is air permeability (µm2)at−30 cm
ma-tric potential,Ka−100 is air permeability (µm2)at−100 cm
ma-tric potential,DP/D0−30 is gas diffusivity at−30 cm matric
po-tential, andDP/D0−100 is gas diffusivity at−100 cm matric
po-tential. Strong correlation (r> 0.70), moderate correlation (r=0.5– 0.7), and weak correlation (r< 0.5).
Table 3.Empirical constants for the Ahuja (1984) model with air-filled porosity at−30 kPa, X-ray CT-derived effective percolating macro-porosity (EPMP), and total macromacro-porosity (MP) as effective macro-porosityφe, respectively.
Variable A B
φe: air-filled porosity at−30 kPa in the Ahuja (1984) model
Saturated hydraulic conductivity,Ksat(cm h−1) 5000 3.2
Air permeability at−30 cm,Ka−30 (µm2) 5000 3.4
Air permeability at−100 cm,Ka−100 (µm2) 5000 3.2
Gas diffusivity at−30 cm,DP/D0−30 0.27 2.3
Gas diffusivity at−100 cm,DP/D0−100 0.27 2.0
φe: effective percolating macroporosity (EPMP) in the Ahuja (1984) model for biopore-dominated flow
Saturated hydraulic conductivity,Ksat(cm h−1) 5000 1.15
Air permeability at−30 cm,Ka−30 (µm2) 5000 1.5
Air permeability at−100 cm,Ka−100 (µm2) 5000 1.4
Gas diffusivity at−30 cm,DP/D0−30 0.27 1.12
Gas diffusivity at−100 cm,DP/D0−100 0.27 0.98
φe: total macroporosity (MP) in the Ahuja (1984) model for matrix-dominated flow
Saturated hydraulic conductivity,Ksat(cm h−1) 5000 3.2
Air permeability at−30 cm,Ka−30 (µm2) 5000 3.0
Air permeability at−100 cm,Ka−100 (µm2) 5000 2.7
Gas diffusivity at−30 cm,DP/D0−30 0.27 1.90
Gas diffusivity at−100 cm,DP/D0−100 0.27 1.55
the top to the bottom (Fig. 7b). Macropore hydraulic radius and macropore mean diameter were significantly correlated with macropore flow parameters for the soil columns associ-ated with biopore-dominassoci-ated flow (Fig. 7b), but poorly cor-related for soil columns associated with matrix-dominated flow (Fig. 7c). These findings are in agreement with Elliot et al. (2010) and Quinton et al. (2008). Both macropore global and local connectivity were poorly correlated with macro-pore flow parameters for the soil columns associated with biopore-dominated flow (Fig. 7b), but significantly corre-lated for the soil columns associated with matrix-dominated flow (Fig. 7c). This makes sense as biopore flow is mainly governed by the largest biopore present in the soil column, whereas matrix flow is mainly controlled by the pore size distribution and connectivity of pores.
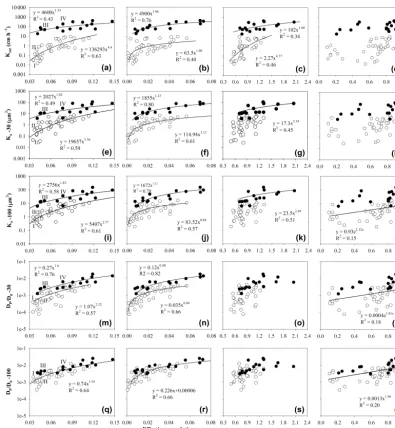
Selected correlations were graphically displayed and an-alyzed with linear, power, and exponential regression mod-els. The latter were superior to linear models in most cases, as shown in Fig. 8. The saturated hydraulic conductivity (Ksat) was plotted as a function of CT-derived macrop-orosity (Fig. 8a). Two distinct branches were observed for lower macroporosity values, which approach a single branch with increasing CT-derived macroporosity. The upper branch with greater conductivities comprises core samples with one or more biopores connected from top to bottom that mainly govern fluid flow (filled symbols). Samples III and IV marked in Fig. 8a and shown in Fig. 3 are members of this branch. The lower branch consists of core samples
with fluid mainly flowing through inter-aggregate and tex-tural pores (empty symbols). Samples I and II marked in Fig. 8a and shown in Fig. 3 are members of this branch. Distinct significant power regressions were observed be-tweenKsatand macroporosity for these two categories of the soil columns (Fig. 8a). This suggests that biopore-dominated and matrix-dominated flow columns should be discerned as an initial step prior to studying the relationships between macropore flow and CT-derived macroporosity. Both Pa-radelo et al. (2013) and Luo et al. (2010) found similar rela-tionships between saturated hydraulic conductivity and CT-derived macroporosity, withR2ranging from 0.50 to 0.60. A stronger power regression was observed whenKsatwas plot-ted as a function of the effective percolating macroporosity (R2 increased from 0.43 to 0.76), for the soil columns as-sociated with biopore-dominated flow (Fig. 8b, filled sym-bols), but this is not the case for the soil columns with matrix-dominated flow (Fig. 8b, empty symbols). Significant power regressions were observed betweenKsatand macro-pore mean diameter (Fig. 8c). No significant regression was observed betweenKsatand macropore local connectivity as shown in Fig. 8d. No significant regression was observed be-tweenKsatand macropore local connectivity for the soil sam-ples associated with biopore-dominated flow (Fig. 8d, filled symbols). This suggests that connectivity of the macropores is not the controlling factor in case ofKsat.
Figure 8. Saturated hydraulic conductivity (Ksat), air permeability at−30 cm matric potential (Ka−30), air permeability at −100 cm
matric potential (Ka−100), gas diffusivity at −30 cm matric potential (DP/D0−30), and gas diffusivity at −100 cm matric potential
(DP/D0−100) were plotted as a function of selected CT-derived macropore network characteristics; filled symbols represent samples
with biopore-dominated flow and empty symbols represent samples with matrix-dominated flow. Fitting linear regression models has been attempted; a power/exponential model was always superior where a significant correlation was present. Two separate regressions were fitted for samples with biopore flow and matrix flow if they were significantly different. Plots(g),(k),(l), and(p)only show one curve because the other was not significant, while plots(q),(r), and(t)have only one model because the two models did not differ significantly from each other.
Fig. 8e. Distinct significant power regressions were observed for the two categories of soil columns, i.e., columns with biopore-dominated flow and with matrix-dominated flow (Fig. 8e). Similar toKsat, the power regression was signif-icantly improved (R2 increased from 0.49 to 0.80) when
Ka(−30) was plotted as a function of effective percolat-ing macroporosity instead of total macroporosity for the soil columns associated with biopore-dominated flow (Fig. 8f, filled symbols). A significant power regression was observed
and k, respectively. TheKa(−100)showed significant expo-nential regression as a function of macropore local connec-tivity for matrix dominated-flow columns (Fig. 8l).
Figure 8m and n showed significant power regres-sions when gas diffusivity at −30 cm matric potential,
DP/D0(−30), was plotted against macroporosity and ef-fective percolating macroporosity, respectively. Distinct sig-nificant power regressions observed for soil columns asso-ciated with biopore-dominated flow and matrix-dominated flow reflect the fact that preferential diffusive flow occurred at−30 cm matric potential. However, at−100 cm matric po-tential, a single regression significantly described both types of data associated with biopore flow and matrix flow as shown in Fig. 8q and r. This indicates that no preferential dif-fusive flow occurred at and below−100 cm matric potentials. BothDP/D0(−30)andDP/D0(−100) showed insignificant regressions when plotted as a function of macropore mean diameter for both categories of soil samples (Fig. 8o and 8s). Significant exponential regressions were observed when
DP/D0(−30)andDP/D0(−100)were plotted as a function of macropore local connectivity for both sets of soil columns associated with matrix flow and biopore flow (Fig. 8p and t). This is expected as DP/D0is a concentration-driven gas transport parameter mainly controlled by total air-filled pore space and its connectivity, and not by the pore size (Moldrup et al., 2000).
3.4 Modeling saturated hydraulic conductivity, air permeability, and diffusivity
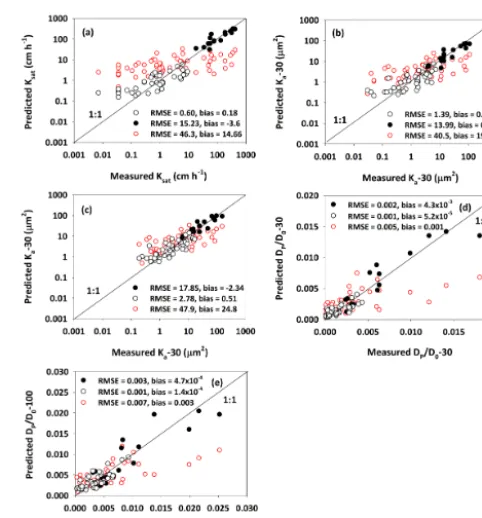
Saturated hydraulic conductivity, air permeability at−30 and −100 cm matric potentials, and gas diffusivity at −30 and −100 cm matric potentials were modeled with the simplified form of the Kozeny–Carman equation presented in Ahuja et al. (1984). First, we have tested the predictive performance of the original Ahuja et al. (1984) model with air-filled poros-ity at −30 kPa as the effective porosity (Fig. 9, red empty symbols). Then, we have modified the original equation with novel CT-derived input parameters. The effective porosity in the original model was replaced with the CT-derived to-tal macroporosity (MP) in case of matrix-dominated flow (Fig. 9, black empty symbols) and with the effective perco-lating macroporosity (EPMP) in case of biopore-dominated flow (Fig. 9, black filled symbols). The empirical fitting pa-rameters (AandB) for saturated hydraulic conductivity, air permeability at−30 and−100 cm matric potentials, and gas diffusivity at −30 and −100 cm matric potentials are pro-vided in Table 3. The 1 : 1 plots of measured and predicted saturated hydraulic conductivity, air permeability, and gas diffusivity are shown in Fig. 9. From Fig. 9 it is obvious that predictions with the Ahuja et al. (1984) model with novel input data from X-ray CT analysis are very reason-able and yielded better results than the conventionally pa-rameterized Ahuja et al. (1984) model. This indicates that X-ray CT-derived macropore characteristics (MP and EPMP) at
Figure 9. Predictive performance of the Ahuja et al. (1984)
model parameterized with air-filled porosity at−30 kPa (red empty symbols), X-ray CT-derived effective percolating macroporosity (EPMP) (black filled symbols), and total macroporosity (MP) (black empty symbols), respectively. Predicted (a) saturated hy-draulic conductivity,(b)air permeability at−30 cm matric poten-tial,(c)air permeability at−100 cm matric potential,(d)gas diffu-sivity at−30 cm matric potential, and(e)gas diffusivity at−100 cm matric potential.
129 µm resolution are quite useful for predicting macropore flow. However, distinguishing between biopore- and matrix-dominated flows is a prerequisite. The predictive capability of the proposed modeling framework requires further inde-pendent validation for different soil types to confirm the val-ues/ranges for empirical constantsAandBfor saturated hy-draulic conductivity, air permeability, and gas diffusivity.
4 Conclusions and perspective
While soil textural properties exhibited small spatial variabil-ity across the study site with a CV < 10 %, the macropore flow parameter saturated hydraulic conductivity, air perme-ability, and gas diffusivity showed large spatial variability across the field with a CV > 100 %.
em-pirical models predicted matrix-dominated flow reasonably well, whereas significant underpredictions were observed for cases with biopore-dominated flow. The tested empirical model for the prediction of gas diffusivity performed well at−100 cm matric potential, while it failed at−30 cm matric potential, particularly for the soil columns that contained bio-pores that were connected from the sample top to the sample bottom (i.e., biopore-flow-dominated samples).
Significant Spearman rank correlations were observed be-tween CT-derived macropore network characteristics and macropore flow parameters. These correlations were further improved when the soil columns were separated into matrix-dominated and biopore-matrix-dominated flow columns. The pre-dictive performance of the Ahuja et al. (1984) model with novel input parameters, namely X-ray CT-derived effective percolating macroporosity (EPMP) for biopore-dominated flow and total macroporosity (MP) for matrix-dominated flow, was significantly improved. However, further studies for different soil textures are required to confirm the val-ues/ranges of the empirical Ahuja et al. (1984) A and B
model parameters for accurate predictions of saturated hy-draulic conductivity, air permeability, and gas diffusivity.
The rapid development of advanced CT-image segmen-tation and analysis tools in conjunction with compusegmen-tational fluid dynamics provides promising future means to simulate the dynamics of flow and transport directly with CT-derived macropore networks as boundaries. One method particularly suitable for simulating macropore flow and transport based on X-ray CT data is the lattice Boltzmann method (LBM). Most of the studies to date that applied the LBM for simu-lating flow and transport based on CT data were for gran-ular porous media (glass beads/sand) and fractured rocks, and not for natural field soil samples. The strong correla-tions between macropore flow parameters and X-ray CT-derived macropore network characteristics observed in this study suggest that lattice Boltzmann flow and transport sim-ulations based on X-ray CT images are a promising avenue for future research.
Information about the Supplement
Data are available in the Supplement file.
The Supplement related to this article is available online at doi:10.5194/hess-20-4017-2016-supplement.
Author contributions. Muhammad Naveed, Per Moldrup,
Lis Wollesen de Jonge, and Markus Tuller designed the study and wrote the manuscript. Marcel Schaap and Hans-Jörg Vogel assisted with X-ray CT scanning and analysis. Ramaparsad Kulkarni performed image segmentation. All authors contributed to the manuscript with comments and suggestions throughout the writing process.
Acknowledgements. The technical assistance of Stig T. Rasmussen, Bodil B. Christensen, and Michael Koppelgaard is gratefully ac-knowledged. The study was part of the Soil Infrastructure, Interfaces, and Translocation Processes in Inner Space (Soil-it-is) project, which is funded by the Danish Research Council for Technology and Production Sciences.
Edited by: A. Guadagnini
Reviewed by: four anonymous referees
References
Ahuja, L. R., Naney, J. W., Green, R. E., and Nielsen, D. R.: Macro-porosity to characterize spatial variability of hydraulic conduc-tivity and effects of land management, Soil Sci. Soc. Am. J., 48, 699–702, 1984.
Bouma, J.: Comments on micro- meso- and macroporosity of soil, Soil Sci. Soc. Am. J., 45, 1244–1245, 1981.
Buckingham, E.: Contributions to our knowledge of the aerations of soils. Bur. Soil Bull. 25. US Gov. Print. Office, Washington, DC, 1904.
Chamindu Deepagoda, T. K. K., Moldrup, P., de Jonge, L. W., Kawamoto, K., and Komatsu, T.: Density-corrected models for gas diffusivity and air permeability in unsaturated soil, Vadose Zone J., 10, 226–238, 2011.
Chen, C. W., Luo, J., and Parker, K. J.: Image segmentation via adaptive K-mean clustering and knowledge-based morphologi-cal operations with biomedimorphologi-cal applications. IEEE T. Image Pro-cess., 7, 1673–1683, 1998.
Cosby, B. J., Hornberger, G. M., Clapp, R. B., and Ginn, T. R.: A statistical exploration of the relationships of soil moisture char-acteristics to the physical properties of soils, Water Resour. Res., 20, 682–690, 1984.
de Jonge, L. W., Moldrup, P., Rubaek, G. H., Schelde, K., and Djurhuus, J.: Particle leaching and particle-facilitated transport of phosphorus at field scale, Vadose Zone J., 3, 462–470, 2004. Dougherty, R. and Kunzelmann, K.: Computing local thickness of
3D structures with Image J, Microsc. Microanal., 13, 1678–1679, 2007.
Elliot, T. R., Reynolds, W. D., and Heck, R. J.: Use of existing pore models and X-ray computed tomography to predict saturated soil hydraulic conductivity, Geoderma, 156, 133–142, 2010. Feldkamp, L. A., Davis, L. C., and Kress, J. W.: Practical
cone-beam algorithm, J. Opt. Soc. Am., 1, 612–619, 1984.
Fox, G. A., Malone, R., Sabbagh, G. J., and Rojas, K.: Interrela-tionship of macropores and subsurface drainage for conservative tracer and pesticide transport, J. Environ. Qual., 33, 2281–2289, 2004.
Geological Survey of Denmark and Greenland: Digitalt kort over Danmarks jordarter 1 : 200000; GEUS rapport 1999/47, Geolog-ical Survey of Denmark and Greenland, Copenhagen, Denmark, 1999 (in Danish).
Hu, W., Shao, M. A., and Si, B. C.: Seasonal changes in surface bulk density and saturated hydraulic conductivity of natural land-scapes, Eur. J. Soil Sci., 63, 820–830, 2012.
Hu, Y., Feng, J., Yang, T., and Wang, C.: A new method to charac-terize the spatial structure of soil macropore networks in effects of cultivation using computed tomography, Hydrol. Process., 28, 3419–3431, 2014.
Iassonov, P. and Tuller, M.: Application of segmentation for cor-rection of intensity bias in X-ray computed tomography images, Vadose Zone J., 9, 187–191, 2010.
Iassonov, P., Gebrenegus, T., and Tuller, M.: Segmentation of X-ray computed tomography images of porous materials: A crucial step for characterization and quantitative analysis of pore structures, Water Resour. Res., 45, W09415, doi:10.1029/2009WR008087, 2009.
Iqbal, J., Thomasson, J. A., Jenkins, J. N., Owens, P. R., and Whisler, F. D.: Spatial variability analysis of soil physical proper-ties of alluvial soils, Soil Sci. Soc. Am. J., 69, 1338–1350, 2005. Iversen, B. V., Schjønning, P., Poulsen, T. G., and Moldrup, P.: In situ, on-site and laboratory measurements of soil air permeabil-ity: Boundary conditions and measurement scale, Soil Sci., 166, 97–106, 2001.
Iversen, B. V., Børgesen, C. D., Lægdsmand, M., Greve, M. H., Heckrath, G., and Kjærgaard, C.: Risk predicting of macropore flow using pedotransfer functions, textural maps, and modeling, Vadose Zone J., 10, 1185–1195, 2011.
Jarvis, N., Koestel, J., Messing, I., Moeys, J., and Lindahl, A.: In-fluence of soil, land use and climatic factors on the hydraulic conductivity of soil, Hydrol. Earth Syst. Sci., 17, 5185–5195, doi:10.5194/hess-17-5185-2013, 2013.
Jarvis, N. J.: A review of non-equilibrium water flow and solute transport in soil macropores: Principles, controlling factors and consequences for water quality, Eur. J. Soil Sci., 58, 523–546, 2007.
Jarvis, N. J., Moeys, J., Hollis, J. M., Reichenberger, S., Lindahl, A. M. L., and Dubus, I. G.: A conceptual model of soil susceptibility to macropore flow, Vadose Zone J., 8, 902–910, 2009.
Jassogne, L., McNeill, A., and Chittleborough, D.: 3D visualiza-tion and analysis of macro- and meso-porosity of the upper hori-zons of sodic, texture-contrast soil, Eur. J. Soil Sci., 58, 589–598, 2007.
Katuwal, S., Nørgaard, T., Moldrup, P., Lamandé, M., Wildenschild, D., and de Jonge, L. W.: Linking air and water transport in intact soils to macropore characteristics inferred from X-ray computed tomography, Geoderma, 237–238, 9–20, 2015.
Kawamoto, K., Moldrup, P., Schjønning, P., Iversen, B. V., Ko-matsu, T., and Rolston, D. E.: Gas transport parameters in the vadose zone: Development and test of power-law models for air permeability, Vadose Zone J., 5, 1205–1215, 2006.
Klute, A. and Dirksen, C.: Hydraulic conductivity and diffusivity: Laboratory methods. In Methods of Soil Analysis, Part 1, 2nd Edn. Physical and Mineralogical Methods, edited by: Klute, A., ASA-SSSA, Madison, WI, 687–734, 1986.
Kulkarni, R., Tuller, M., Fink, W., and Wildenschild, D.: Three-dimensional multiphase segmentation of X-ray CT data of porous materials using a Bayesian Markov random field frame-work, Vadose Zone J., 11, doi:10.2136/vzj2011.0082, 2012. Larsbo, M., Koestel, J., and Jarvis, N.: Relations between
macro-pore network characteristics and the degree of preferential
solute transport, Hydrol. Earth Syst. Sci., 18, 5255–5269, doi:10.5194/hess-18-5255-2014, 2014.
Lilly, A., Nemes, A., Rawls, W. J., and Pachepsky, Y. A.: Probabilis-tic approach to the identification of input variables to estimate hydraulic conductivity, Soil Sci. Soc. Am. J., 72, 16–24, 2008. Luo, L., Lin, H., and Schmidt, J.: Quantitative relationships between
soil macropore characteristics and preferential flow and trans-port, Soil Sci. Soc. Am. J., 74, 1929–1937, 2010.
Moldrup, P., Poulsen, T. G., Schjønning, P., Olsen, T., and Yam-aguchi, T.: Gas permeability in undisturbed soils: Measurements and predictive models, Soil Sci., 163, 180–189, 1998.
Moldrup, P., Olesen, T., Gamst, J., Schjønning, P., Yamaguchi, T., and Rolston, D. E.: Predicting the gas diffusion coefficient in repacked soil: Water induced linear reduction model, Soil Sci. Soc. Am. J., 64, 1588–1594, 2000.
Moustafa, M. M.: A geostatistical approach to optimize the determi-nation of saturated hydraulic conductivity for large-scale subsur-face drainage design in Egypt, Agr. Water Manage., 42, 291–312, 2000.
Naveed, M.: Revealing soil architecture and quality: Linking state-of-the-art soil biophysicochemical measurements, visualizations, and simulations, PhD thesis, Aarhus University, Aarhus, 2014. Naveed, M., Moldrup, P., Arthur, E., Wildenschild, D., Eden, M.,
Lamandé, M., Vogel, H.-J., and de Jonge, L. W.: Revealing soil structure and functional macroporosity along a clay gradient us-ing X-ray computed tomography, Soil Sci. Soc. Am. J., 77, 403– 411, 2013.
Naveed, M., Moldrup, P., Arthur, E., Holmstrup, M., Nicolaisen, M., Tuller, M., Herath, L., Hamamoto, S., Kawamoto, K., Ko-matsu, T., Vogel, H.-J., and de Jonge, L. W.: Simultaneous Loss of Soil Biodiversity and Functions Along a Copper Contamina-tion Gradient: When Soil Goes to Sleep, Soil Sci. Soc. Am. J., 78, 1239–1250, 2014a.
Naveed, M., Moldrup, P., Vogel, H.-J., Lamandé, M., Wildenschild, D., Tuller, M., and de Jonge, L.W.: Impact of long-term fertil-ization practice on soil structure evolution, Geoderma, 217–218, 181–189, 2014b.
Norgaard, T., Moldrup, P., Olesen, P., Vendelboe, A. L., Iversen, B. V., Greve, M. H., Kjaer, J., and de Jonge, L. W.: Comparative mapping of soil physical-chemical and structural parameters at field scale to identify zones of enhanced leaching risk, J. Environ. Qual., 42, 271–283, 2013.
Paradelo, M., Moldrup, P., Arthur, E., Naveed, M., Holmstrup, M., López-Periago, J. E., and de Jonge, L. W.: Effects of Past Copper Contamination and Soil Structure on Copper Leaching from Soil, J. Environ. Qual., 42, 1852–1862, 2013.
Pérèsa, G., Bellidoa, A., Curmib, P., Marmonierc, P., and Cluzeaua, D.: Relationships between earthworm communities and burrow numbers under different land use systems, Pedobiologia, 54, 37– 44, 2012.
Quinton, W. L., Hayashi, M., and Carey, S. K.: Peat hydraulic con-ductivity in cold regions and its relation to pore size and geome-try, Hydrol. Process., 22, 2829–2837, 2008.
Raczkowski, C. W., Mueller, J. P., Busscher, W. J., Bell, M. C., and McGraw, M. L.: Soil physical properties of agricultural systems in a large-scale study, Soil Till. Res., 119, 50–59, 2012. Rasband, W. S.: ImageJ, U.S. National Institutes of Health,
Rawls, W. J., Gimenez, D., and Grossman, R.: Use of soil texture, bulk density and slope of the water retention curve to predict saturated hydraulic conductivity, T. ASAE, 41, 983–988, 1998. Revil, A. and Cathles, L. M.: Permeability of shaly sands, Water
Resour. Res., 35, 651–662, 1999.
Schaap, M. G., Leij, F. L., and van Genuchten, M. T.: Rosetta: A computer program for estimating soil hydraulic parameters with hierarchical pedotransfer functions, J. Hydrol., 251, 163–176, 2001.
Schjønning, P., Eden, M., Moldrup, P., and de Jonge, L. W.: Two-chamber, two-gas and one-Two-chamber, one-gas methods for mea-suring the soil-gas diffusion coefficient: Validation and inter-calibration, Soil Sci. Soc. Am. J., 77, 729–744, 2013.
Sharma, P., Shukla, M. K., and Mexal, J. G.: Spatial variability of soil properties in agricultural fields of Southern New Mexico, Soil Sci., 176, 288–302, 2011.
Tuller, M., Kulkarni, R., and Fink, W.: Segmentation of X-ray CT data of porous materials: A review of global and locally adap-tive algorithms, edited by: Anderson, S. H. and Hopmans, J. W., Soil–water–root processes: Advances in tomography and imag-ing, SSSA Spec. Publ. 61. SSSA, Madison, WI, 157–182, 2013. USDA-NRCS Web Soil Survey 3.2: available at: http:
//websoilsurvey.nrcs.usda.gov/app/WebSoilSurvey.aspx (last access: 29 September 2016), 2010.
Vereecken, H., Maes, J., Feyen, J., and Darius, P.: Estimating the soil moisture retention characteristic from texture, bulk density, and carbon content, Soil Sci, 148, 389–403, 1989.
Vereecken, H., Weynants, M., Javaux, M., Pachepsky, Y., Schaap, M. G., and van Genuchten, M. T.: Using pedotransfer functions to estimate the van Genuchten-Mualem soil hydraulic properties: a review, Vadose Zone J., 9, 795–820, 2010.
Vogel, H.-J.: A numerical experiment on pore size, pore connec-tivity, water retention, permeability, and solute transport using network models, Eur. J. Soil Sci., 51, 99–105, 2000.
Vogel, H.-J., Weller, U., and Schlüter, S.: Quantification of soil structure based on Minkowski functions, Comput. Geosci., 36, 1236–1245, 2010.
Wang, Y., Shao, M., Liu, Z., and Horton, R.: Regional-scale varia-tion and distribuvaria-tion patterns of soil saturated hydraulic conduc-tivities in surface and subsurface layers in the loessial soils of China, J. Hydrol., 487, 13–23, 2013.
Weynants, M., Vereecken, H., and Javaux, M.: Revisiting Vereecken pedotransfer functions: Introducing a closed-form hydraulic model, Vadose Zone J., 8, 86–95, 2009.
Wösten, J. H. M., Lilly, A., Nemes, A., and Bas, C. L.: Development and use of a database of hydraulic properties of European soils, Geoderma, 90, 169–185, 1999.
Wildenschild, D. and Sheppard, A.: X-ray imaging and analysis techniques for quantifying pore-scale structure and processes in subsurface porous medium systems, Adv. Water Resour., 51, 217–246, 2013.