1
Detection ofhuman adenovirus, rotavirus, and enterovirus in tap water and their association with the overall quality of waterMuhammad Rashid, 1, *, Muhammad Naseem Khan 2,Nusrat Jalbani 2
1 National Institute of Virology, Dr. Panjwani Center for Molecular Medicine and Drug Research, (PCMD)
International Center for Chemical and Biological Sciences, University of Karachi. Karachi 75270 Pakistan.
2 Pakistan Council of Scientific and Industrial Research (PCSIR) Laboratories Karachi, Pakistan.
Running title: Detection of pathogenic viruses in drinking water
*Correspondence to:
Rashid Muhammad (https://orcid.org/0000-0002-6665-618X)
National Institute of Virology, Dr. Panjwani Center for Molecular Medicine and Drug Research, (PCMD)
International Center for Chemical and Biological Sciences, University of Karachi. Karachi 75270 Pakistan.
Phone: +92 21 99261764, 111-222-293 (136)
Fax: +92 21 34819018-9
Email: [email protected], [email protected]
2
AbstractDrinking water supplies in the developing world often serve as a biosphere for various organisms. Viral
gastroenteritis is a neglected area of research in Pakistan, there is no data for the prevalence of enteric viruses in
drinking water of the largest city of Karachi. The present study aimed to provide a survey of the existence of
enteric viruses: human adenovirus (HAdV), human enteroviruses (hEV), and genotype A rotavirus (GARV) in
tap water. Using a simple PCR approach, we detected 20%, 43%, and 23% of HAdV, hEV, and GARV in tap
water respectively. We have also shown an overall quality of tap water at the pumping station and consumer tap.
Moreover, we assessed the efficiency of small-scale water treatment methods for the removal of viruses.
3
IntroductionWater a fundamental need for life has a significant contribution to human health. Access to clean and
safe drinking water is considered a basic human right globally, however, more than 2 billion people around the
world have no luxury of drinking safe water [1]. Approximately 3.4 million people lost their lives every year
fighting water-related diseases, making it the leading cause of death around the world. Ingestion of filthy water
kills 4,000 children each day and most of them are from continent Africa and Asia [2]. Waterborne viral diseases
like Gastroenteritis has a significantly large contribution to water-related diseases and deaths. Contamination of
water with enteric viruses generally transmitted by the fecal-oral route are common causes of diarrhea in infants
and children [3]. Human adenovirus (HAdV), human enteroviruses (hEV), and genotype A rotaviruses (GARV)
are commonly reported in drinking water and mostly associated with waterborne gastroenteritis [4]–[6].
HAdV is a tough non-enveloped, double-stranded DNA virus, having more than 57 serotypes out of
which serotype 40/41 are the major causative agents of gastroenteritis. Since the survival characteristic of HAdV
is not fully understood, the United States Environmental Protection Agency (USEPA) listed adenovirus as one
of the nine microorganisms on the contamination candidate list for drinking water [7]. hEVs are positive-sense
RNA viruses, replicate in the respiratory tract and the gut, and mostly transmitted through the fecal-oral route
[8]. hEV Infections are often mild however they may cause problems in infants [9]. Rotavirus is a
double-stranded, segmented RNA virus, classified in seven groups: A-G. Group A, B and, C are known to infect human,
out of which group A is the most prominent cause of severe gastroenteritis [8], [10].GARV infections are the
major cause of dehydrating gastroenteritis in neonates and the largest contributor to children’s death in the
developing world [11].
Karachi is the largest and the most populated city of Pakistan with more than 16 million inhabitants, in
the total area of 3,780 km². Karachi is a highly urbanized and the most industrialized city, also known as the
hub for the country’s economy which attracts people from all over the country for earning their lives. The city
has become a meshwork of concrete with diminishing green belts which is associated with several environmental
and health hazards. Access to safe-water has emerged as the most important problem in recent years. Poor
infrastructure for water supply, collapsed system for sanitation, and negligence in pre-water treatments are
leading causes for several water-borne diseases in the community [12]. Unfortunately, there is no data available
for the prevalence of potentially pathogenic viruses in water, people drinking at different parts of the city. We
4
in water supplied in different parts of the city. We are providing experimental evidence that unsound andinadequate water supply system has serious health implications. We for the first time not only presenting
prevalence data for pathogenic viral contaminants in tap water but also the efficiency of small-scale treatment
procedures for the removal of viruses.
Materials and methods
Collection of water samples
From Pumping Stations: Water from three main pumping stations of Karachi: COD filter plant, NEK
new filter plant, and PIPRI filter plant were collected before and after water treatment.
From General circulation: Only fresh tap water which was supplied from main lines operated and
maintained by municipal authorities were collected during sampling. Water samples were collected mainly
from food selling shops like restaurants, tea shops, juice shops, and dairy shops. A total of 30 samples were
collected: 20 from food selling outlets, 5 from local medical care clinics, and 5 from residential houses. Each
sample was collected in two separate bottles of 1 liter. Water samples were kept at 4°C until processed for
5
Physical, chemical and bacteriological assessment of waterA pH meter, conductivity meter, and a turbidity meter were used for the determination of pH, total
dissolved solids (TDS), Electrical Conductivity (EC) and turbidity in water samples. The amount of chlorine
in the water was estimated by standard colorimetric method using N, N-dialkyl-1,4-phenylenediamine
(Sigma-Aldrich, Germany) commonly known as the DPD method [13]. The total number of live and culturable
microorganisms was measured by the heterotrophic plate count (HPC) method [14]. Briefly, ten-fold serial
dilutions of water samples were prepared in sterile PBS. One ml of each dilution was mixed with liquefied
plate count agar and poured onto Petri dishes. Petri dishes were incubated at 35 °C for 48 ±2 h. The total
number of coliforms was determined by multiple-tube fermentation techniques [15]. Briefly, for the
presumptive test, ten-fold serial dilutions of samples were prepared in peptone water (Sigma-Aldrich,
Germany) and incubated for 24-48 hours at 35 °C. Subsequently, tubes showing lactose fermentation with gas
production were considered positive for coliforms. For confirmation, loopful from each positive sample tube
was inoculated into Brilliant Green Lactose Bile (BGLB) broth tubes, (Merck, Germany) and incubated at
6
Assessment of water treatment processes on viral detectionTo understand how commonly used pre-water treatment processes affect the detection of HAdV,
hEV, and GARV, we have performed the detection of viruses before and after the treatment. Five samples all
collected from residential houses in different locations were analyzed for the effect of commercially available
3-stage water purification system which contains polypropylene yarn for first stage filtration of suspended
particles by sedimentation, second stage granular activated carbon for the removal of taste and odor of most
organic chemicals, chlorine, insecticides, pesticides, herbicides, followed by a third stage UV post-treatment
to give pure, pleasant-tasting drinking water. Moreover, the effect of heat treatment at 100 °C for 1 min was
also evaluated. Water samples were analyzed before and after each treatment process for the comparison.
Water concentration
Water samples were processed for the concentration of viral contents within 24 hours of sample
collection by using a negatively charged membrane as previously described by [16], with few modifications
suggested by Vecchia [17]. Briefly, Water samples were added with 10 ml of 2.5M MgCl2 solution to obtain a final concentration of 25 mM, and the pH adjusted to 5 by adding 10% HCl. Subsequently, the resulting
mixture was passed through a HA type negatively charged sterile membrane filter (45 mm diameter, 0.45 μm
pore size; Merck Millipore), using a vacuum pump. The HA membrane filter was then rinsed with 100 mL of
0.5 mM H2SO4 (pH 3.0) to dissolve and remove the bound magnesium from the filter. Finally, the adsorbed virus particles were eluted with 2.5 mL of 1mM NaOH (pH 10.5). The elute was collected in a tube
containing: 12.5 μL of 100 × Tris-EDTA buffer and 12.5 μL of 50 mM H2SO4 for neutralization. The elutes
were stored at -80 °C until further process.
Extraction of viral nucleic acid
Viral nucleic acids: DNA and RNA were separately extracted using QIAamp® DNA mini kit and
QIAamp® viral RNA mini kit respectively as per manufacturer’s protocol. 280 μL of concentrated water
samples were used as initial material for nucleic acid extraction and eluted nucleic acid samples were stored at
7
Complementary DNA (cDNA) synthesisNucleic acid extracted from water samples were processed for cDNA synthesis for the detection of
GARV and hEV before PCR amplification of target DNA. First-strand cDNA was synthesized using a
commercially available kit (Revert-Aid, Thermo Scientific™ USA) as per manufacturer’s protocol using
random hexamer primers. DNA from each virus-type was included as a positive control. DNA from Human
mastadenovirus 5, hEV, and GARV were generously provided by Dr. Fernando Rosado Spilki, Feevale
University, Brazil.
PCR amplification
Targetted regions of viral nucleic acid were amplified using a commercially available PCR master mix
(Thermo Scientific™ USA) according to the manufacturer’s instructions. Reaction conditions were separately
optimized for each primer set. The sequences of primers, their product size, and reaction conditions are
8
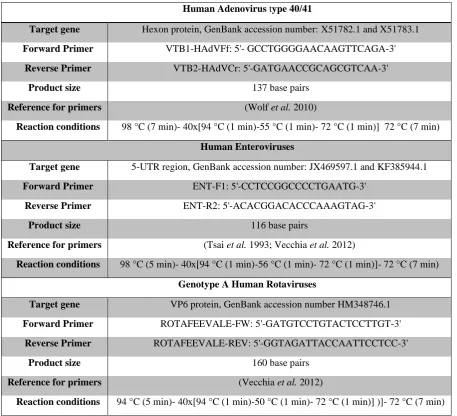
Table 1. Specific primers, their target site, oligonucleotide sequences, their product size, and reaction conditions for amplification of each primer set is given in the table.Human Adenovirus type 40/41
Target gene Hexon protein, GenBank accession number: X51782.1 and X51783.1 Forward Primer VTB1-HAdVFf: 5'- GCCTGGGGAACAAGTTCAGA-3'
Reverse Primer VTB2-HAdVCr: 5'-GATGAACCGCAGCGTCAA-3'
Product size 137 base pairs
Reference for primers (Wolf et al. 2010)
Reaction conditions 98 °C (7 min)- 40x[94 °C (1 min)-55 °C (1 min)- 72 °C (1 min)] 72 °C (7 min) Human Enteroviruses
Target gene 5-UTR region, GenBank accession number: JX469597.1 and KF385944.1
Forward Primer ENT-F1: 5'-CCTCCGGCCCCTGAATG-3'
Reverse Primer ENT-R2: 5'-ACACGGACACCCAAAGTAG-3'
Product size 116 base pairs
Reference for primers (Tsai et al. 1993; Vecchia et al. 2012)
Reaction conditions 98 °C (5 min)- 40x[94 °C (1 min)-56 °C (1 min)- 72 °C (1 min)]- 72 °C (7 min) Genotype A Human Rotaviruses
Target gene VP6 protein, GenBank accession number HM348746.1 Forward Primer ROTAFEEVALE-FW: 5'-GATGTCCTGTACTCCTTGT-3'
Reverse Primer ROTAFEEVALE-REV: 5'-GGTAGATTACCAATTCCTCC-3'
Product size 160 base pairs
Reference for primers (Vecchia et al. 2012)
9
ResultsThe quality of water was examined by different physical, chemical, and bacteriological tests. Physical
parameters including color, turbidity, TDS, odor, and taste were recorded. Chemical tests including pH,
Chlorine, Chloride, and, Electrical Conductivity (EC) were estimated. Bacteriological tests including
Heterotrophic Plate Count (HPC) and Most Probable Number (MPN) tests were performed. The results are
summarized in Table 2-4.
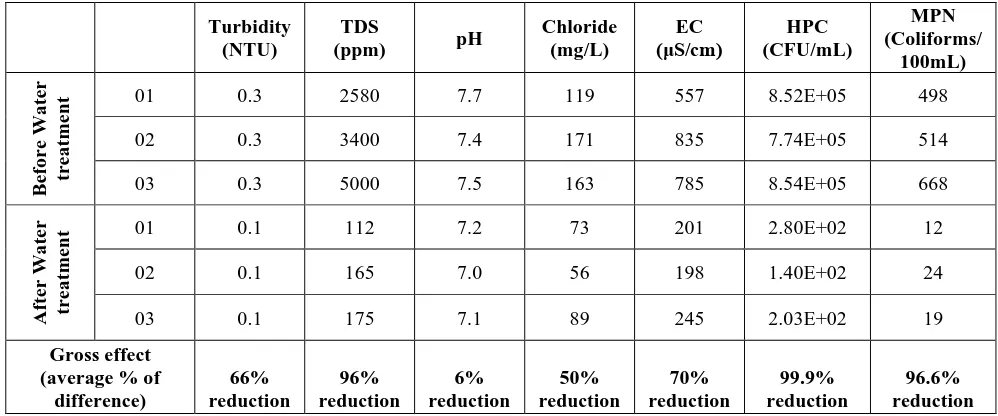
For the initial quality of water and efficiency of water treatment procedures at the pumping stations of
water supply in the city of Karachi, three water samples were collected before and after the treatment
procedure. Although the performance of treatment plants was not found perfect but they are working good and
the effect of each treatment step including coagulation, sedimentation, filtration, and disinfection is visible.
There are 66 and 96 percent reductions in turbidity and TDS of water respectively. Similarly, chloride and EC
were also found to decline 50 and 70 percent respectively. Most importantly, the disinfection procedure
eliminated 99.9 % HPCs and 96.6 % MPNs from water (Table.2A) and most of the viral contaminants
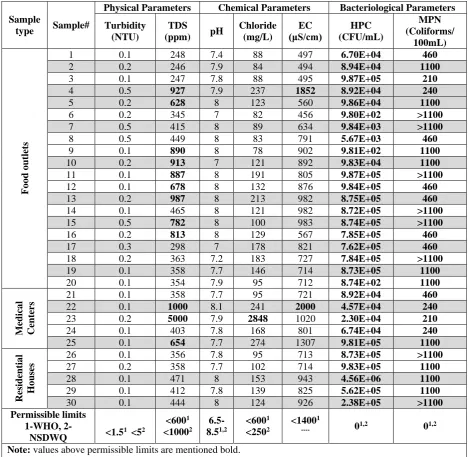
(Table.2B). A similar water assessment was performed at the consumer level (Table 3). The parameters of
drinking water quality at the consumer level were compared with permissible limits set by WHO [18], and
National Standards for Drinking Water Quality (NSDWQ), Pakistan [19]. We found alarmingly high levels of
all physical, chemical, and bacteriological parameters, far above the permissible limits.
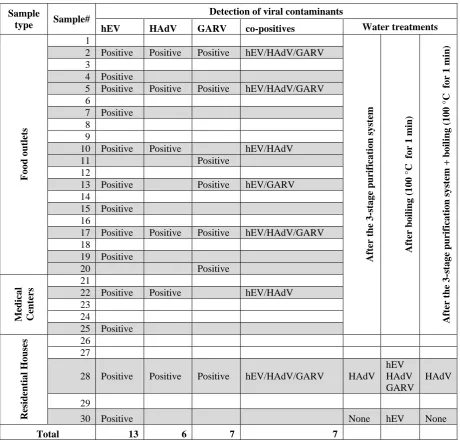
A total of 30 tap water samples were analyzed, out of which hEV were present in most of the
samples, achieving the highest detection rate of 43.33%, followed by GARV 23.33% and HAdV 20%. The
results are summarized in Table 4. Seven samples (23.33%) were found positive for more than one type of the
tested viruses, four samples (13.33%) were found co-positive for all the tested viruses (hEV, HAdV, and
GARV), six samples (20%) were found co-positive for hEV and HAdV and five samples (16.66%) were found
positive for hEV and GARV. Two samples were found positive for GARV alone and none was found positive
for HAdV alone. Moreover, five samples were included for the assessment of water purification and/or boiling
pre-treatments for their effectiveness to remove selected viral contaminants. Both treatments: 3-stage
purification system and boiling were found effective to remove nucleic acid contaminants of hEV and GARV
10
DiscussionIn the present study, we have presented a comprehensive picture of the quality of water which is
supplied in the city of Karachi for more than 200 million inhabitants. Our study for the first time investigated
the presence of pathogenic viruses in tap water, which is the most common source of drinking water in the
city. Physical and chemical assessment of water has shown large variation in different parameters, within 30
samples of water collected from different parts of the city which indicate either poor standards of water
treatment at pumping stations or poor physical containment of water between pumping stations to the
consumer. TDS of 40% water samples were found higher than 600 ppm out of which 2 samples collected from
different medical centers were found 1000 and 5000 ppm. As stated in the WHO report, the TDS value of
1000 ppm indicates poor quality of water, and above 1200 ppm is specified as unacceptable for drinking water
[20]. Total chloride in tap water was found less than 300 mg/L except for one sample (the same with TDS
5000 ppm), where chloride was found very high up to 2848 mg/L. Deliberate or undelibrate infusion of boring
water may be a possible reason for such a high level of TDS and chlorides in tap water. Similarly, there is a
large diversity in EC of samples, 53% of water samples falling above 800 µS/cm while two samples were
reported abnormally high EC of 1852 and 2000 µS/cm. EC of domestic tap water typically ranges between
500-800, these higher levels of EC imply the higher concentration of dissolved salts and has similarity to
groundwater [21].
Bacteriological investigation of tap water samples revealed more inquisitive findings. Out of 30
samples, no sample was found negative for HPC and also for coliform. The ranges for a total number of HPC
and coliform were found 8.7×10²-4.5×10⁶ CFU/mL and 210 to uncountable coliforms/100mL respectively. These higher numbers of bacteria in tap water pose a serious health concern for the general population. Both
national [19] and international [18], [22] guidelines are set on zero detectable organisms in treated water.
These findings indicate serious negligence in the enforcement of SOPs for water treatment and processing,
poor maintenance of water pipelines, and most importantly inappropriate planning of Water supply and
Sewage disposal systems [23].
In this study, our focus was the detection of pathogenic viruses in tap water and their association with
the quality of water. We were able to detect all targeted viruses (hEV, HAdV, and GARV). Out of 20
sampling food outlets, 60% were found with viral contaminants in their tap water. Overall, 30 samples were
11
HAdV (20%) in tap water samples from the city of Karachi. 13% of water samples were found contaminatedwith all three (hEV, HAdV, and GARV) viral genomes (Table 4). Most of the samples found contaminated
with viruses were also recorded higher in HPCs and MNPs. 69% of the viral contaminated samples were
found with 1100 coliforms/100mL, which is the highest possible count for MNPs. This situation of the city of
Karachi is far worse than other metropolitan cities of Pakistan: Islamabad, Rawalpindi, Lahore [24], and
Peshawar [25]. The detection of viral genome in water samples does not directly correspond to the quality of
water treatment at remote water pumping station [26]–[28] but largely depends on the supply system. Leaky
pipes, faulty water reservoirs, and illegal tapping of pipelines are very common in the network of Karachi
water supply and are the main reasons for poor water quality and heavy viral contamination [29].
We have also examined consumer-based common water treatment procedures for their effectivity for
the removal of viral contaminants. 3-stage water purification system and boiling water are the most common
water treatment methods, we investigated both methods individually and in combination. We noticed no
difference in the detection of any viral genomes after boiling, whereas, 3-stage water purification system can
remove the viral genomes of hEV and GARV but not HAdV. Treatment in combination has no additional
effect on the detection of the viral genome. These findings show that the boiling of water does not affect PCR
based detection of viruses, however, the viability and infectivity of viruses have not been analyzed.
Our study has presented an overall picture of the quality of water supplied in Karachi. For the first
time, we have experimentally shown that poor design and construction of the water supply system allow
different pathogens to concentrate in water. A large number of detectable bacteria and pathogenic viruses in
tap water is alarming and indicate serious environmental contamination of water. This data provide evidence
that tap water in Karachi is not safe for drinking without treatment. The 3-stage water purification system is a
good means for small scale water purification. The presence of hEV and GARV and HAdV genome in
drinking water poses a serious health risk and provides a possible reason for the very high incidence rate of
viral diarrhea in Karachi.
Conflicts of interests
The authors declared no potential conflict of interest concerning the research, authorship, and/or
12
FundingThe research was carried out with the financial support from the International Center for Chemical
and Biological Sciences (ICCBS), Karachi, Pakistan under the program of Young Researcher Support
Program.
Acknowledgment
The authors would like to thank Dr. Fernando Rosado Spilki for his generous support in this project
by providing viral DNA. Financial support from the International Center for Chemical and Biological Sciences
(ICCBS), Karachi, Pakistan, through an institutional fund for the Young Researcher Support Program is
gratefully acknowledged.
Reference
[1] UNICEF and WHO, “Safely managed drinking water - thematic report on drinking water.,” World Heal.
Organ., 2017.
[2] J. Berman, “WHO: Waterborne Disease is World’s Leading Killer,” Voice of America (VOA),
29-Oct-2009.
[3] WHO, “WHO World Water Day Report,” 2001.
[4] A. Bosch, “Human enteric viruses in the water environment: a minireview,” Int Microbiol, vol. 1, no. 3,
pp. 191–196, 1998.
[5] A. P. Wyn-Jones and J. Sellwood, “Enteric viruses in the aquatic environment,” J Appl Microbiol, vol.
91, no. 6, pp. 945–962, 2001.
[6] C. L. F. Walker et al., “Global burden of childhood pneumonia and diarrhoea,” Lancet, vol. 381, no.
9875, pp. 1405–1416, 2013.
[7] S. C. Jiang, “Human adenoviruses in water: occurrence and health implications: a critical review,” Env.
13
[8] D. Rodriguez-Lazaro et al., “Virus hazards from food, water and other contaminated environments,”FEMS Microbiol Rev, vol. 36, no. 4, pp. 786–814, 2012.
[9] T. C. Lee, H. R. Guo, H. J. Su, Y. C. Yang, H. L. Chang, and K. T. Chen, “Diseases caused by
enterovirus 71 infection,” Pediatr Infect Dis J, vol. 28, no. 10, pp. 904–910, 2009.
[10] K. Nagamine, T. Hase, and T. Notomi, “Accelerated reaction by loop-mediated isothermal amplification
using loop primers,” Mol Cell Probes, vol. 16, no. 3, pp. 223–229, 2002.
[11] U. D. Parashar, C. J. Gibson, J. S. Bresee, and R. I. Glass, “Rotavirus and severe childhood diarrhea,”
Emerg Infect Dis, vol. 12, no. 2, pp. 304–306, 2006.
[12] S. P. Luby, M. Agboatwalla, and R. M. Hoekstra, “The variability of childhood diarrhea in Karachi,
Pakistan, 2002-2006,” Am J Trop Med Hyg, vol. 84, no. 6, pp. 870–877, 2011.
[13] A. T. Palin, “The Determination of Free and Combined Chlorine in Water by the Use of
Diethyl-p-phenylene Diamine,” J. Am. Water Works Assoc., vol. 49, no. 7, pp. 873–880, 1957.
[14] F. W. Gilcreas, “Standard methods for the examination of water and waste water,” Am J Public Heal.
Nations Heal., vol. 56, no. 3, pp. 387–388, 1966.
[15] S. C. Edberg, M. J. Allen, and D. B. Smith, “National field evaluation of a defined substrate method for
the simultaneous enumeration of total coliforms and Escherichia coli from drinking water: comparison
with the standard multiple tube fermentation method,” Appl Env. Microbiol, vol. 54, no. 6, pp. 1595–
1601, 1988.
[16] H. Katayama, A. Shimasaki, and S. Ohgaki, “Development of a virus concentration method and its
application to detection of enterovirus and norwalk virus from coastal seawater,” Appl Env. Microbiol,
vol. 68, no. 3, pp. 1033–1039, 2002.
[17] A. D. Vecchia et al., “First description of Adenovirus, Enterovirus, Rotavirus and Torque teno virus in
water samples collected from the Arroio Diluvio, Porto Alegre, Brazil,” Braz J Biol, vol. 72, no. 2, pp.
323–329, 2012.
[18] WHO, “Guidelines for Drinking-Water Quality,” World Heal. Organ., no. 4th ed. Geneva, Switzerland,
14
[19] PEPAME, “NATIONAL STANDARDS FOR DRINKING WATER QUALITY,” PAKISTAN Environ.Prot. AGENCY Minist. Environ., 2010.
[20] WHO, “Total dissolved solids in Drinking-water,” 2003.
[21] A. Roy, T. Keesari, H. Mohokar, U. K. Sinha, and S. Bitra, “Assessment of groundwater quality in hard
rock aquifer of central Telangana state for drinking and agriculture purposes,” Appl. Water Sci., vol. 8,
no. 5, p. 124, 2018.
[22] WHO, “Guidelines for drinking-water quality, fourth edition,” 2011.
[23] J. C. J. Bartram M. Exner, A. G. C. Fricker, J. C. J. Bartram M. Exner, and A. G. C. Fricker,
“Heterotrophic Plate Counts andDrinking-water Safety ,” World Heal. Organ., 2003.
[24] T. Ahmad, S. Anjum, M. S. Afzal, H. Raza, N. U. Zaidi, and N. Arshad, “Molecular Confirmation of
Enterovirus from Sewage and Drinking Water Samples from Three Cities, Pakistan: A Potential Risk
Factor for Public Health,” Southeast Asian J Trop Med Public Heal., vol. 46, no. 4, pp. 640–649, 2015.
[25] T. Ahmad et al., “Prevalence of rotavirus, adenovirus, hepatitis A virus and enterovirus in water
samples collected from different region of Peshawar, Pakistan,” Ann Agric Env. Med, vol. 23, no. 4, pp.
576–580, 2016.
[26] M. M. Ehlers, W. O. Grabow, and D. N. Pavlov, “Detection of enteroviruses in untreated and treated
drinking water supplies in South Africa,” Water Res, vol. 39, no. 11, pp. 2253–2258, 2005.
[27] J. Heerden, M. M. Ehlers, J. C. Vivier, and W. O. Grabow, “Risk assessment of adenoviruses detected
in treated drinking water and recreational water,” J Appl Microbiol, vol. 99, no. 4, pp. 926–933, 2005.
[28] X. Y. Ye et al., “Real-time PCR detection of enteric viruses in source water and treated drinking water
in Wuhan, China,” Curr Microbiol, vol. 65, no. 3, pp. 244–253, 2012.
[29] Z. T. Ebrahim, “Revealed: 91% of Karachi’s water unfit to drink,” thethirdpole.net, 2017.
Table 2A. Assessment of different physical, chemical, and bacteriological parameters in water supplied to the city of Karachi, before and after the treatment process at main water pumping stations.
Sample
type Sample# Physical Parameters Chemical Parameters
15
Turbidity(NTU)
TDS
(ppm) pH
Chloride (mg/L) EC (μS/cm) HPC (CFU/mL) MPN (Coliforms/ 100mL) B ef o re Wa ter tre a tment
01 0.3 2580 7.7 119 557 8.52E+05 498
02 0.3 3400 7.4 171 835 7.74E+05 514
03 0.3 5000 7.5 163 785 8.54E+05 668
Af ter Wa ter tre a tment
01 0.1 112 7.2 73 201 2.80E+02 12
02 0.1 165 7.0 56 198 1.40E+02 24
03 0.1 175 7.1 89 245 2.03E+02 19
Gross effect (average % of
difference) 66% reduction 96% reduction 6% reduction 50% reduction 70% reduction 99.9% reduction 96.6% reduction
Table 2B. Detection of selected viral contaminants in water supplied to the city of Karachi, before and after the treatment process at main water pumping stations.
Detection of viral contaminants
Sample Before Water treatment After Water treatment Gross effect (average % of difference)
01 hEV 100% reduction
02 hEV/HAdV/GARV HAdV 66% reduction
16
Table 3. Assessment of different physical, chemical and bacteriological parameters in tap water samples, in comparison to maximum permissible limits set by WHO [18], [22] and NSDWQ, Pakistan [19]Sample
type Sample#
Physical Parameters Chemical Parameters Bacteriological Parameters Turbidity
(NTU)
TDS
(ppm) pH
Chloride (mg/L) EC (μS/cm) HPC (CFU/mL) MPN (Coliforms/ 100mL) F o o d o utle ts
1 0.1 248 7.4 88 497 6.70E+04 460
2 0.2 246 7.9 84 494 8.94E+04 1100
3 0.1 247 7.8 88 495 9.87E+05 210
4 0.5 927 7.9 237 1852 8.92E+04 240
5 0.2 628 8 123 560 9.86E+04 1100
6 0.2 345 7 82 456 9.80E+02 >1100
7 0.5 415 8 89 634 9.84E+03 >1100
8 0.5 449 8 83 791 5.67E+03 460
9 0.1 890 8 78 902 9.81E+02 1100
10 0.2 913 7 121 892 9.83E+04 1100
11 0.1 887 8 191 805 9.87E+05 >1100
12 0.1 678 8 132 876 9.84E+05 460
13 0.2 987 8 213 982 8.75E+05 460
14 0.1 465 8 121 982 8.72E+05 >1100
15 0.5 782 8 100 983 8.74E+05 >1100
16 0.2 813 8 129 567 7.85E+05 460
17 0.3 298 7 178 821 7.62E+05 460
18 0.2 363 7.2 183 727 7.84E+05 >1100
19 0.1 358 7.7 146 714 8.73E+05 1100
20 0.1 354 7.9 95 712 8.74E+02 1100
M
edica
l
Cent
er
s 21 22 0.1 0.1 1000 358 7.7 8.1 241 95 2000 721 4.57E+04 8.92E+04 460 240
23 0.2 5000 7.9 2848 1020 2.30E+04 210
24 0.1 403 7.8 168 801 6.74E+04 240
25 0.1 654 7.7 274 1307 9.81E+05 1100
Resid ent ia l H o us es
26 0.1 356 7.8 95 713 8.73E+05 >1100
27 0.2 358 7.7 102 714 9.83E+05 1100
28 0.1 471 8 153 943 4.56E+06 1100
29 0.1 412 7.8 139 825 5.62E+05 1100
30 0.1 444 8 124 926 2.38E+05 >1100
Permissible limits 1-WHO,
2-NSDWQ <1.5 1 <52
<6001 <10002 6.5-8.51,2 <6001 <2502 <14001
---- 01,2 01,2
Note: values above permissible limits are mentioned bold.
17
Table 4. Detectable prevalence of selected viral contaminants and the effect of common pre-treatment house-hold methods on the detection of viral contaminants in tap water are shown.Sample
type Sample#
Detection of viral contaminants
hEV HAdV GARV co-positives Water treatments
F o o d o utle ts 1 Af ter t he 3 -s ta g e pu rif ica tio n sy st em Af ter bo ilin g ( 1 0 0 °C fo r 1 min ) Af ter t he 3 -s ta g e pu rif ica tio n sy st em + bo il ing ( 1 0 0 °C fo r 1 min )
2 Positive Positive Positive hEV/HAdV/GARV
3
4 Positive
5 Positive Positive Positive hEV/HAdV/GARV
6
7 Positive
8
9
10 Positive Positive hEV/HAdV
11 Positive
12
13 Positive Positive hEV/GARV
14
15 Positive
16
17 Positive Positive Positive hEV/HAdV/GARV
18
19 Positive
20 Positive
M
edica
l
Cent
er
s 21 22 Positive Positive hEV/HAdV
23
24
25 Positive
Resid ent ia l H o us e
s 26
27
28 Positive Positive Positive hEV/HAdV/GARV HAdV hEV HAdV GARV
HAdV
29
30 Positive None hEV None