Comparative study on the physicochemical and
bacteriological quality of some drinking water
sources in Abuja, Nigeria
Sadiya Atiku
1, Chukwuma C. Ogbaga *
1, Olatunbosun O. Alonge
2, Onyinye F. Nwagbara *
1 1Department of biological sciences, Nile University of Nigeria, Abuja, Nigeria 2
Department of biological sciences, Baze University, Abuja, Nigeria [email protected]
Abstract— Diseases caused by contaminated water consumption and poor hygiene are among the leading cause of death in children, the elderly and people with compromised immune system. The present study aims to assess the drinking water quality of some selected drinking water sources in the chosen study area using water quality index (WQI). Samples of drinking waters were collected from four different sources- river, sachet (packaged), borehole and well in Jabi, Abuja, Nigeria for physicochemical and bacteriological analyses using standard methods. With the exception of pH, river water had the highest content of all the physicochemical parameters examined. Some of the physicochemical parameters such as temperature and pH determined in this study were mostly within the World Health Organization (WHO) standard. The bacteriological analyses
revealed that the highest total viable counts of 1.54 (0.12) x 102
(cfu/ml) were obtained in the river sample while the least values
of 0.03 (0.00) x 102 (cfu/ml) were obtained in the sachet water.
Three bacterial isolates of Escherichia coli, Pseudomonas spp and Aeromonas spp were isolated from well water while Pseudomonas spp and Proteus spp were isolated from borehole water. All other bacteria were isolated from the river. The study demonstrates that the safest drinking water source in Idu district, Jabi, Abuja is the sachet/packaged water while the least safe is the river water due to the presence of significant opportunistic pathogens. The results of this study are beneficial for water quality management and could be used for low-cost effective water quality assessment in Jabi.
Keywords— bacteria isolates; bacteria; water sources;
physicochemical parameters; bacteriological parameters
I. INTRODUCTION
Water is an essential element for the survival of all living organisms. In humans, it is shown to make up about 70% of the body mass [1]. The human physiological activities are thereof dependent on water availability. Many infectious diseases in developing countries are associated with contaminated water [2]. Thus good drinking water is a luxury but one of the most essential requirements of life [3].
Studies have shown that over one billion people in the world lack access to safe drinking water and 2.5 billion people do not have access to adequate sanitation services [2]. In many developing countries including Nigeria, clean pipe borne water availability is limited and inadequate for the teeming population. Thus, an increasing number of people in semi-urban areas in the country depend on dug wells and water vendors for water supply [4].
Due to the inability of government to meet the ever increasing water demand, people resort to ground water sources such as shallow wells and boreholes as alternative water resources [5]. Natural groundwater is usually of good quality but this can deteriorate due to inadequate source of protection and poor resource management. The mechanism of groundwater recharge and natural attenuation capacity also depends on soil type and geomorphologic characteristics. Groundwater contamination may also be exposed to waste disposal [6]. Pollution of ground water stems from different sources that include insanitary condition during borehole construction, splashing of runoff into wells, if left uncovered, flooding at borehole site, leachate from old burned waste pit or latrine into the hole through cracks in aquifer and annular of the hole [7]. Other sources of contamination include closeness of borehole to septic tanks especially where space is a constraint and boreholes are drilled around the area [7]. A borehole is a hydraulic structure which when properly designed and constructed permits the economic withdrawals of water from aquifer. The water serves as the major source of drinking water in the local population of Nigeria, since only very few can afford and rely on purified and treated bottled water for consumption [8].
Majority of the human population in semi-urban and urban areas in Nigeria are heavily reliant on well water as the main source of water supply for drinking and domestic use due to inadequate provision of portable pipe borne water. These ground water sources can easily be contaminated by faecal matter and thus increase the incidence and outbreaks of preventable water borne diseases[9].
Packaged water is any potable water that is manufactured or processed for sale which is sealed into food-grade bottles, sachet or other containers and intended for human consumption [10]. Sale of packaged water has exploded all over the world in recent years, largely as a result of public perception that it is safe, taste better and has a better quality compared to raw tap water [11-12]. The increment in consumption globally could also be attributed to the increase in per capita use as well as population growth [13-14].
Packaged water has been implicated as a source of outbreak of cholera and typhoid fever as well as traveler’s disease in countries such as Portugal and Spain [15-17]. Several studies have shown that packaged water can be contaminated with bacteria at various stages of production [18-19]. Under improper or prolonged storage of bottled water, bacteria can grow to levels that may be harmful to human health [10]. The need to study the bacterial load and physicochemical qualities of these water bodies as source of drinking water is necessitated by the presence of dead vegetation, heavy metal leachates from solid waste dump, domestic and industrial sewages, surface runoffs from agricultural farms [20]. Surface waters are typified by the streams, lake, ponds, and rivers amongst others. The pollution of these water bodies first affects the chemical quality and then systematically destroys the community disrupting the delicate food web [20].
Accurate and timely information on the quality of water is necessary to shape a sound public policy and to implement the water quality improvement programme efficiently. One of the most effective ways to communicate information on water quality trends is with indices. The water quality index (WQI) is commonly used for the detection and evaluation of water pollution and may be defined as ‘a rating reflecting the composite influence of different quality parameters on the overall quality of water’ [21]. The indices are broadly characterized into two parts: the physicochemical and biological (bacteriological) indices.
Physicochemical indices are based on the values of various physicochemical qualities in a water sample. These are vital for water quality monitoring [22]. A number of scientific procedures and tools have been developed to assess the water contaminants [23]. These procedures include the analyses of different parameters such as pH, turbidity, temperature, dissolved oxygen, alkalinity amongst others. These parameters can affect the drinking water quality, if their values are in higher concentrations than the safe limits set by the World Health Organization (WHO) and other regulatory bodies [24].
Bacteriological indices are derived from the biological information and are determined using the species composition of the sample, the diversity as well as the distribution pattern, the presence or absence of the indicator species or groups [25]. Bacterial contamination of drinking water is a major public health problem worldwide; because this water can be an important vehicle of diarrheal diseases; thus the need to evaluate the bacterial quality [26] .
Monitoring the bacterial quality of drinking water is done through laboratory testing for the coliform groups. The total coliform refers to a large assemblage of gram-negative, rod shaped bacteria that share several characteristics. These include E. coli, Klebsiella, Enterobacter, Streptococcus, Staphyloccocus spp etc.
Access to safe drinking water is key to sustainable development and essential to food production, quality health care and poverty reduction. Safe drinking water is essential to life and a satisfactory safe supply must be made available to consumers. Water is thus becoming a crucial factor for development and the quality of life in many countries. The water intended for human consumption must not contain pathogens or harmful chemicals. Therefore, it has necessitated the studying of bacteriological and physicochemical quality of some drinking water samples available in Idu district, Jabi, Abuja.
Before water can be described as potable, it has to comply with certain physical, chemical and microbiological standards which are designed to ensure that the water is potable, safe for drinking thus studies have been conducted to ascertain these parameters in varying drinking water sources [27-32], well water [33-37], borehole water [38-43], lake [44], packaged water [45-46] and stream/river water [47-48]. It on these bases that this research is conducted to determine the qualities of drinking water sources in Idu district, Abuja, Nigeria.
The aim of this study was to determine the bacteriological and physicochemical quality of selected drinking water sources in Idu Industrial District of Federal Capital Territory (FCT) Abuja, Nigeria using some water quality index (WQI).
II. MATERIALSANDMETHODS
A. Description of the study area
The study was conducted in Idu Industrial District, Jabi, Federal Capital Territory, Abuja, Nigeria. It is located in the North-Central geopolitical zone of Nigeria known as middle belt region.
B. Field sampling and analytical procedures
Water samples from ten borehole sites, ten popular sachets water popularly referred to as ‘pure water’ in Nigeria, ten well water and three points of water from Nile University stream (river). The samples were collected from the stream in Nile University and Idu industrial layout. Two sachet water packs of the same brand bought at different points were analyzed and the average values obtained represented the value for each of the parameter determined in the brand. Water samples were collected and stored in sterile 1500 cm3 clean polythene bottle containers. Preservation of samples was carried out as prescribed by American Public Health
C. Physicochemical analysis
The physicochemical parameters were determined in
accordance with the method of APHA[22]. The water sample temperature was taken immediately at the site of water collection using a simple thermometer calibrated in degree Celsius. The pH was measured using a veneer pH meter. The pH was determined using the procedure described by APHA[22].
Electrical conductivity measurement was done using a digital conductivity meter model NATOP PB5 (London, UK). Standardization of the meter was performed using 0.1N KCl at 25°C.
Turbidity measurement was conducted using a digital turbidity meter (2100AN HARCH Model). The meter was standardized with clean deionized water, and this was introduced into the water samples. The turbidity reading of each sample was then recorded.
The total dissolved solid was determined using a conductivity meter, the programme menu of the conductivity meter was switched to total dissolved solid, 100cm3 of the sample was measured into the beaker and the electrode was introduced into the sample. The results of the total dissolved solid were displayed and recorded [22].
Determination of total hardness was conducted by measuring 10cm3 of water pipetted into a conical flask. 1cm3 of buffer solution (NH4Cl) with pH =10 and 3 drops of Erichrome black T indicator were added to the flask. The mixture was then titrated with 0.01M ethyl diamine tetra acetic acid (EDTA) until the colour changed from wine red to blue. The procedure was repeated two more times to obtain the average liter value [49].
The determination of total alkalinity was done by measuring 100cm3 of water into a beaker where 2 – 3 drops of phenolphthalein indicator was added. Colour change was observed following the titration with 0.1N HCl until the colour changed from pink to colourless [50].
The Alsterberg (Azide) modification of Winkler method was used to determine dissolved oxygen (DO), where 250ml of water sample was transferred from aspirator tap into a 250ml reagent bottle. The water was allowed to over flow, flushing the bottle with about twice its volume of sample and the entrainment of air bubble was avoided. The bottle was disconnected and covered ensuring that no air bubbles were trapped. The cover was removed carefully and 2ml Manganese sulphate followed by 2ml alkaline azide solution were added. The cover was replaced taking care to ensure that no air bubbles were introduced. A white to brownish coloured precipitate was formed. The intensity of the brown colour of the precipitate was proportional to the amount of oxygen present. The bottle was inverted vigorously a few times to ensure thorough mixing up of the reagents with the water sample. The flocculent precipitate was allowed to settle down. After the second shaking, the flocculent precipitate settled down to about 1/3 of the volume of the bottle. Carefully the glass cover was removed and 2ml of concentrated sulphuric
acid added. The acid was run along the neck of the bottle. The cover was replaced without trapping air bubble. The bottle was vigorously and repeatedly inverted until the precipitate dissolved leaving the yellow colour of free iodine. 200ml of the sample was transferred into a conical flask placed on a white surface, using a pipette. 0.025N sodium thiosulphate was titrated rotating the flask until sample became faint pale yellow in colour. 1ml or 5 drops of starch solution was added and sample turned dark blue. Calculation:
Dissolved oxygen (mg/L) =
Where V(D) = volume of Na2S2O3 used in titration, N(D) = normality of Na2S2O3 = 0.025
D. Bacteriological Analysis
Bacteriological assessments were carried out using Total Aerobic Plate Count. The following media were used for culturing, nutrient agar, lactose broth and eosin methylene blue agar. All the media were prepared according to the Manufacturer’s specification. Total coliform counts were carried out by the standard plate count technique using MacConkey agar. Faecal coliform was determined using Eosin methylene blue medium via pour plate technique. The confirmations of the isolate were done using lactose broth at 44.5oC.
Aliquots of 0.1ml of undiluted water sample and water at dilutions of 10-1 and 10-2 were plated on Nutrient agar plates in three replicate. The plates were placed in inverted positions and incubated at 37oC for 48h, before enumeration by a colony counter.
Coliform count was performed using the three tube assay of the most portable number (MPN) technique. Presumptive coliform test was performed using MacConkey broth. The first set of the three tubes had sterile 10ml double strength broth and the second and third sets had 10ml single strength broth. All the tubes contained Durham tubes before sterilization. The three sets of the tubes received 10ml, 1ml and 0.1ml quantities of water samples using sterile pipettes. The tubes were incubated at 37oC for 24 – 48h for estimation of total coliform and at 44.5°C for faecal coliforms for 24 - 48h and examined for acid and gas production. Acid production was determined by colour change of the broth from reddish purple to yellow and gas production was checked for by entrapment of gas in the Durham tube. The MPN was then estimated from the MPN table for three tube test.
Confirmation test was carried out by transferring a loopful of culture from a positive tube from the presumptive test into a tube of brilliant green lactose bile broth with Durham tubes. The tubes were incubated at 37°C for 24 – 48h for total coliforms and 44.5°C for faecal coliforms and observed for gas production.
identified as coliforms or faecal coliforms (Escherichia coli) using morphology and biochemical test. For faecal coliforms, colonies with green metallic sheen were Gram stained and the IMViC test were carried out on Nutrient agar stock cultures and used to identify the colony as E. coli. The MPN per 100ml water was calculated using the completed test.
In the identification of the bacterial isolates, stock cultures of the isolates with different cultural characteristics were made on nutrient agar slants. Gram staining was used to check for their morphology and biochemical tests were performed to aid in identification. Biochemical tests were performed to further identify the isolates and they include the oxidase test, motility test, catalase test, urease test, coagulase test, indole test, methyl red test, voges-proskauer test and citrate utilization test.
E. Data Analysis
All data were presented as mean ± standard error. The data were analyzed using single factor analysis of variance; thereafter individual means were compared using student’s-test. Significance differences were considered at either 5% probability level.
III. RESULTS AND DISCUSSION
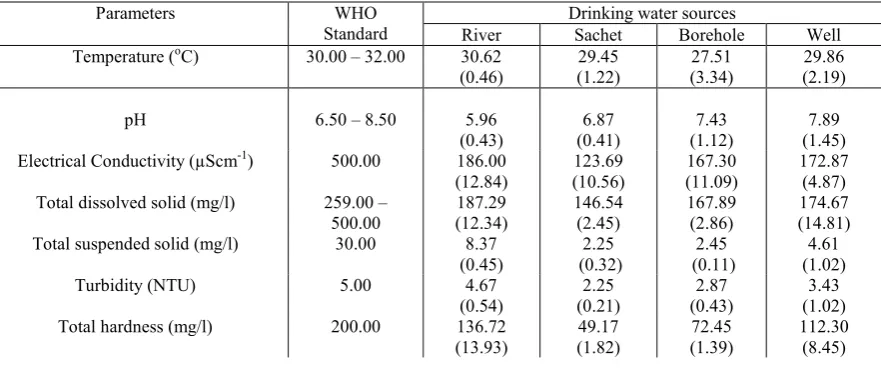
The sampled physicochemical parameters were, temperature, pH, conductivity, turbidity, total dissolved solid, total suspended solid, total hardness, total alkalinity and dissolved oxygen as presented in Table 3.1.
The temperature of the sampled waters ranged from 27.51 (3.34)°C to 30.62 (0.46)°C in water samples examined. The highest and least pH values of 7.89 (1.45) and 5.96 (0.43)
were recorded in well and river water samples respectively. The only slightly acidic water sample was the river water. The only water sample pH outside the recommended range by WHO was the river water sample. However, there was no significant difference (p>0.05) in the values of pH obtained from the water samples.
The total suspended solids recorded in this study were within the minimal limits. The highest value of 8.37 (0.45) mg/l was recorded in the river sample while the least value of 2.25 (0.11) mg/l was recorded in the sachet water samples. Similarly, the total dissolved solid were within the range of 146.54 (2.45) mg/l in sachet water and 187.29 (12.34) mg/l in river water sample.
The electrical conductivity values ranged from 123.69 (10.56) µScm-1 to 186.00 (12.84) µScm-1 in sachet water sample and the river water sample. These values were not significantly different (p>0.05) as they were within the recommended limit of WHO standard.
The values of the monitored total alkalinity revealed the following order of magnitude: river>well>borehole>sachet waters; thus 119.42 (12.65)>116.32 (17.92)>101.05 (11.01)> 80.31 (0.21) with no significant difference (p>0.05).
The values of water hardness recorded revealed that three of the sampled waters were grouped into moderate hardness thus, the river, well and borehole with the following values 136.72 (13.93) mg/l, 112.30 (8.45) mg/l and 72.45 (1.39) mg/l respectively while the hardness of 49.17 (1.82) recorded in the sampled sachet water was grouped as soft hardness.
Table 3.1: Mean (Standard error) of selected physicochemical parameters of sampled drinking water sources in Jabi District of FCT, Abuja. NS- not stated.
Parameters WHO
Standard
Drinking water sources
River Sachet Borehole Well Temperature (oC) 30.00 – 32.00 30.62
(0.46)
29.45 (1.22)
27.51 (3.34)
29.86 (2.19)
pH 6.50 – 8.50 5.96
(0.43)
6.87 (0.41)
7.43 (1.12)
7.89 (1.45) Electrical Conductivity (µScm-1) 500.00 186.00
(12.84)
123.69 (10.56)
167.30 (11.09)
172.87 (4.87) Total dissolved solid (mg/l) 259.00 –
500.00
187.29 (12.34)
146.54 (2.45)
167.89 (2.86)
174.67 (14.81) Total suspended solid (mg/l) 30.00 8.37
(0.45)
2.25 (0.32)
2.45 (0.11)
4.61 (1.02)
Turbidity (NTU) 5.00 4.67
(0.54)
2.25 (0.21)
2.87 (0.43)
3.43 (1.02) Total hardness (mg/l) 200.00 136.72
(13.93)
49.17 (1.82)
72.45 (1.39)
Free carbon (iv) oxide NS 1.45 (0.43)
0.09 (0.00)
0.11 (0.01)
0.31 (0.02) Total alkalinity (mg/l) 120 119.42
(12.65)
80.31 (0.21) 101.05 (11.01)
116.32 (17.92)
Dissolved oxygen 7.50 12.45
(1.48)
6.32 (1.04)
5.44 (0.31)
5.86 (0.22)
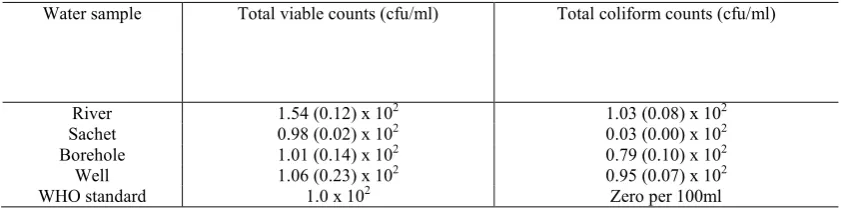
The viable and total coliform counts of bacteria in the different water samples are presented in Table 3.2. The total viable counts was recorded to be highest in river sample as 1.54 (0.12) x 102 (cfu/ml) while the least values were recorded in sampled sachet water as 0.03 (0.00) x 102 (cfu/ml). All the obtained values are slightly higher than WHO standard except
that of the sachet water. However, some of the values obtained were in the range of WHO standard.
Table 3.2: Total Aerobic Plate Count Mean (Standard error) of bacteriological analyses (coliform count) sampled drinking water sources in Jabi, Abuja
Water sample Total viable counts (cfu/ml) Total coliform counts (cfu/ml)
River 1.54 (0.12) x 102 1.03 (0.08) x 102
Sachet 0.98 (0.02) x 102 0.03 (0.00) x 102
Borehole 1.01 (0.14) x 102 0.79 (0.10) x 102
Well 1.06 (0.23) x 102 0.95 (0.07) x 102
WHO standard 1.0 x 10² Zero per 100ml
A. Bacteriological analyses
In this study, the total bacterial and coliform counts were lowest in sachet water relative to the other water sources. Despite the high values in other water sources, these parameters were lower than those reported by [27] in sampled wells of Idi Ayunre community, Oyo State; [33] in sampled wells in Samaru, Zaria, Kaduna State; [35] from well samples in Kaduna metropolis and [37] in well water in Makurdi town, Benue State. An indication that the water sources in Abuja are safer for drinking compared with aforementioned states of the country.
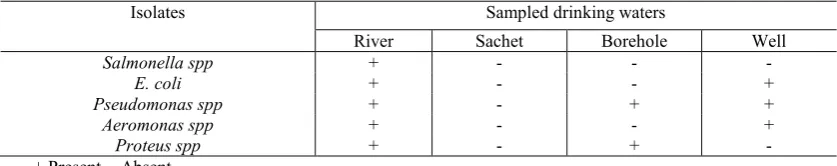
These counts were less in sampled borehole water in Abuja compared to that reported by [39] in Eyaen community Area of Edo State, Nigeria; [43] in Uli, Nigeria. In this study, few pathogens of public health such as Salmonella typhii, Aeromonas spp and Escherichia coli were isolated from river, borehole and well water sources. This is consistent with the work of [39] in Eyaen community Area of Edo State, Nigeria were pathogens such as Salmonella, Shigella and Vibrio cholera were isolated. The Pseudomas spp is perhaps widely distributed in soil and water [9, 51]. Hence, was isolated from all the ground water sources. However, despite the high level of pathogenic bacteria isolates from river sample in Jabi, Abuja, it cannot be compared with the
Mimyak river in Kanke LGA of Plateau State with even higher level of pathogenic bacteria isolates [47].
The study conducted by [42] on bacteriological analyses of public and private borehole water in Uruan revealed faecal contamination of water samples, a case that was not observed in this study from the specific bacteria isolates. Like the river sample in Plateau state mentioned earlier, higher rate of bacteria were isolated in boreholes in Umuahia North LGA, Abia State [40]. Thus the borehole water in Jabi district, Abuja is safer for drinking and domestic activities relative to the other states mentioned.
Table 3.3: Bacterial isolates from the different sampled drinking water sources in Jabi District of FCT, Abuja
Isolates Sampled drinking waters
River Sachet Borehole Well
Salmonella spp + - - -
E. coli + - - +
Pseudomonas spp + - + +
Aeromonas spp + - - +
Proteus spp + - + -
+ Present, - Absent
Table 3.4: Cell Morphology and Biochemical Characteristics of Isolates from drinking water sources in Jabi District of FCT, Abuja
Isol
ate c
o
d
e
Cell M
o
rphol
o
g
y
Gram
S
tain
Mo
tility
Catala
se
Oxid
ase
Citrate Urea
se
In
dole
Gluco
se
Su
crose
Lactose Dex
tro
ses
Organ
ism
WS1 Rod G- + + - + - - G A - A Salmonella spp
WS2 Rod G- + + - + + + G A - A Aeromonas spp
WS3 Rod G- + + + + - - - - A A Pseudomonas spp
WS4 Rod G- M + - - + + G A AG AG Escherichia coli
WS5 Rod G- + + - - + - G A A A Proteus spp
Key: + = Positive; - = Negative; A= Acid production; G= Gas production; G- = Gram negative; AG=Acidic and gas production; M = Moderate
B. Physicochemical parameters
The value of borehole temperature recorded was within the range reported by [40],[52] and [53]. Cool water are more potable for drinking purposes, because high water temperature enhances the growth of micro-organisms and hence, taste, odour, colour and corrosion problem may increase [54].
The pH is a measure of hydrogen ion concentration in water. Drinking water with pH range of 6.5 to 8.5 is generally considered satisfactory [24]. Acid water tends to be corrosive to plumbing and faucets, particularly, if the pH is below 6. Consequently, this could be the case for the river water sampled with pH below 6. In this study all the water samples analyzed were within WHO standard except that obtained from the river which might have a deleterious effect on consumers. The pH values obtained from other sources were within the range reported by [35, 38, 55] in well waters sampled in Kaduna metropolis.
In the case of turbidity, the values were less than the limit set by WHO thus they were assumed to be adequate. The turbidity levels of the water sources suggest that they lack high suspended materials, bacteria, planktons and dissolved
organic and inorganic materials [56]. The higher but not above recommended limit of turbidity recorded in river water is consistent with the report of Reza and Gordeep [56] that turbidity is associated with surface water sources.
All water samples indicate the availability of little contaminants as shown by the level of the determined values of total suspended solids (TSS). All measurements were within the permissible limit of WHO. Similarly, the total dissolved solid values of water samples were also within the WHO guide line values of 500 mg/l. Higher total dissolved solids are reported to reduce water clarity, which could contribute to reduced photosynthetic activities and possibly lead to an increase in water temperature [57], which is not the case in this study.
parameter. These waters sampled in Abuja are apparently better in terms on conductivity in comparison with the work by Sa’eed and Mahmoud [38] in Fagge Municipal in Kano State, Nigeria. However, the electrical conductivity from the river sample in this study is higher than that reported by Aremu and co-workers [29] who sampled streams and rivers in Okene, Kogi State.
The total alkalinity of water is its acid neutralizing capacity. The alkalinity of groundwater is mainly due to carbonates and bicarbonates [58]. The acceptable limit of alkalinity is 120mg/l and can be up to approximately 500mg/l [24, 58-59]. Based on the values of total alkalinity of the sampled waters, it can be inferred that the water is safe for drinking. In addition, the total alkalinity levels observed in this study were better than those reported by Sa’eed and Mahmoud [38] in Fagge Municipal of Kano State suggesting a better soil environmental condition.
The principal hardness-causing ions are calcium and magnesium and the acceptable limit of total hardness can be up to 500 mg/l [58]. According to Durfor and Becker [60] hardness can be classified into four; soft (0 - 60mg/l), moderate (60 -120mg/l), hard (121-180mg/l) and very hard (180mg/l and above). Similarly, the WHO International standard for drinking water classified water with a total hardness of CaCO3 less than 50mg/l as soft water, 50-150mg/l as moderately hard and water hardness above
150mg/l as hard water. Based on this classification, the total hardness of the sampled drinking waters could be grouped as moderate as the values indicate with sachet water being safer for drinking.
Generally, the physicochemical parameters observed in this well water is consistent with the report of Gambo and co-workers on well waters in Crescent Road, Poly Quarters in Kaduna [34]; while those from the sampled sachet water was within the range reported by [28] in Malaysia, an indication that the sachet water sampled in Abuja meets international best practice. Also, the physicochemical parameters of water sampled from the river in this study was more in the range of WHO recommended standards compared to that reported by [48] in river ganga, India.
Overall, the different sources of drinking water sampled in this study revealed more healthy water sources than those reported by [31] in Warri, Delta State; [30] in Aba, Abia State and [32] in Ota, Southwest, Nigeria. No bacterial isolates were isolated from the sampled sachet water in the study area compared to the different bacterial isolates, isolated from sachet water in local areas in Eastern Nigeria [61], Samaru-Zaria, Kaduna State [45] and even in neighbouring Kampala, Uganda [46], an indication that the sampled sachet water in this study is safer for drinking and adequate for domestic water purposes.
IV. CONCLUSIONS
This study revealed that in all the water samples analysed, sachet water samples have the least bacterial contaminants followed by the borehole water then the well water. The river water had the highest amount of bacteria contaminants. The importance of water in sustenance of life is the responsibility of individuals (citizens), governmental and non-governmental organizations such as the World Health Organization and National Agencies for Food, Drug Administration and Control (NAFDAC) in ensuring that potable and safe drinking water is consumed.
Recommendation
In order to obtain and maintain quality water supplies, the following are required:
More standard water treatment plants should be constructed around the FCT, Abuja.
Best network channels: the selection of best channels of water supply that is satisfactory with regards to its quality, quantity and hygienic conditions.
Health education: this is to explain the importance of clean water and the relationship which exists between water, health, sanitation and hygiene.
Wells should be properly located and constructed to avoid contamination of drinking water.
NAFDAC and other agencies should be monitoring the bacteriological analysis of well, river and dam waters in order to ensure satisfactoryquality.
REFERENCES
1. Eldon, E.; Bradley, S., Environmental Science : Study of Interrelationships. McGraw-Hill Publishing: 2004.
2. Tar, A.; Eneji, I.; Ande, S.; Oketunde, F.; Ande, S.; Shaaton, R., Assessment of arsenic in drinking water in Makurdi metropolis of Benue State, Nigeria. J. Chem. Soc. Nigeria 2009, 34, 56-62.
3. Ajewole, G., Water: An Overview. Nigerian Institute of Food Science and Technology, Nigeria 2005, 4-15.
4. Idowu, A.; Oluremi, B.; Odubawo, K., Bacteriological analysis of well water samples in Sagamu. Afr J Clin Expl Microbiol 2011, 12 (2). DOI: 10.4314/ajcem.v12i2.64324
5. LAWMA, Management of landfill wastes: The Journey So Far. L.E.P.A. 2000.
6. Nkuma, A. Physiochemical Analysis of Well Water from Wells Sited Close to Outside Sanitation System. 2000.
7. Essien, O. E.; Bassey, E. D. In Spatial variation of borehole water quality with depth in Uyo Municipality, Nigeria, 21st Century Watershed Technology: Improving Water Quality and Environment Conference Proceedings, May 27-June 1, 2012, Bari, Italy, American Society of Agricultural and Biological Engineers: 2012; p 1.
9. Alonge, O.; Wakkala, F.; Ogbaga, C.; Akindele, K., Bacterial Analysis of Barbecued Meat (Suya) From Selected Locations within Abuja, Nigeria. In 13th International Conference on Electronics, Computer and Computation (ICECCO), IEEE: Abuja, 2018.
10. Warburton, D. W., The microbiological safety of bottled waters.
Food science and technology (Marcel Dekker, Inc.) - 2000, 479-518. 11. Fisher, M. B.; Williams, A. R.; Jalloh, M. F.; Saquee, G.; Bain, R. E.; Bartram, J. K., Microbiological and chemical quality of packaged sachet water and household stored drinking water in Freetown, Sierra Leone. PLOS ONE 2015, 10 (7), e0131772.
DOI:10.1371/journal.pone.0131772
12. de França Doria, M.; Pidgeon, N.; Hunter, P. R., Perceptions of drinking water quality and risk and its effect on behaviour: A cross-national study. Sci. Total Environ 2009, 407 (21), 5455-5464.
DOI:10.1016/j.scitotenv.2009.06.031
13. Sallam, O. M. In Political border effects on sustainable management of the arab shared aquifers resources, Proceedings of the 3rd International Conference on Water Resources and Arid Environments and the 1st Arab water Forum, Environment Agency: 2008. DOI: 10.13140/RG.2.1.4860.1125
14. Umeh, C.; Okorie, O.; Emesiani, G. In Towards the provision of safe drinking water: The bacteriological quality and safety of sachet water in Awka, Anambra State, Proceedings of the 29th Annual Conference and Genral Meeting on Microbes as Agents of Sustainable Development, Nigerian Society for Microbiology (NSM), Federal University of Agriculture, Abeokuta: 2005; p 22.
15. Blake, P. A.; Rosenberg, M. L.; Florencia, J.; Costa, J. B.; do Prado Quintino, L.; Gangarosa, E. J., Cholera in Portugal, 1974. II. Transmission by bottled mineral water. Am J Epidemiol 1977, 105 (4),
344-8.
16. Mavridou, A., Study of the bacterial flora of a non‐carbonated natural mineral water. J. Appl. Microbiol. 1992, 73 (4), 355-361.
17. Bordalo, A. A.; Machado, A., Water bags as a potential vehicle for transmitting disease in a West African capital, Bissau. Int health 2014,
7 (1), 42-48. DOI: 10.1093/inthealth/ihu056
18. Gangil, R.; Tripathi, R.; Patyal, A.; Dutta, P.; Mathur, K., Bacteriological evaluation of packaged bottled water sold at Jaipur city and its public health significance. Vet World 2013, 6 (1), 27-30.
19. Semerjian, L. A., Quality assessment of various bottled waters marketed in Lebanon. Environ Monit Assess 2011, 172 (1), 275-285.
DOI:10.1007/s10661-010-1333-7
20. Ademola, F., Baseline heavy metals concentration in river sediments with Okikipopo South East belt of the Nigerian bituminious sand field. J Chem Soc Nig 2008, 33, 29.
21. Mishra, P. C. Some aspects of the quality of water in and around Rourkela. 2005.
22. APHA, Standard methods for examination of water and waste water. American Public Health Association: Washington, DC, 1998. 23. Dissmeyer, G. E., Drinking water from Forests and Grasslands.
USDA Forest Service General Technical Report SRS-39, Asheville, North Carolina 2000.
24. WHO, Guidelines for drinking-water quality. 4th ed.; WHO Press: Geneva, Switzerland, 2011.
25. Trivedy, R.; Goel, P., Chemical and biological methods for water pollution studies. Environmental publications: 1984.
26. Suthar, S.; Chhimpa, V.; Singh, S., Bacterial contamination in drinking water: a case study in rural areas of northern Rajasthan, India.
Environ Monit Assess 2009, 159 (1), 43-50. DOI:10.1007/s10661-008-0611-0
27. Adegboyega, A.; Olalude, C.; Odunola, O., Physicochemical and Bacteriological Analysis of Water Samples Used For Domestic Purposes in Idi Ayunre, Oyo State, Southwestern Nigeria. IOSR J App Chem 2015, 8 (10).
28. Rahmanian, N.; Ali, S. H. B.; Homayoonfard, M.; Ali, N.; Rehan, M.; Sadef, Y.; Nizami, A., Analysis of physiochemical parameters to evaluate the drinking water quality in the State of Perak, Malaysia. J Chem 2015. DOI: 10.1155/2015/716125
29. Aremu, M.; Majabi, G.; Oko, J.; Opaluwa, O.; Gav, B.; Osinfade, B., Physicochemical Analyses of Different Sources of Drinking Water in Okene Local Government Area of Kogi State, Nigeria.DOI: 10.1.1.878.6806
30. Agwu, A.; Avoaja, A., The assessment of drinking water sources in Aba Metropolis, Abia State, Nigeria. Resources and Environment 2013, 3 (4), 72-76. DOI: 10.5923/j.re.20130304.023 31. Nduka, J. K.; Orisakwe, O. E.; Ezenweke, L. O., Some physicochemical parameters of potable water supply in Warri, Niger Delta area of Nigeria. Sci Res Essays 2008, 3 (11), 547-551. DOI: 10.12691/env-5-2-2
32. Ogunlana, O. O.; Ajayi, A.; Ogunlana, O. E.; Keleko, A.; Olasehinde, G., Microbiological and Physicochemical Properties of Drinking Water at Ota, Southwest, Nigeria. International Journal of Tropical Agriculture and Food Systems 2010, 4 (4), 358-361.
33. Aboh, E. A.; Giwa, F. J.; Giwa, A., Microbiological assessment of well waters in Samaru, Zaria, Kaduna, State, Nigeria. Ann Afr Med
2015, 14 (1), 32. DOI: 10.4103/1596-3519.148732.
34. Gambo, J.; James, Y.; Yakubu, M., Physico–Chemical and Bacteriological Analysis of Well Water at Crescent Road Poly Quarters, Kaduna. Int J Eng Sci 2015, 4 (11), 11-17.
35. Allamin, I.; Borkoma, M.; Joshua, R.; Machina, I., Physicochemical and Bacteriological Analysis of Well Water in Kaduna Metropolis, Kaduna State. OA Lib 2015, 2 (06), 1. DOI:
10.4236/oalib.1101597
36. Ezeribe, A.; Oshieke, K.; Jauro, A., Physico-chemical properties of well water samples from some villages in Nigeria with cases of stained and mottle teeth. Sci World J 2012, 7 (1), 1-3.
37. Mile, I.; Jande, J.; Dagba, B., Bacteriological contamination of well water in Makurdi town, Benue State, Nigeria. Pak J Biol Sci 2012, 15
(21), 1048-1051.DOI: 10.3923/pjbs.201210481051
38. Sa'eed, M.; Mahmoud, A., Determination of Some Physicochemical Parameters and Some Heavy Metals in Boreholes from Fagge L.G.A of Kano Metropholis Kano State- Nigeria. World J Anal Chem 2014, 2 (2), 42-46.
39. Ehiowemwenguan, G.; Iloma, A.; Adetuwo, J., Physico-Chemical and Bacteriological Quality of Borehole Water in Eyaen Community Area of Edo State, Nigeria. IJBAS 2014, 3 (2), 60-68. 40. Onwughara, N. I.; Ajiwe, V. E.; Nnabuenyi, H. O.; Chima, C. H., Bacteriological Assessment of Selected Borehole Water Samples in Umuahia North Local Government Area, Abia State, Nigeria. J Environ Treat Techn 2013, 1 (2), 117-121.
41. Isa, M. A.; Allamin, I. A.; Ismail, H. Y.; Shettima, A., Physicochemical and bacteriological analyses of drinking water from wash boreholes in Maiduguri Metropolis, Borno State, Nigeria. Afr J Food Sci
2013, 7 (1), 9-13. DOI: 10.5897/AJFS12.073
42. Ukpong, E.; Okon, B., Comparative analysis of public and private borehole water supply sources in Uruan Local Government Area of Akwa Ibom State.IJAST 2013, 3 (1).
43. Ibe, S.; Okplenye, J., Bacteriological analysis of borehole water in Uli, Nigeria. Afr J. Appl Zool. Environ. Biol 2005, 7 (1), 116-119. DOI: 10.4314/ajazeb.v7i1.41158
44. Okorondu, S.; Anyadoh-Nwadike, S., Bacteriological and Physiochemical Analysis of Oguta Lake Water, Imo State, Nigeria. 2015, 3
(5-1).
45. Ugochukwu, S.; Giwa, F.; Giwa, A., Bacteriological evaluation of sampled sachet water sold in Samaru-Zaria, Kaduna-State, Nigeria.
NigerJBasicClin Sci 2015, 12 (1), 6.
46. Halage, A. A.; Ssemugabo, C.; Ssemwanga, D. K.; Musoke, D.; Mugambe, R. K.; Guwatudde, D.; Ssempebwa, J. C., Bacteriological and physical quality of locally packaged drinking water in Kampala, Uganda. J Environ Public health 2015, 2015. DOI: 10.1155/2015/942928
47. Lawal, R.; Lohdip, Y., Physicochemical and Microbial Analysis of Water from Mimyak River in Kanke LGA of Plateau State, Nigeria. Afr J Nat Sci 2015, 14.
48. Joshi, D. M.; Kumar, A.; Agrawal, N., Studies on physicochemical parameters to assess the water quality of river Ganga for drinking purpose in Haridwar district. Rasayan J Chem. 2009, 2 (1), 195-203.
49. Ademorati, C., Standard methods for water and effluents analysis. Foludex Press Ltd: Ibadan, 1996; Vol. 3, p 29-118.
50. FAO/WHO, Evaluation of certain food additives and contaminants : forty-sixth report of the Joint FAO/WHO Expert Committee on Food Additives. World Health Organization: Geneva, 1997.
52. Obi, C.; Okocha, C., Microbiological and physicochemical analysis of selected borehole waters. JEAS 2007, 25 (7), 920-929. DOI: 10.9734/BMRJ/2016/20136
53. Chukwu, G., Water Quality Assessment of Boreholes in Umuahia South Local Government Area of Abia State, Nigeria. PJST 2008,
9 (2), 592-508.
54. Okoye, C.; Okoye, A., Urban domestic solid waste management. Nimo: Rex Charles and Patrick Limited Awka 2008, 5-7. 55. Reda, A. H., Physico-Chemical analysis of drinking water quality of Arbaminch Town. J Environ Anal Toxicol.2016, 6 (2), 1-5. DOI:10.4172/2161-0525.1000356
56. Reza, R.; Jain, M.; Singh, G., Pre and Post Monsoon variation of heavy metals concentration in Ground water of Angul-Talcher region of Orissa, India. Nat Sci 2009, 7 (6), 52-56.
57. Harrison, R. M., Understanding our environment: an introduction to environmental chemistry and pollution. Royal Society of chemistry: 2007.
58. Raju, N. J.; Ram, P.; Dey, S., Groundwater quality in the lower Varuna river basin, Varanasi district, Uttar Pradesh. J Geol Soc India 2009,
73 (2), 178. DOI:10.1007/s12594-009-0074-0
59. WHO Fact sheet No 256: Bottled Drinking-Water. http://collections.infocollections.org/ukedu/en/d/Js0534e/.
60. Durfor, C. N.; Becker, E., Public water supplies of the 100 largest cities in the United States, 1962. US Government Printing Office: 1964.