Irrigation scheduling of peanuts using plant based
sensing.
Agri-Science Queensland Innovation Opportunity
This publication has been compiled by <insert name/s> of <insert business group>, <insert department>.
© State of Queensland, 2015
The Queensland Government supports and encourages the dissemination and exchange of its information. The copyright in this publication is licensed under a Creative Commons Attribution 3.0 Australia (CC BY) licence.
Under this licence you are free, without having to seek our permission, to use this publication in accordance with the licence terms.
You must keep intact the copyright notice and attribute the State of Queensland as the source of the publication.
Note: Some content in this publication may have different licence terms as indicated.
For more information on this licence, visit http://creativecommons.org/licenses/by/3.0/au/deed.en
Summary
Table of contents
Background ... 1
Project Objectives... 2
Methodology... 2
Results ... 3
Conclusions/Significance/Recommendations ... 4
Key Messages ... 5
Where to next ... 6
Budget Summary ... 6
Table of figures
Figure 1 – Thermal Imaging Temps in Degrees celcius ... 12Table of images
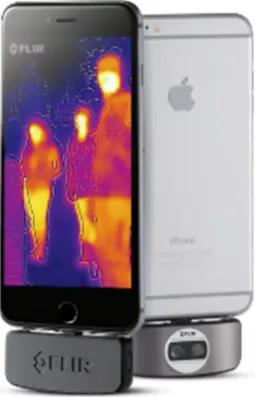
Image 1 – Electromagnetic Spectrum of the FLIR One Camera ... 8Image 2 – FLIR One Camera attached to an iphone 6...………8
Image 3 – Stephen Capturing IR Images using FLIR One technology on an iphone 6………9
Image 4 – IR Image of the irrigated crop canopy (85°)..………9
Image 5 – IR Image of the irrigated crop canopy (60°)………...9
Image 6 – IR Image of the irrigated crop canopy (45°)……….10
Image 7 – IR Image of a water stressed crop canopy (85°)……….10
Image 8 – IR Image of a water stressed crop canopy (60°)……….10
Image 9 – IR Image of a water stressed crop canopy (45°)……….11
Image 10 – IR Image of a red soil headland………..11
Image 11 – Photo of a dry treatment………..11
Table of tables
Table 1 – FLIR One Average Canopy temperatures (Degrees Celcius) irrigation and Rainfall ... 6Table 2 – Tensiometer readings of Soil Moisture (cb)………7
Table 3 – Peanut yields and Quality………..7
Background
The aim of the project is to assess the viability that you can schedule irrigations of a peanut crop using a hand held Infra-Red (IR) thermometer. IR thermometers measure the radiant energy (temperature) of an object within the thermal infra-red electromagnetic wavebands. The project will assess this method using a Forward Looking Infra-Red (FLIR) heat sensing camera plus the supporting Applications (Apps) in conjunction an iphone S6. This FLIR One camera attachment is available now for around $360 FLIR. The crop canopy temperature provides a relative measurement of transpiration rate and an indication of crop stress. Thermal imaging has the potential to provide a more robust measure of crop water status. Data is downloaded from the camera and used in conjunction with anticipated weather conditions and the plants physiological development, to predict optimum scheduling of irrigation. The outcomes of the project will demonstrate a business case for future industry funding in irrigation methodologies in peanuts. Irrigators are now able to access affordable new thermal sensing technology. This technology will help improve the sustainability of the peanut industry in a changing and variable climate. This IR technology to schedule irrigation could be used in a range of irrigated crops in Queensland.
Compared to well-watered plants, water stressed plants exhibit elevated canopy temperatures. Plant leaves open their stomata to admit carbon dioxide for photosynthesis and at the same time, due to vapour pressure deficits, water vapour flows out of the leaf which cools the leaf surface. When soil water becomes limiting, transpiration decreases, thus reducing the cooling effect and causing the crop canopy temperature to rise. This occurs as a result of both reduced water availability and stomatal closure which is the plants water conservation mechanism. This is why when you touch the leaves of a well-watered crop in sunlight on a hot sunny day they are cool, whereas a piece of green cardboard would feel hot. Saunders et al found that water stressed peanut canopy temperatures exceeded 35°C. He found that the stressed canopy temperature were similar to or greater than air temperature. Canopy temperatures in well-watered plants are usually 2 - 7°C below air temperature.
All objects emit energy, or radiation, that is measured as their temperature. Measurements of crop canopy temperature can be taken using handheld or vehicle mounted devices, wireless fixed sensors, or thermal imaging cameras. For crop canopies the temperature can be measured using a thermal infrared thermometer (IRT). The advent of increasingly affordable and reliable IRTs has stimulated research into plant based stress detection, through the monitoring of crop canopy temperatures.
Normally, our vision is limited to a very small portion of the electromagetic spectrum. The thermal energy has a much longer wavelength than visible light. So long that the human eye can’t see it, just like we can’t see radio waves (figure 1).
With thermal imaging, the portion of the spectrum we perceive is dramatically expanded, helping us “see” heat. Visible light doesn’t affect the thermal world, so you can see equally well in highly lit and totally dark environments.
The FLIR One thermal camera allows us to see things the naked eye could never perceive on its own.
Irrigation Scheduling of Peanuts using Plant based Sensing. Department of Agriculture and Fisheries, 2016 2
Project Objectives
Pre-visual detection of water stress using handheld infra-red cameras to determine vegetation indices has been proposed to be a more accurate way to time irrigations.
Develop an assessment of the viability of FLIR One technology to be used to schedule irrigation of peanuts based on crop canopy temperature.
That IR thermometer technology can improve water use efficiency of a peanut crop.
To determine if you can use FLIR One thermometer technology Applications (Apps) to detect water stress in a peanut crop before you can see the stress.
That FLIR One technology can improve irrigation scheduling.
Methodology
On December 15th2015, at the Bundaberg Research Facility, Covington planter boxes on a single
disc planter were used to plant two rows 90cm apart of Kairi peanuts planted on a 1.83 meter bed at approximately 130kgs/ha. (16-20 seeds/meter of row) for 2 rows per bed. The planting population was based on a 75% germination rate. The Kairi peanut variety has approximately 1700 seeds/kg. The peanuts were planted into beds 100m long. Kairi has good disease (rust and leaf spot) tolerance.
The soil type is a red ferrosol based on a Quarternary Olivine Basalt. They have a Plant Available Water Capacity (PAWC) of greater than 100mm.
The trial had two treatments:
Treatment 1: Irrigation using FLIR One Apps. $249US ($360Aust) + iphone S6 ($1250)) as an irrigation scheduling tool. The FLIR one IR camera and App. IR readings were to be taken between 12:00pm and 2:00pm daily. (Solar noon occurs between 12:00 and 2:00pm)). Strategic irrigations would be applied when the canopy temperature exceeds 32° C). Tensiometers were installed to compliment the data received from the FLIR one camera.
Treatment 2: Dry (rainfall only + tensiometer readings). Irrigate when canopy temperatures exceeds 35° C.
Tensiometers were installed to compliment the data that would be generated from the canopy thermal temperature data obtained by the FLIR One imaging camera.
Tensiometers monitor changes in soil water without disturbing the roots of the growing plants. They need no calibration and they measure the actual availability of water in the soil. Tensiometers respond to irrigation and rainfall.
All tensiometers read in centibars (cb). As plants use water and as the soil dries out, water is drawn out of the tensiometer through the ceramic tip. Because the tube is sealed, a vacuum is created which is measured on the gauge.
The tensiometers were installed using an auger approximately 30cm into the soil, some water was poured down the hole to lubricate the sides and help the tip to make good contact with the soil.
Plants begin to stress in this soil type when the tensiometer reading reaches 50cb. When using
tensiometers as an irrigation scheduling tool, irrigations in this soil type should occur when ≥50cb.
After the peanut seed was planted, irrigation was applied to the freshly planted peanuts by a spray line with sprinkler applicators for two hours. A further spray line irrigation was made 4 days later to ensure a good germination.
The peanut trial treatments were then irrigated using surface laid trickle tape, running down the centre of the bed between the 2 rows of peanuts. The trickle has a capacity to irrigate at 2.7mm/hr.
The FLIR camera has a spot temperature sensor that indicates the temperature of the plant/object on which you are focusing the camera. Thermal images of the canopy were taken at 4 locations along the row at 3 different angles (85, 60, and 45 degrees) and then aggregated to get an average temperature of the canopy along that row. The images were down loaded and the temperature data transferred manually to a spread sheet. Saunders et al in their research used a Telatemp model AG-42 infrared thermometer at 1:00pm (Solar noon). The view instrument viewed the canopy at a glancing angle of 16 degree below horizontal or approximately 2.7 meters from the target that only allowed plant material to be viewed. The camera angle is important for measuring leaf reflectance and canopy temperatures.
Results
Temperature is of extreme importance in all areas of plant growth. Canopy temperatures, determined by infrared thermometry, were related to water stress. The canopy temperatures of the peanut crop were recorded/ captured in weeks 12 through to week 20. Crop growth was monitored and managed in accordance with the canopy thermal temperatures. FLIR One camera thermal images were taken at solar Noon between 12:00 and 2:00pm Thermal images of the canopy were taken at 4 locations along the row at 3 different angles (85, 60, and 45 degrees) and then aggregated to get an average at the spot and along the row (Figures 4 - 9). Afternoon (1:00pm) canopy temperature in the irrigated treatment averaged 28.6 - 32°C and mean canopy temperatures in the dry treatments were between 30 and 36°C (see table 1). Saunders et al found that water stressed peanut canopy temperatures exceeded 35°C. He found that the stressed canopy temperatures were similar to or greater than air temperature. Canopy temperatures in well-watered plants are usually 2-7°C below air temperature. The average peanut canopy temperatures for the well irrigated treatment were less than the average temperatures for the non-irrigated crop.
The mean temperature difference between ambient air temperature and canopy temperature
indicates that treatment 1 experienced some periods of water stress. Treatment 2 experienced longer periods of water stress. The canopy temperature in treatment 2 spent more time at a temperature greater than 35°C.
There was a large amount of temperature data (‘mega data’) collected during the duration of the project. The temperature images captured by the FLIR One camera were down loaded as images with spot temp recorded on the image after each data collection.
The temperature spot on each image was manually recorded onto a spreadsheet. This manual recording was then transferred onto a computer based excel based spreadsheet. From here the data could be averaged out over the row to give a canopy temperature for the treatment.
Irrigation Scheduling of Peanuts using Plant based Sensing. Department of Agriculture and Fisheries, 2016 4 analysis this mega data needs complimentary software to better record and analyse the temperature data.
Data from the installed tensiometers was recorded and complemented the findings of the thermal imaging temperatures of the crop canopy. There was a difference in soil water measured by the tensiometers between the irrigated and dry treatments (see table 2).
The peanuts were harvested on the 10thJune and Tables 3 and 4 show the peanut kernel yields and
quality of the kernels for 8 meters of row. There was no significant difference between yields and qualities between the two treatments. A mystery disease symptom of peanuts called ‘peanut kernel shrivel’ affected peanut kernel quality.
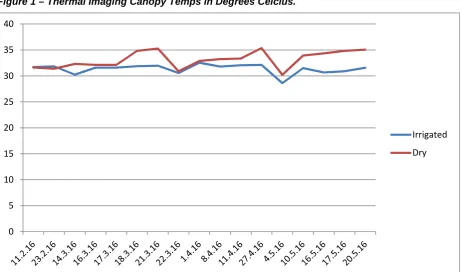
Figure 1 shows the average canopy thermal imaging temperature of the two treatments throughout the trial (week 12- week 20).
Rainfall occurred regularly throughout the early growth and establishment phase of the peanut crop. As the crop matured irrigation was applied more regularly according to canopy temperatures. A decision was made to irrigate the FLIR treatment when average canopy temperatures exceeded 32°C. Treatment one was irrigated 3 times. The other treatment was to be irrigated when the canopy temperature exceeded 35°C. The canopy temperature of the dry treatment did exceed 35°C during the season and was irrigated twice. Regular rainfall events provided the crop with adequate water to grow the crop.
The mean temperature difference between ambient air temperature and canopy temperature table 2 indicates that the FLIR treatment experienced periods of water stress. This indicates that the irrigated treatment did not receive enough water to constitute a well irrigated scenario. Treatment 2
experienced longer periods of water stress indicating a canopy temp greater than or equal to ambient air temp or a canopy temperature greater than 35°C.
There were no visual canopy wilting displayed by the water stressed peanut crop (see image 11). The soil at the Bundaberg Research Facility has high plant available water content and with regular rainfall events provided adequate water so as not to induce visual canopy water stress symptoms, such as plant wilting.
Canopy FLIR One thermal images of peanut crops were also collected at other locations in the Bundaberg region. Images were collected from a DAF trial site on a property called “Emdex”. This property has a ‘poor’ soil with a water holding capacity of 50mm. Canopy temperatures recorded at this site on the 4thof March on a visually stressed area were 37-39°C whereas the canopy temps in
the well irrigated area were 29 - 31°C.
Canopy temperatures at ‘Emdex’ were recorded again on the 12thMay and ranged from 35-37°C in
the stressed area to 29 - 31°C in the well irrigated area. This was a peanut stress trial conducted by the DAF/GRDC funded Coastal Farming Systems Growers Solution project.
These peanut crops at “Emdex” displayed visual symptoms of crop water stress. The leaves displayed symptoms of wilting.
Conclusions/Significance/Recommendations
Canopy temperature can vary during the day in response to both increased solar radiation and ambient temperature. Data interpretation can be difficult as both water stress and ambient conditions (air temperature, radiation, humidity, wind speed etc) influence changes in canopy temperature.
Canopy temperature variations due to water stress can be small (1-3°C) and difficult to separate from variations caused by diurnal and daily changes in radiation. An alternative way to use crop canopy temperatures for irrigation scheduling is, on any one day, to measure the canopy temperature of a well-watered crop and use that as a base temperature to compare with canopies other crops on the same day.
Crops with warmer canopy temperatures are likely to be more stressed. Thus, water stress can be assessed by examining differences in canopy temperature between the field in question and a well-watered area of the same crop in the near vicinity. This assumes environmental effects are common to all areas at the measurement time.
Although there were no visual symptoms of water stress in the peanut crop, such as leaf curling due to water stress wilting (see image 1) the FLIR One imaging detected differences in canopy temp. Canopy temperatures were recorded for the two treatments, well-watered and dry. Solar Noon (12:00 – 2:00pm) canopy temperature in the irrigated treatment averaged 28.6 - 32° C and mean canopy temperature in the water dry treatments were between 30 and 36° C or greater.
The average peanut canopy temperatures for the well irrigated treatment were less than the average temperatures for the dry crop. The mean temperature difference between ambient air temperature and canopy temperature indicates that treatment 1 experienced some periods of water stress.
Treatment 2 experienced longer periods of water stress. The canopy temperature in treatment 2 spent more time at a temperature greater than 35°C.
When using thermal imaging you should manage the peanut crop to maintain the canopy temperature in irrigated peanut plants to 2-7°C below air temperature or below 35°C.
As another tool to help peanut growers with better irrigation scheduling growers should use the FLIR One camera to monitor crop canopy temperatures of their peanut crops at ‘solar noon’. If they find that the canopy temperatures are greater than or equal to the ambient air temperature and if the canopy temperature is greater than 32°C then they should consider irrigating that field.
Another recommendation for those growers interested in precision irrigation management techniques, is to use a cropped irrigated field as its own reference point and to examine the canopy temperature variability within the field. This management of the FLIR One technology could assist with precision irrigation across the field and would reduce variability within the field.
Key Messages
For crop canopies the temperature can be measured using a thermal infrared thermometer (IRT). The advent of increasingly affordable and reliable IRTs has stimulated research into plant based stress detection, through the monitoring of crop canopy temperatures.
FLIR One camera is an affordable and portable IRT that can be used by growers to help then to schedule irrigation of their peanut crops.
The results of this study indicate that the FLIR One camera can measure peanut canopy
Irrigation Scheduling of Peanuts using Plant based Sensing. Department of Agriculture and Fisheries, 2016 6 canopy showed visual signs of water stress wilting. The FLIR One camera can assist growers to schedule irrigations for their peanut crops.
When using thermal imaging you should manage the peanut crop to keep canopy temperature in irrigated peanut plants to 2-7°C below air temperature or below 35°C.
The FLIR One camera canopy imaging position angle should be at 74° or looking at a position 2.7m in front to record the most accurate crop canopy temperatures.
Where to next
Since the project began there have been additional applications developed by FLIR that enhance the information gathered from the FLIR One camera. New apps such as ‘Thermal’ and ‘FLIR Tools’ have been developed to enhance the capability of the FLIR One camera. The ‘thermal’ app has the capacity for multiple spots on the thermal image looking at the leaf canopy. This has the capacity to negate leaf reflectance and get a more precise temperature of the crop canopy. New software has been developed to assist in the analysis of the data collected. The new software can take the spot data and average across the crop canopy on that image. These new Apps and software has increased the value of the FLIR One camera as a tool for farmers to use to manage crop canopy temperatures.
At a higher innovation level, a trial involving a network of wireless canopy temperature sensors set up across a field logging crop canopy temperature data continuously. These sensors would be
connected wirelessly to a computer thereby building an ‘intelligence’ of crop canopy temperatures across the field. This ‘intelligence’ is then linked to an automated irrigation system activated when the canopy temperature exceeds ambient air temperature by a known threshold.
Budget Summary
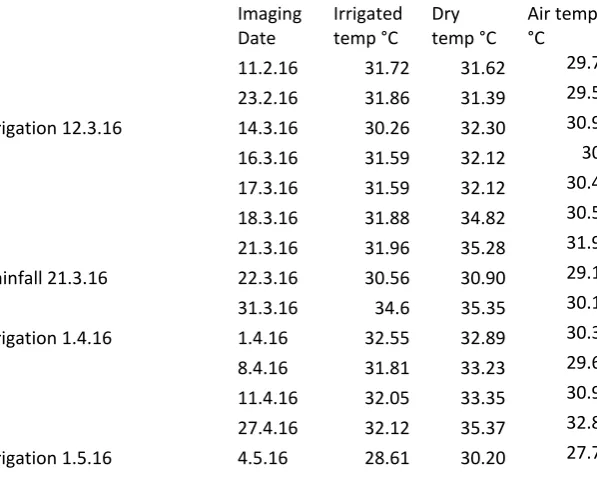
Table 1 – FLIR One Average Canopy Temperatures (Degrees Celcius) and Irrigation and rainfall events
Imaging
Date Irrigatedtemp °C Drytemp °C Air temp°C
11.2.16 31.72 31.62 29.7
23.2.16 31.86 31.39 29.5
Irrigation 12.3.16 14.3.16 30.26 32.30 30.9
16.3.16 31.59 32.12 30
17.3.16 31.59 32.12 30.4
18.3.16 31.88 34.82 30.5
21.3.16 31.96 35.28 31.9
Rainfall 21.3.16 22.3.16 30.56 30.90 29.1
31.3.16 34.6 35.35 30.1
Irrigation 1.4.16 1.4.16 32.55 32.89 30.3
8.4.16 31.81 33.23 29.6
11.4.16 32.05 33.35 30.9
27.4.16 32.12 35.37 32.8
10.5.16 31.51 33.92 30.7
Irrigation 13.5.16 16.5.16 30.67 34.34 26.9
17.5.16 30.91 34.83 27.1
20.5.16 31.58 35.07 29.5
Table 2 – Tensiometer readings of soil moisture centibars (cb)
Irri Dry Dry Irrig Dry Irr
27/4 tensiometer readings (cb): 40 40 42 40 40 35
10/5 tensiometer readings (cb): 42 45 45 42 43 42
16/5 tensiometer readings (cb): 20 48 48 20 48 23
20/5 tensiometer readings (cb): 35 48 50 30 50 32
25/5 tensiometer readings (cb): 38 48 50 33 50 34
3/6 tensiometer readings (cb): 37 50 51 35 52 36
6/6 tensiometer readings (cb) : 8 10 10 10 10 10
9/6 tensiometer readings (cb): 12 14 14 18 14 12
17/6 tensiometer readings (cb): 16 18 18 20 18 15
22/6 tensiometer readings (cb): 10 10 10 10 10 10
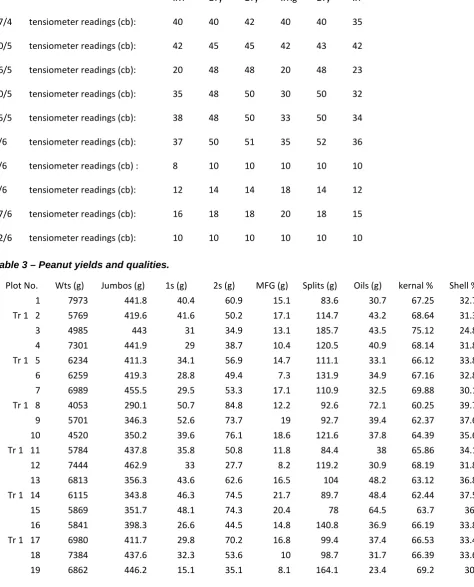
Table 3 – Peanut yields and qualities.
Plot No. Wts (g) Jumbos (g) 1s (g) 2s (g) MFG (g) Splits (g) Oils (g) kernal % Shell %
1 7973 441.8 40.4 60.9 15.1 83.6 30.7 67.25 32.75
Tr 1 2 5769 419.6 41.6 50.2 17.1 114.7 43.2 68.64 31.36
3 4985 443 31 34.9 13.1 185.7 43.5 75.12 24.88
4 7301 441.9 29 38.7 10.4 120.5 40.9 68.14 31.86
Tr 1 5 6234 411.3 34.1 56.9 14.7 111.1 33.1 66.12 33.88
6 6259 419.3 28.8 49.4 7.3 131.9 34.9 67.16 32.84
7 6989 455.5 29.5 53.3 17.1 110.9 32.5 69.88 30.12
Tr 1 8 4053 290.1 50.7 84.8 12.2 92.6 72.1 60.25 39.75
9 5701 346.3 52.6 73.7 19 92.7 39.4 62.37 37.63
10 4520 350.2 39.6 76.1 18.6 121.6 37.8 64.39 35.61
Tr 1 11 5784 437.8 35.8 50.8 11.8 84.4 38 65.86 34.14
12 7444 462.9 33 27.7 8.2 119.2 30.9 68.19 31.81
13 6813 356.3 43.6 62.6 16.5 104 48.2 63.12 36.88
Tr 1 14 6115 343.8 46.3 74.5 21.7 89.7 48.4 62.44 37.56
15 5869 351.7 48.1 74.3 20.4 78 64.5 63.7 36.3
16 5841 398.3 26.6 44.5 14.8 140.8 36.9 66.19 33.81
Tr 1 17 6980 411.7 29.8 70.2 16.8 99.4 37.4 66.53 33.47
18 7384 437.6 32.3 53.6 10 98.7 31.7 66.39 33.61
Irrigation Scheduling of Peanuts using Plant based Sensing. Department of Agriculture and Fisheries, 2016 8
Tr 1 20 5809 417.8 24.4 34.7 9.1 147.1 44.2 67.73 32.27
21 7696 405.2 43 52.1 15.8 121.1 35 67.22 32.78
Table 4 – Peanut yields and qualities per treatment
Treatment Wts (g) Jumbos (g) 1s (g) 2s (g) MFG (g) Splits (g) Oils (g) kernal % Shell %
Irrigated
Tr 1 5820.5 390.3 37.52 60.3 14.77 105.57 45.2 65.36 34.63
Non irrigated
Tr 2 6545.5 411.15 35.18 52.63 13.88 119.48 37.87 67.02 32.97
Image 1 – Electromagnetic Spectrum of the FLIR One camera.
Image 3 –Stephen capturing IR images using FLIR One camera
Image 4 – IR of a well irrigated crop Image 5 – IR of a well irrigated crop
Irrigation Scheduling of Peanuts using Plant based Sensing. Department of Agriculture and Fisheries, 2016 10
Image 6 – IR of a well irrigated crop
Camera angle 45°.
Image 7 – Canopy IR of a water stressed crop Image 8 – Canopy IR of a water stressed crop
Image 9 – Canopy IR of a water stressed crop
Camera angle 45°
Image 10 – IR of a red soil headland Image 11 – Photo of a dry treatment (water stressed)
Irrigation Scheduling of Peanuts using Plant based Sensing. Department of Agriculture and Fisheries, 2016 12
Figure 1 – Thermal Imaging Canopy Temps in Degrees Celcius.
0 5 10 15 20 25 30 35 40