The Optimal Radiation Dose to Induce Robust
Systemic Anti-Tumor Immunity
Jan Poleszczuk1,* and Heiko Enderling2,3
1 Nalecz Institute of Biocybernetics and Biomedical Engineering, Polish Academy of Sciences, Ks. Trojdena 4,
02-109 Warsaw, Poland; [email protected]
2 Department of Integrated Mathematical Oncology,3Department of Radiation Oncology, H. Lee Moffitt
Cancer Center and Research Institute, 12902 Magnolia Drive, Tampa, FL 33612, USA; [email protected]
1
2
3
4
5
6
7
8
9
10
11
12
13
14
15
* Correspondence:[email protected];Tel.:+48225925900(ext307)
Abstract: Synergyofradiationandimmunesystemiscurrentlyreceivingsignificantattentionin oncology asnumerousstudieshave shownthat cancerirradiation caninducestrong antitumor immuneresponses.Itremainsunclear,however,whatarethebestradiationfractionationprotocols tomaximizethetherapeuticbenefitsofthissynergy.Here,wepresentanovelmathematicalmodel thatcanbeusedtopredictanddissectthecomplexityoftheimmune-mediatedresponseatmultiple tumorsitesafterapplyingfocalirradiationandsystemicimmunotherapy.Wesuccessfullycalibrate theproposedframeworkwithpublishedexperimentaldata,inwhichtwotumorsweregrownin miceattwospatiallyseparatedsitesfromwhichonlyonewasirradiatedusingvariousradiation fractionationprotocolswithandwithoutconcurrentsystemicimmunotherapy.Theproposedmodel iscalibratedtofitthetemporaldynamicsoftumorvolumeatbothsitesandcanpredictchangesin immuneinfiltrationinthenon-irradiatedtumors.Themodelwasthenusedtoinvestigateadditional radiationfractionationprotocols. Modelsimulationssuggestthattheoptimalradiationdosesper fractiontomaximizeantitumorimmunityarebetween10-13Gy,atleastfortheexperimentalsetting usedformodelcalibration.Thisworkprovidestheframeworkforevaluatingradiationfractionation protocolsforradiation-inducedimmune-mediatedsystemicantitumorresponses.
Keywords:abscopaleffect;radiotherapy;immunotherapy;mathematicalmodel 16
1. Introduction 17
Radiation is a potent cancer treatment to locally sterilize abnormal or potentially abnormal 18
tissues. About 50% of all cancer patients receive radiotherapy as part of their treatment, either as 19
monotherapy or in combination with surgery, chemotherapy or, more recently, immunotherapy [1,2]. 20
Despite decades of clinical success that have seen tremendous physical advances, some questions 21
in radiobiology remain elusive including how to reliably trigger radiation-induced bystander [3–5] 22
and abscopal [6,7] effects to further increase therapeutic efficacy. The abscopal effect, the systemic 23
regression of metastatic nodules outside the radiation field after localized irradiation to one or more 24
tumor sites, has attracted significant attention in the last several years, due in part to spectacular 25
breakthroughs in immunotherapies [8–10]. Experimental studies conclusively demonstrated that 26
abscopal effects are immune mediated [6,11]. The historic rarity of clinical observations of systemic 27
responses to local radiation is conceivably due to lack of additional boosts to the immune system [12], 28
as well as rare radiological follow up of untreated metastases. In a retrospective analysis of pre-and 29
post-therapy radiology images of 47 metastatic melanoma cases treated with both ipilimumab and 30
65 courses of radiation, a shrinking of tumor lesions outside the radiation field was observed in 16 31
patients, the majority of which had exhibited continued growth after immunotherapy alone [13]. 32
In a recent prospective clinical trial combining focal radiation therapy with immune stimulation in 33
metastatic patients, 11 of 41 patients (26.8%) had an objective abscopal response [9]. The increasing 34
body of literature and evidence that radiation can have robust systemic effects might also change the 35
paradigm of radiation and surgery sequencing for some early stage localized diseases [14]. Consensus 36
arises that the radiation-induced abscopal effect is triggered by stimulation of the adaptive part of 37
the immune system [6,11,15,16], and T cell-mediated responses in particular. Radiation induces cells 38
stress and an immunogenic type of cell death, which activates and primes antigen presenting cells 39
(APCs) with tumor associated antigens [17,18]. Activated APCs travel to the tumor draining lymph 40
node where naïve CD8+ T lymphocytes can be activated against tumor cells presenting these specific 41
antigens [19]. These newly activated lymphocytes are being distributed systemically by the circulatory 42
system, from which they can also extravasate at unirradiated tumor sites; this is one of the rate-limiting 43
steps for triggering an radiation-induced abscopal effect [7]. Concurrent immunotherapies could 44
augment radiation-induced immune system activation [20], such as immune checkpoint blockade with 45
anti-CTLA-4 antibody to inhibit receptor CTLA-4 [21–23] that blocks T cell function. Whilst significant 46
inroads have been made into understanding the radiation-immune system synergy, one of the clinically 47
most relevant questions remains unanswered: what is the best radiation dose and dose fractionation to 48
maximize immune activation? Current radiation protocols have not specifically focused on enhancing 49
immune responses. In fact, fewer, larger doses induce significantly stronger antitumor immunity [9,11]. 50
Understanding the complex, non-linear cytotoxic and immunologic consequences of RT is of high 51
biological interest and clinical value. Here, we propose a mathematical framework informed with 52
experimental data that may help identify radiotherapy protocols optimized for immune activation. 53
For demonstration purpose but without the loss of generality, we present the framework in a setting of 54
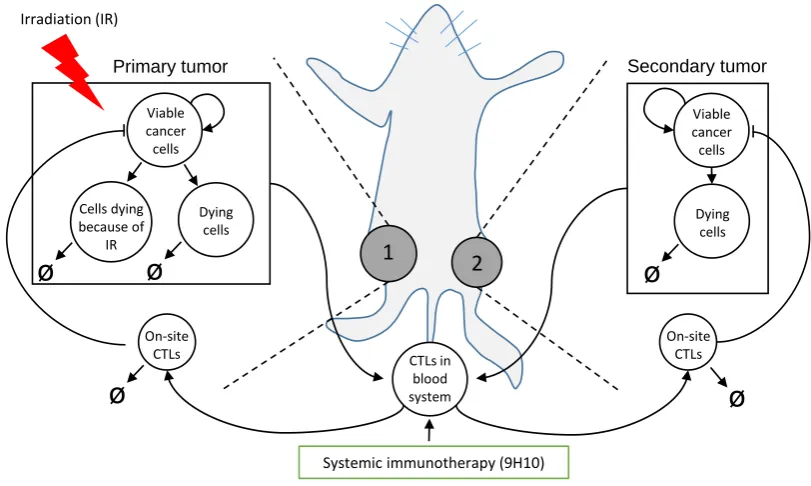
two co-evolving tumor sites comparable to anin vivobilateral tumor model (Figure1). 55
1
2
Dying cells Viable
cancer cells
CTLs in blood system On-site
CTLs
On-site CTLs
Viable cancer cells
Primary tumor Secondary tumor
Systemic immunotherapy (9H10) Irradiation (IR)
Dying cells Cells dying
because of IR
ø
ø
ø
ø
ø
Figure 1. Schematic of the experimental setting, model compartments and interactions. Proposed model (Eqs. (3)-(10)) formalizes the relevant mechanisms underlying thein vivoexperiment [11] in which carcinoma cells were injected subcutaneously into mice at two spatially separated sites (left and right flank) and only one site (1, Primary tumor) was later irradiated (IR). Some mice received also systemic immunotherapy (9H10) which augments activation of tumor-specific cytotoxic T lymphocytes (CTLs).
We develop a mathematical model that simulates radiation response, radiation-induced immune 56
activation, immune checkpoint blockade therapy, and inter-exchange of activated T-cells between 57
and is first compared to the experimental data from [11]. This data fitting procedure allows to 59
estimate model parameters, which are then used to predict responses to dosage not considered in the 60
experimental setting. 61
2. Results 62
2.1. Data fitting 63
The optimization procedure provided the same set of estimated model parameters for about 80% 64
of the 1000 randomly generated initial parameters sets, indicating a robust model structure and that 65
there are only few local minima. The average volumetric differences between model simulation and 66
experimental data for optimal set of parameters (Table1) was 16±19 mm3(average relative error 67
of 19.6±16 %). Considering inherent uncertainty of caliper measurements used in the considered
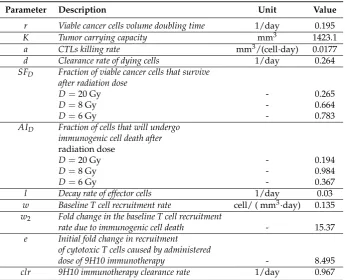
Table 1.Model (Eqs. (3)-(10)) parameters and derived values.
Parameter Description Unit Value
r Viable cancer cells volume doubling time 1/day 0.195
K Tumor carrying capacity mm3 1423.1
a CTLs killing rate mm3/(cell·day) 0.0177
d Clearance rate of dying cells 1/day 0.264
SFD Fraction of viable cancer cells that survive
after radiation dose
D=20 Gy - 0.265
D=8 Gy - 0.664
D=6 Gy - 0.783
AID Fraction of cells that will undergo
immunogenic cell death after
radiation dose
D=20 Gy - 0.194
D=8 Gy - 0.984
D=6 Gy - 0.367
l Decay rate of effector cells 1/day 0.03
w Baseline T cell recruitment rate cell/ ( mm3·day) 0.135
w2 Fold change in the baseline T cell recruitment
rate due to immunogenic cell death - 15.37
e Initial fold change in recruitment of cytotoxic T cells caused by administered
dose of 9H10 immunotherapy - 8.495
clr 9H10 immunotherapy clearance rate 1/day 0.967
68
experiment [11], such a low volumetric deviation indicates excellent agreement between the model 69
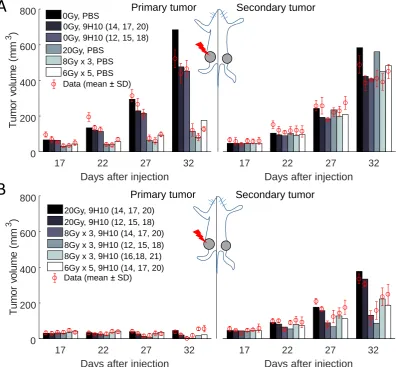
and analyzed experiment. Figure2shows the graphical comparison of measured and simulated tumor 70
volumes for each set of experiments. 71
Most importantly, the model was able to correctly simulate the synergy of radiation with the 72
immune system. In agreement with the experimental data, only combination therapy yields a 73
substantial response of the secondary tumor site (Figure2right panels). At the same time there 74
is only a small difference between model predicted and experimentally evaluated changes in immune 75
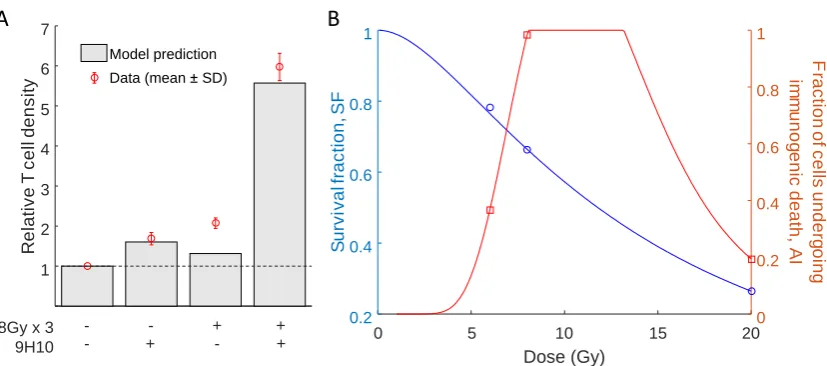
infiltration of the secondary, non-irradiated tumor (Figure3A). 76
Interestingly, model parameters indicate a non-monotonic dependence of the fraction of cells that 77
will undergo immunogenic cell death (AI) on the radiation dose (Table1, Figure3B). Model fit to the 78
data suggests that immunogenic cell death is most prevalent after three fractions of radiation withD= 79
8 Gy. With the derived parameters set, the tumor volume radiation survival fraction is decreasing with 80
17 22 27 32 Days after injection 0
200 400 600 800
T
u
m
o
r
vo
lu
m
e
(m
m
3 )
0Gy, PBS
0Gy, 9H10 (14, 17, 20) 0Gy, 9H10 (12, 15, 18) 20Gy, PBS
8Gy x 3, PBS 6Gy x 5, PBS
17 22 27 32
Days after injection
17 22 27 32
Days after injection 0
200 400 600 800
T
u
m
o
r
vo
lu
m
e
(m
m
3 )
20Gy, 9H10 (14, 17, 20) 20Gy, 9H10 (12, 15, 18) 8Gy x 3, 9H10 (14, 17, 20) 8Gy x 3, 9H10 (12, 15, 18) 8Gy x 3, 9H10 (16,18, 21) 6Gy x 5, 9H10 (14, 17, 20)
17 22 27 32
Days after injection Primary tumor Secondary tumor
A
B
Primary tumor Secondary tumorData (mean ± SD)
Data (mean ± SD)
Figure 2. Comparison of model simulated growth dynamics with experimental data. Solutions to the proposed model (Eqs. (3)-(10)) were obtained after performing data fitting (estimated parameters are presented in Table1). (A) Experimental and simulated tumor volumes for tumors grown without treatment or after monotherapy. (B) Experimental and simulated tumor volumes after combination treatment. Experimental data (red circles) derived from Dewan et al. [11].
2.2. Predicted radiation response 82
To investigate the response to various radiation fractionation protocols we need to interpolate 83
both the values of survival fraction (SFD) and the fraction of cells undergoing immunogenic cell death
84
(AID) for radiation doses not tested experimentally. Following Sachs et al. [25] we assume that the
85
radiation survival fraction can be expressed as 86
SFD=exp
−αD−βG(λT)D2
, (1)
whereG(λT) =2(λT+exp(−λT)−1)/(λT)2,λis the repair rate,Tis the delivery time,Dis 87
the dose, andαandβare linear-quadratic model parameters. The above equation was able to fit 88
model-estimated values ofSFDforD= 6, 8, 20 (see Table1) for parameter valuesα=2.8e-8,β=0.0132 89
andλ=2.0358 (Figure3B). It is worth to mention that the parameters of the radiation response model (1) 90
are conventionally estimated usingin vitroclonogenic survival data after 10 – 14 days. The values 91
reported here refer toin vivovolumetric tumor survival, and thus the absolute values may not be 92
8Gy x 3 9H10 1 2 3 4 5 6 7 R e la ti v e T c e ll d e n s it y Model prediction Data (mean ± SD)
- - + + + -+
-A
0 5 10 15 20
Dose (Gy) 0.2 0.4 0.6 0.8 1 S u rv iv a lf ra c ti o n ,S F 0 0.2 0.4 0.6 0.8 1 F ra c tio n o f c e lls u n d e rg o in g im m u n o g e n ic d e a th , A I
B
Figure 3. Comparison of relative T-cell density and radiation response curves.(A) Model simulated and experimentally measured changes in immune cell infiltration at the secondary tumor site after combination of radiotherapy and 9H10 immunotherapy. (B) Proposed interpolation of model estimated radiation survival fraction (SFD) and proportion of cells undergoing immunogenic cell death (AID) for
radiation dosesD= 6, 8, and 20 Gy (see Table1) using equations (1) and (2).
immunogenic cell death on radiation dose we use the log-normal distribution without the restriction 94
that the integral over whole domain needs to be equal to one 95
AID=min
γ Dexp
−(log(D)−µ)
2 ρ , 1 . (2)
Equation (2) is able to fit estimated values ofAIDforD= 6, 8, and 20 Gy for parameter values
96
γ=14.173,µ=2.448 andρ=0.232 (Figure3B). 97
2.3. Optimal radiation dose and dose fractionation 98
We simulate response of both primary and secondary tumors to a single dose irradiation to the 99
primary and compare final overall tumor burden (V1(32days) +V2(32days)) to simulated responses 100
to radiotherapy divided into multiple fractions with the same total or biologically effective dose (BED). 101
We assume that radiation is delivered on a daily basis starting from day 12 and, following [26,27], we 102
use the standard BED formula 103
BED=nD(1+D/θ).
withθ=20 Gy. In all cases we simulate concurrent 9H10 immunotherapy using protocols from 104
the experimental setup that was used to calibrate the model. 105
The differences in final tumor volumes dependent on radiation fractionation are primarily 106
governed by the response of the secondary tumor as the primary tumor is almost completely eradicated 107
for a total dose of 60 Gy independent of fractionation schedule (data not shown). Model simulations 108
suggest that the overall tumor response can vary by more than one order of magnitude depending 109
on the radiation protocol. For total dose of 40 Gy divided into 3 fractions and immunotherapy 110
administered at days 12, 15 and 18 the overall tumor burden at day 32 is 12 mm3, compared to 513 111
mm3if the same total dose is delivered in 15 fractions of 2.67 Gy each (Figure4A). 112
Similarly the model predicts that for 40 GyBEDthe overall tumor burden can be reduced by a 113
factor of almost 20 for the best radiation fractionation (30.5 mm3for 12.36 Gy x 2 compared to 552 mm3 114
for 2.38 Gy x 15; Figure4B). Moreover, simulations suggests that optimal number of fractions and dose 115
20 40 60 80 100 120 140 160 Total dose (Gy)
9 10 11 12 13 14 2 4 6 8 10 12 14 O p ti m a l n u m b e r o f fr a c ti o n s
1 2 3 4 5 6 7 8 9 10 11 12 13 14 15 Number of fractions
0 200 400 600 800 1000 T o ta l tu m o r b u rd e n a t d a y 3 2 (m m 3 )
Same biologically effective dose (BED)
9H10 (14, 17, 20) 9H10 (12, 15, 18) 9H10 (16,18, 21)
1 2 3 4 5 6 7 8 9 10 11 12 13 14 15 Number of fractions
0 200 400 600 800 1000 T o ta l tu m o r b u rd e n a t d a y 3 2 (m m 3 )
Same total dose
9H10 (14, 17, 20) 9H10 (12, 15, 18) 9H10 (16,18, 21)
TD = 20 Gy
TD = 40 Gy
TD = 60 Gy
BED = 20 Gy
BED = 40 Gy
BED = 60 Gy
A B
C D
20 40 60 80 100 120 140 160 Biologically effective dose (Gy)
7 8 9 10 11 12 13 14 1 2 3 4 5 6 7 8 O p ti m a l n u m b e r o f fr a c ti o n s Optimal r ad iation do se p er f ra ct ion (Gy ) Optimal r ad iation do se p er f ra ct ion (Gy )
Figure 4. Optimal radiation fractionation and dose per fraction for immune activation.Dependence of the model predicted overall tumor burden at day 32, i.e. V1(32days) +V2(32days), for different
total (A) and biologically effective doses (B) for various numbers of fractions. Radiation is delivered daily and concurrent three doses of 9H10 immunotherapy are applied at different times [11]. (C) and (D) optimal number of radiation fractions and corresponding doses per fraction depending on the prescribed total and biologically effective doses. We assume that 9H10 immunotherapy is applied on days 12,15, and 18.
outcome (53.8 mm3for 7.5 Gy x 8 fractions to a total of 60 Gy total dose vs 65.3 mm3for 10 Gy x 2 for a 117
total of 20 Gy; Figure4A) thereby potentially reducing normal tissue toxicity. 118
Systemic analysis of the optimal number of fractions and dose per fraction, i.e. the number of 119
fractions that leads to the smallest overall tumor burden, for different total and biologically effective 120
doses indicates that there is a certain range of doses per fraction to maximize therapeutic effect. For 121
clinically relevant total dose (Figure4C) or biologically effective dose (Figure4D) of 60 Gy the model 122
predicts optimal treatment with four to five fractions of 10 Gy to 13 Gy each. Model simulations 123
further indicate that timing of immunotherapy within the tested protocols contributes significantly 124
less to overall outcome compared to the radiation fractionation schema. However, the relatively 125
simple model may not be appropriate to thoroughly investigate timing of immunotherapy as detailed 126
pharmacokinetics and dynamics of blood absorption from the peritoneal cavity were omitted. 127
3. Discussion 128
Since the advent of immunotherapy, the synergy of radiation with the immune system has 129
received unprecedented attention. While clinical trials for immunotherapy in combination with 130
radiotherapy are plentiful, very little attention is given to a priori optimization of radiation dose 131
and dose fractionation to induce robust antitumor immunity. The possibility of rationally inducing 132
Here we introduced a novel mathematical model calibrated with experimental data to make inroads 134
into deciphering the complexity of radiation and immune system synergy. This framework estimates 135
the optimal number of radiation fractions and radiation dose per fraction to elicit most pronounced 136
systemic immune-mediated tumor responses for clinically relevant total and biologically effective 137
radiation doses. 138
Model simulations suggest that stereotactic radiation doses have the highest likelihood of inducing 139
robust antitumor immunity, which may contribute to the eradication of the tumor targeted by 140
radiation as well as tumors and individual cancer cells outside the radiation field. However, to 141
draw conclusions about immune activation longitudinal blood samples would need to be collected 142
and analyzed for change in circulating immune populations, and compared to conventional radiation 143
doses. Standard of care radiation for many localized tumors is delivered in 2 Gy daily fractions for 144
a total of 50-70 Gy [26]. According to model predictions, conventional radiation schemas may not 145
be able to elicit strong immune-mediated tumor responses. It is conceivable that systemic responses 146
would be especially important for patients with lymph node involvement, circulating tumor cells, or 147
subclinical or undiagnosed metastatic deposits [14]. Our work indicates that the results of the recent 148
proof-of-principle trial of 3.5 Gy x 10 fractions with concurrent immunotherapy with more than 25% of 149
patients exhibiting objective systemic responses to focal radiation [9] would be further enhanced if 150
three to four stereotactic radiation fractions were applied. 151
The presented results, however, may be biased by the experimental data used for model calibration. 152
More complex metastatic disease distributions, i.e. combinations of tumors in different organs, need 153
to be evaluated using the proposed framework. To increase confidence in the clinical validity of 154
framework predictions, prospectivein vivoexperiments should evaluate the radiation dose-dependent 155
probability of inducing immunogenic cell death. Nevertheless, the presented work provides the first 156
inroads and quantitative foundations to evaluating radiation fractionation protocols for inducing 157
immune-mediated systemic antitumor responses. With the continuously increasing number of clinical 158
trials combining radiation and various forms of immunotherapy, such a framework could become an 159
invaluable tool to design clinical protocols and, eventually, to support individual patient treatment 160
planning. 161
4. Materials and Methods 162
4.1. Experimental data 163
Herein we use the data reported by Dewan and colleagues in [11], in which TSA mouse breast 164
carcinoma cells were injected subcutaneously into syngeneic mice at two spatially separated sites 165
(left flank, day 0, primary tumor; and right flank, day 2, secondary tumor; Figure1). Mice received 166
one of four different treatment protocols: group 1: no treatment; group 2: irradiation of the primary 167
tumor only with different fractionation protocols: 20 Gy x 1 fraction, 8 Gy x 3, and 6 Gy x 5 (daily 168
doses for each fractionated protocol; radiation delivered at 600 cGy/min); group 3: three fixed doses of 169
CTLA-4-blocking monoclonal antibody (9H10; immune checkpoint blockade) given with at least two 170
days apart, starting on day 12, 14 or 16; group 4: combination radiation and immunotherapy (protocols 171
as in groups 2 and 3). Tumor volumes at both flanks were evaluated every 2 to 3 days until day 32. 172
Treatment was initiated when both tumors reached palpable sizes (day 12; 32 mm3and 21 mm3on 173
average for primary and secondary tumors, respectively). At end of experiment (day 35) secondary 174
tumors from all groups, except for those that received radiation using fractionations other than 3 x 175
8Gy, were excised and analyzed by fluorescence microscopy for the presence of CD8+ T cells. 176
4.2. Mathematical model of tumors-immune system interaction 177
We develop a mathematical model that simulates radiation response, radiation-induced immune 178
activation, immune checkpoint blockade therapy, and inter-exchange of activated T-cells between 179
Based on the experimental setting [11] we consider two tumor sites (i=1, 2) at two spatially separated 181
locations each characterized by time-dependent volumeVi(t). At both sites we formalize the temporal
182
dynamics of four co-existing and interacting populations: 1) viable cancer cells (volumeCi(t)mm3);
183
2) cancer cells dying in a non-immunogenic manner (volumeDi(t)mm3); 3) cancer cells dying in
184
immunogenic manner (volumeIi(t)mm3) and 4) activated tumor-specific cytotoxic T cells (effector
185
cells; densityEi(t)cells/mm3). Assuming that immune cells do not contribute significantly to the
186
observed tumor volume, we denote the total measurable volume with 187
Vi(t) =Ci(t) +Di(t) +Ii(t). (3)
The volume occupied by viable cancer cells is assumed to follow logistic growth with 188
site-independent tumor carrying capacity, K, and growth rate, r, modulated by the predation 189
of immunocompetent effector cells. Here carrying capacity and growth rate are assumed to be 190
independent of the site following the experimental setup of cell line-initiated tumors in contralateral 191
flanks of the mouse. The equation governing growth of each tumor site is 192
dCi(t)
dt =rCi(t)
1−Vi(t) K
−aCi(t)Ei(t). (4)
The above equation is analogous to the one considered in [28,29] and in our earlier work [7]. 193
Herein, however, the equation takes into account volumesCi(t),Vi(t)and effector cell densitiesEi(t)
194
instead of numbers of individual cells. A detailed description of all parameters with specific values 195
and units can be found in Table1. 196
To limit model complexity, we assume that cancer cells death due to competition for resources or 197
immune cell predation is non-immunogenic: 198
dDi(t)
dt =rCi(t) Vi(t)
K +aCi(t)Ei(t)−dDi(t), (5) in which parameterddenotes fixed clearance rate of dying cells.
199
After primary tumor (V1) irradiation we introduce an additional volume of dying cells. 200
Radiation-induced cell death is described using the standard approach [26,27]; at each irradiation 201
momentt+j the model system state is instantaneously modified as follows 202
C1(t+j ) = C1(t−j )SFD,
D1(t+j ) = D1(t−j ) +C1(t−j )(1−SFD)(1−AID),
I1(t+j ) = I1(t−j ) +C1(t−j )(1−SFD)AID,
(6)
where t−j and t+j denote the times immediately before and after irradiation, respectively; 203
SFD denotes the fraction of viable cancer cells surviving radiation with dose D; and AID is the
204
dose-dependent fraction of cancer cells that undergo immunogenic cell death. Consequently, 1−AID
205
denotes the fraction of non-immunogenic cell death events. Here, irradiation is the only source of cells 206
in the compartmentI1(t)from which they are cleared with rated 207
dI1(t)
dt =−dI1(t). (7)
We consider APCs that recognize the same tumor-specific antigens at both tumor sites and travel 208
to the tumor-draining lymph node to activate naïve T cells. Those activated T cell traffick with the 209
blood system before extravasating at one of the two tumor sites. According to our prior work [7] each 210
trafficking T cell may extravasate at the ith tumor site with time-dependent probabilitypi(t), which in
211
the considered setting can be expressed as 212
pi(t) = Vi
(t)
For tumors that are located in different anatomic organs equation (8) will include additional terms. 213
However, this could still be simulated with the previously proposed mathematical framework [7]. 214
Without radiation and immunotherapy, effector cells are being recruited proportionally to total 215
volumetric tumor burdenV1(t) +V2(t). The recruitment term for each tumor siteican be expressed 216
aswpi(t) (V1(t) +V2(t)) where parameterwis the overall recruitment rate. Explicit consideration 217
of immunotherapy effects and immunogenic cell death after radiation yields the following equation 218
describing the number of cytotoxic T cells 219
dVi(t)Ei(t)
dt =−lEi(t)Vi(t) + (1+u(t))pi(t)w
2
∑
j=1
1+w2
Ij(t)
Vj(t)
!
Vj(t), (9)
where first and second terms are spontaneous exhaustion and recruitment of immune cells, 220
respectively. Functionu(t)describes the effect of immunotherapy and under usual pharmacokinetic 221
assumptions [30] can be expressed as 222
u(t) =e
t Z
0
c(s)exp(−clr(t−s))ds, (10)
wherec(s)is drug administration rate at times,clris the clearance rate of the considered inhibitor, 223
and parameteredescribes the drug impact on the system. Model equations Eqs. (3)-(10) have been 224
implemented in MATLAB software and solved using built-in ordinary differential equation solver 225
ode45with lowered default tolerances (RelTol and AbsTol equal to 1e-8) to increase solution accuracy. 226
4.3. Parameter estimation 227
The goal of the parameter estimation procedure was to identify model parameters for which 228
the error of 1) the simulated tumor volumesV1(t) andV2(t) compared to experimental volume 229
measurements; and 2) simulated relative change of T cell infiltration in the secondary tumor compared 230
to experimental data, 231
ERR(p) =
∑
e∈W1 2
∑
j=1
∑
tiVj(ti,p)−Vj,data(ti)
Vj,data(ti)
!2
+
∑
e∈W2
E2(35,p)
E2,ctrl(35,p)
−Rdata
2
, (11)
is minimized. The given set of parameters values is denoted by p,W1denotes the set of all 232
experiments,W2denotes the set of experiments in which immune infiltration in the secondary tumor 233
was evaluated at day 35, ti denotes one of the recorded measurement times, ctrl denotes control
234
experiment (no radiation and immunotherapy), andRdatadenotes the measured change in immune
235
infiltration relative to the control experiment. 236
Although 9H10 immunotherapy was injected intraperitoneally in the considered experiment [11], 237
we assume for simplicity thatc(s) = D(δ(s−t¯1) +δ(s−t¯2) +...), whereδis Dirac delta function 238
andti is injection day (we takee = eDin equation (10)). This assumption may in general lead to
239
decrease of fit quality and introduces inherent bias towards applying immunotherapy at the same time 240
as radiation, but at the same time we do not need to estimate additional parameters related to drug 241
release from the intraperitoneal cavity. 242
For parameter estimation, 124 data points were used to calibrate the values of 13 parameters 243
simultaneously. Only values of two parameters were kept fixed during the minimization process: 244
1) tumor growth rater, which was calculated directly from initial growth data of untreated control 245
experiments, 2) T cells exhaustion ratel, which was taken directly from [31]. For numerical error 246
minimization we used the deterministic derivative-based trust region method [32] implemented in 247
lsqnonlinfunction from MATLABs Optimization Toolbox. In order to avoid local minima we generated 248
Author Contributions: Conceptualization, JP and HE; methodology, JP; software, JP; validation, JP and HE;
250
formal analysis, JP; investigation, JP; resources, HE; data curation, JP; writing—original draft preparation,
251
JP; writing—review and editing, HE; visualization, JP; supervision, HE; project administration, HE; funding
252
acquisition, HE.
253
Funding:This project was supported (in part) by the American Cancer Society’s Institutional Research Grant.
254
Conflicts of Interest:The authors declare no conflict of interest. The founding sponsors had no role in the design
255
of the study; in the collection, analyses, or interpretation of data; in the writing of the manuscript, or in the
256
decision to publish the results.
257
Abbreviations 258
The following abbreviations are used in this manuscript:
259 260
RT Radiotherapy
APC Antigen presenting cell CTL Cytotoxic T lymphocyte
IR Irradiation
BED Biologically effective dose
261
References 262
1. Delaney, G.; Jacob, S.; Featherstone, C.; Barton, M. The role of radiotherapy in cancer treatment: Estimating
263
optimal utilization from a review of evidence-based clinical guidelines. Cancer2005, 104, 1129–1137.
264
doi:10.1002/cncr.21324.
265
2. Erridge, S.C.; Featherstone, C.; Chalmers, R.; Campbell, J.; Stockton, D.; Black, R. What will be the
266
radiotherapy machine capacity required for optimal delivery of radiotherapy in Scotland in 2015?Eur. J. 267
Cancer2007,43, 1802–1809. doi:10.1016/j.ejca.2007.05.022.
268
3. Wideł, M.; Lalik, A.; Krzywo ´n, A.; Poleszczuk, J.; Fujarewicz, K.; Rzeszowska-Wolny, J. The different
269
radiation response and radiation-induced bystander effects in colorectal carcinoma cells differing in p53
270
status. Mutat. Res. - Fundam. Mol. Mech. Mutagen.2015,778, 61–70. doi:10.1016/j.mrfmmm.2015.06.003.
271
4. Poleszczuk, J.; Krzywo ´n, A.; Fory´s, U.; Wideł, M. Connecting radiation-induced bystander effects
272
and senescence to improve radiation response prediction. Radiat. Res. 2015, 183, 571–577.
273
doi:10.1667/RR13907.1.
274
5. Blyth, B.J.; Sykes, P.J. Radiation-Induced Bystander Effects: What Are They, and How Relevant Are They
275
to Human Radiation Exposures? Radiat. Res.2011,176, 139–157. doi:10.1667/RR2548.1.
276
6. Demaria, S.; Ng, B.; Devitt, M.L.; Babb, J.S.; Kawashima, N.; Liebes, L.; Formenti, S.C. Ionizing radiation
277
inhibition of distant untreated tumors (abscopal effect) is immune mediated.Int J Radiat Oncol Biol Phys 278
2004,58, 862–870. doi:10.1016/j.ijrobp.2003.09.012.
279
7. Poleszczuk, J.; Luddy, K.A.; Prokopiou, S.; Robertson-Tessi, M.; Moros, E.G.; Fishman, M.; Djeu, J.Y.;
280
Finkelstein, S.E.; Enderling, H. Abscopal benefits of localized radiotherapy depend on activated
281
T cell trafficking and distribution between metastatic lesions. Cancer Res. 2016, 76, 1009–1018.
282
doi:10.1158/0008-5472.CAN-15-1423.
283
8. Formenti, S.C.; Demaria, S. Combining radiotherapy and cancer immunotherapy: a paradigm shift. J Natl 284
Cancer Inst2013,105, 256–265. doi:10.1093/jnci/djs629.
285
9. Golden, E.B.; Chhabra, A.; Chachoua, A.; Adams, S.; Donach, M.; Fenton-Kerimian, M.; Friedman,
286
K.; Ponzo, F.; Babb, J.S.; Goldberg, J.; Demaria, S.; Formenti, S.C. Local radiotherapy
287
and granulocyte-macrophage colony-stimulating factor to generate abscopal responses in patients
288
with metastatic solid tumours: a proof-of-principle trial. Lancet Oncol. 2015, 16, 795–803.
289
doi:10.1016/s1470-2045(15)00054-6.
290
10. Crittenden, M.; Kohrt, H.; Levy, R.; Jones, J.; Camphausen, K.; Dicker, A.; Demaria, S.; Formenti, S. Current
291
clinical trials testing combinations of immunotherapy and radiation. Semin Radiat Oncol2015,25, 54–64.
292
doi:10.1016/j.semradonc.2014.07.003.
293
11. Dewan, M.Z.; Galloway, A.E.; Kawashima, N.; Dewyngaert, J.K.; Babb, J.S.; Formenti, S.C.;
294
Demaria, S. Fractionated but not single-dose radiotherapy induces an immune-mediated abscopal
effect when combined with anti-CTLA-4 antibody. Clin. Cancer Res. 2009, 15, 5379–5388.
296
doi:10.1158/1078-0432.CCR-09-0265.
297
12. Kaminski, J.M.; Shinohara, E.; Summers, J.B.; Niermann, K.J.; Morimoto, A.; Brousal, J. The controversial
298
abscopal effect.Cancer Treat Rev2005,31, 159–172. doi:10.1016/j.ctrv.2005.03.004.
299
13. Chandra, R.A.; Wilhite, T.J.; Balboni, T.A.; Alexander, B.M.; Spektor, A.; Ott, P.A.; Ng, A.K.; Hodi,
300
F.S.; Schoenfeld, J.D. A systematic evaluation of abscopal responses following radiotherapy in
301
patients with metastatic melanoma treated with ipilimumab. Oncoimmunology 2015, 4, e1046028.
302
doi:10.1080/2162402X.2015.1046028.
303
14. Poleszczuk, J.; Luddy, K.; Chen, L.; Lee, J.K.; Harrison, L.B.; Czerniecki, B.J.; Soliman, H.; Enderling, H.
304
Neoadjuvant radiotherapy of early-stage breast cancer and long-term disease-free survival.Breast Cancer 305
Res.2017,19, 75. doi:10.1186/s13058-017-0870-1.
306
15. Pilones, K.A.; Kawashima, N.; Yang, A.M.; Babb, J.S.; Formenti, S.C.; Demaria, S. Invariant natural killer T
307
cells regulate breast cancer response to radiation and CTLA-4 blockade.Clin Cancer Res2009,15, 597–606.
308
doi:10.1158/1078-0432.CCR-08-1277.
309
16. Habets, T.H.; Oth, T.; Houben, A.W.; Huijskens, M.J.; Senden-Gijsbers, B.L.; Schnijderberg, M.C.; Brans,
310
B.; Dubois, L.J.; Lambin, P.; De Saint-Hubert, M.; Germeraad, W.T.; Tilanus, M.G.; Mottaghy, F.M.; Bos,
311
G.M.; Vanderlocht, J. Fractionated radiotherapy with 3 x 8 Gy induces systemic anti-tumour responses
312
and abscopal tumour inhibition without modulating the humoral anti-tumour response. PLoS One2016,
313
11, e0159515. doi:10.1371/journal.pone.0159515.
314
17. Kroemer, G.; Galluzzi, L.; Kepp, O.; Zitvogel, L. Immunogenic cell death in cancer therapy. Annu. Rev. 315
Immunol.2013,31, 51–72. doi:10.1146/annurev-immunol-032712-100008.
316
18. Reits, E.A.; Hodge, J.W.; Herberts, C.A.; Groothuis, T.A.; Chakraborty, M.; Wansley, E.K.; Camphausen, K.;
317
Luiten, R.M.; de Ru, A.H.; Neijssen, J.; Griekspoor, A.; Mesman, E.; Verreck, F.A.; Spits, H.; Schlom,
318
J.; van Veelen, P.; Neefjes, J.J. Radiation modulates the peptide repertoire, enhances MHC class I
319
expression, and induces successful antitumor immunotherapy. J. Exp. Med. 2006, 203, 1259–1271.
320
doi:10.1084/jem.20052494.
321
19. Coussens, L.M.; Werb, Z. Inflammation and cancer. Nature2002,420, 860–867. doi:10.1038/nature01322.
322
20. Vatner, R.E.; Cooper, B.T.; Vanpouille-Box, C.; Demaria, S.; Formenti, S.C. Combinations of immunotherapy
323
and radiation in cancer therapy. Front. Oncol.2014,4, 325. doi:10.3389/fonc.2014.00325.
324
21. Postow, M.A.; Callahan, M.K.; Wolchok, J.D. Immune checkpoint blockade in cancer therapy, 2015.
325
doi:10.1200/JCO.2014.59.4358.
326
22. Callahan, M.K.; Wolchok, J.D.; Allison, J.P. AntiCTLA-4 antibody therapy: Immune monitoring
327
during clinical development of a novel immunotherapy. Semin. Oncol. 2010, 37, 473–484.
328
doi:10.1053/j.seminoncol.2010.09.001.
329
23. Wolchok, J.D.; Saenger, Y. The Mechanism of Anti-CTLA-4 Activity and the Negative Regulation of T-Cell
330
Activation.Oncologist2008,13, 2–9. doi:10.1634/theoncologist.13-S4-2.
331
24. Walker, R.; Enderling, H. From concept to clinic: Mathematically informed immunotherapy.Curr. Probl. 332
Cancer2016,40, 68–83. doi:10.1016/j.currproblcancer.2015.10.004.
333
25. Sachs, R.K.; Hahnfeld, P.; Brenner, D.J. The link between low-LET dose-response relations and the
334
underlying kinetics of damage production/repair/misrepair. Int. J. Radiat. Biol. 1997, 72, 351–374.
335
doi:10.1080/095530097143149.
336
26. Prokopiou, S.; Moros, E.G.; Poleszczuk, J.; Caudell, J.; Torres-Roca, J.F.; Latifi, K.; Lee, J.K.; Myerson, R.;
337
Harrison, L.B.; Enderling, H. A proliferation saturation index to predict radiation response and personalize
338
radiotherapy fractionation.Radiat. Oncol.2015,10, 159. doi:10.1186/s13014-015-0465-x.
339
27. Poleszczuk, J.; Walker, R.; Moros, E.G.; Latifi, K.; Caudell, J.J.; Enderling, H. Predicting Patient-Specific
340
Radiotherapy Protocols Based on Mathematical Model Choice for Proliferation Saturation Index. Bull. 341
Math. Biol.2018,80, 1195–1206. doi:10.1007/s11538-017-0279-0.
342
28. Kuznetsov, V.A.; Makalkin, I.A.; Taylor, M.A.; Perelson, A.S. Nonlinear dynamics of immunogenic tumors:
343
Parameter estimation and global bifurcation analysis.Bull. Math. Biol.1994,56, 295–321.
344
29. Kuznetsov, V.A.; Knott, G.D. Modeling tumor regrowth and immunotherapy. Math. Comput. Model.2001,
345
33, 1275–1287.
346
30. Bonate, P.L. Pharmacokinetic-Pharmacodynamic Modeling and Simulation; Springer US: Boston, MA, 2011.
347
doi:10.1007/978-1-4419-9485-1.
31. Kirchner, D.; Panetta, J.C. Modeling immunotherapy of the tumor-immune interaction. J. Math. Biol.1998,
349
37, 235–252.
350
32. Byrd, R.H.; Schnabel, R.B.; Schultz, G.A. A trust region algorithm for nonlinearly constrained optimization.
351
SIAM J Numer Anal1987,24, 1151–1170.

![A one dimensional AgI coordination polymer: catena poly[[[[N′ (4 cyanobenzylidene)nicotinohydrazide]silver(I)] μ N′ (4 cyanobenzylidene)nicotinohydrazide] trifluoromethanesulfonate]](data:image/gif;base64,R0lGODlhAQABAIAAAP///wAAACH5BAEAAAAALAAAAAABAAEAAAICRAEAOw==)