Type of the Paper (Article)
Model for the collection and analysis of data from
teachers and students, supported by Academic
Analytics
Fredys A. Simanca H.1*, Isabel Hernández Arteaga2, María Elsa Unriza Puin3, Fabian Blanco Garrido4, Jaime Paez Paez5, Jairo Cortés Méndez6
1 Universidad Cooperativa de Colombia; [email protected] 2 Universidad Cooperativa de Colombia; [email protected] 3 Universidad Cooperativa de Colombia; [email protected] 4 Universidad Cooperativa de Colombia; [email protected] 5 Universidad Cooperativa de Colombia; [email protected] 6 Universidad Cooperativa de Colombia; [email protected] * Correspondence: [email protected]; Tel.: (57+3108608077)
Abstract: Business Intelligence, defined by [1] as "the ability to understand the interrelations of the facts that are presented in such a way that it can guide the action towards achieving a desired goal", has been used since 1958 for the transformation of data into information, and of information into knowledge, to be used when making decisions in a business environment. But, what would happen if we took the same principles of business intelligence and applied them to the academic environment? The answer would be the creation of Academic Analytics, a term defined by [2] as the process of evaluating and analyzing organizational information from university systems for reporting and making decisions, whose characteristics allow it to be used more and more in institutions, since the information they accumulate about their students and teachers gathers data such as academic performance, student success, persistence, and retention [5]. Academic Analytics enables an analysis of data that is very important for making decisions in the educational institutional environment, aggregating valuable information in the academic research activity and providing easy to use business intelligence tools. This article shows a proposal for creating an information system based on Academic Analytics, using ASP.Net technology and trusting storage in the database engine Microsoft SQL Server, designing a model that is supported by Academic Analytics for the collection and analysis of data from the information systems of educational institutions. The idea that was conceived proposes a system that is capable of displaying statistics on the historical data of students and teachers taken over academic periods, without having direct access to institutional databases, with the purpose of gathering the information that the director, the teacher, and finally the student need for making decisions. The model was validated with information taken from students and teachers during the last five years, and the export format of the data was pdf, csv, and xls files. The findings allow us to state that it is extremely important to analyze the data that is in the information systems of the educational institutions for making decisions. After the validation of the model, it was established that it is a must for students to know the reports of their academic performance in order to carry out a process of self-evaluation, as well as for teachers to be able to see the results of the data obtained in order to carry out processes of self-evaluation, and adaptation of content and dynamics in the classrooms, and finally for the head of the program to make decisions.
Keywords: Academic Analytics, data storage, education and big data, analysis of data, learning analytics
1. Introduction
Business Intelligence, defined by [1] as "the ability to understand the interrelations of the facts that are presented in such a way that it can guide the action towards achieving a desired goal", the extraction and analysis of data has taken on special importance in recent years in many areas of application, as it can be transformed into highly useful information and knowledge by means of the application of various techniques, just as it is an irrefutable fact today that the use of information and communication technologies (ICT), and more recently digital technologies and web publishing platforms have been favoring the modernization of the prevailing traditional educational models based, on the one hand, on the student's physical presence and, on the other, on the teacher's master class [3]. The first mention of the term Learning Analytics dates from 2000, but it is treated as something marginal derived from the principles of Business Intelligence and Data Mining applied to information management systems related to the educational field [4].
Given that the analysis of data is defined as the measurement, collection, analysis, and reporting of data about individuals and their contexts in order to understand and optimize the learning process and the environment in which it takes place, it is also determined by a number of processes such as: setting goals, collecting data, analyzing and visualizing data, drawing conclusions, and acting on the results [5]. The use of Learning Analytics allows to evidence student achievements, since it gives access to data from the student and the teacher. Information such as the average of subjects, the levels of failure and progress, and the learning curve are aspects that must be taken into account in order to achieve objectives, thus allowing the possibility to count on clear data that are important for the evaluation of subjects. Based on the above, we have used and taken profit of this information in order to carry out an analysis of data of the information systems in educational entities based on "Academic Analytics" whose characteristics allow it to be used more and more in institutions, as in most of the cases, the information they accumulate about their students, such as academic performance, student success, persistence, and retention [6] is not analyzed, besides, it adds valuable information to the academic research activity and provides easy to use business intelligence tools. These solutions help academic leaders to better understand the research, the achievements of the members of the faculty, the departments, the programs, and the entire institution [7], making the use of these technologies allow to have a clearer vision about the performance in academic processes, such as evaluating the model in the practice by comparing the results of the academic performance of students from the very beginning, in order to diagnose possible shortcomings and/or capabilities that the students may show based on the observation and analysis of their data, so that learning processes that are developing in a non-beneficial way can be corrected.
The educational platforms are a good example of the reason why Big Data is used, and this is because every student leaves a trail in the system that is made up of every action taken by the student during his academic period, and that requires advanced techniques for its analysis; in the context of learning, one could speak of Learning Analytics (LA), Academic Analytics (AA), or Educational Data Mining (EDM). In other words, during the analytical phase, the data collected are interpreted in order to turn them into relevant and understandable information, to finally get to the information phase, which is the moment when the results of the research are presented. It should be noted that the results cannot be generalized and that they are only valid in each investigation for the environment that is being studied [8], where the process of analysis begins by purging the data matrix, processing missing values, and checking the parametric assumptions. It then continues with the descriptive analysis of all the variables involved (univariate) and finishes with the inferential analysis (bivariate or multivariate), where the probabilities of dependence or causality between the variables that have been studied are checked [9] [10].
should be analyzed and turned into information by using some tool or technique, such as data mining and Academic Analytics. In addition, there are some methods that have been designed using different technical processes and tools, to be focused on research and the analysis of data through multivariate technologies that are actually used in all scientific fields, but especially, that have become important analysis techniques in educational research [12]. Based on the above, the application of analysis techniques makes it possible to collect, measure, and analyze in detail the information on each student, its context, and how it interferes with the student's learning processes, and his strengths and weaknesses, with the objective of improving the quality and effectiveness of his production by means of the compression of individual or group profiles; this, as there is a new generation of students and teachers who needs new technologies to improve education. The use and implementation of this methodology in education works for collecting data produced by the learner and the teacher using intelligent data and analysis models where it is possible to discover information and social connections.
All these technologies are characterized because they measure a single type of information in many variables; simultaneously, there are methods that are based on machine-learning, Bayesian networks, support vector machines, and methods based on diagrams; or multivariate statistics methods, which have been used for a long time to combine and visualize multivariate data [13].
This research explores two methodologies that are adapted to the characteristics of the data in higher education and which are considered to be the most appropriate; therefore, in the process of including variables that are used for modeling student academic performance and teacher performance, we took into account the teaching approach that is centered on the theory of "Academic Analytics", as the work was carried out with data provided by the information systems of educational entities. This information is useful for evaluation, insofar as it helps to identify material that can be used in some of the causes of students' academic difficulties [14], by using a multilevel analysis to perform eligibility checks from a quantitative scope and a bivariate logistical analysis that allows calculations to be made from a qualitative scope, the latter technique being the one that expands the information that there is in the educational field on this method that relates two variable responses. Nevertheless, the methods help organizations to understand the process of discovering knowledge and providing a roadmap to follow while planning and carrying out projects. This in turn results in time and cost savings, and in a better understanding and acceptance of the processes [15].
In accordance with the above, the central objective of this research is to build a model for the collection and analysis of data from virtual classrooms [16], supported by Academic Analytics, with the purpose of determining the academic performance of students and the academic achievement of teachers. The use of this technique would help to answer questions and find patterns in student and teacher behavior, considering the following questions as an example: Which is the subject with the highest loss rate? What is the time slot in which students get better grades? In which area does a specific student perform better? Which students did not enroll from one semester to the next? Is there a common pattern within the group of students in the previous question? From the teacher, questions such as: In which area do you perform better? In which subject do you get the worst grades? In which subject do you lose more students? among others. The answers, not only to these questions, could be taken as a reference when making decisions during the whole educational process by the academic management group, but also by other actors within the academic community, such as the students.
In order to guide the theoretical, empirical, and applied development in this research, the following specific objectives are set: (a) to analyze university academic performance through a model with two associated response variables; (b) to analyze university academic performance at an individual and contextual level; (c) to determine the contribution of individual, group or contextual variables to university academic performance behavior; and (d) to identify the nature of the relationship between the variables and student academic performance.
groups for the development and implementation of strategies that contribute to the improvement of student learning. It can be concluded that this practice can at least be characterized by a good technological infrastructure, teachers with a high level of technological and pedagogical knowledge, continuous teachers, and a communication and administration mediated by technology that works well [17] [6].
2. Materials and Methods
The methodology that has been applied in this research is outlined as a quantitative investigation that studies the association or relationship between quantified variables and tries to determine the strength of association or correlation between variables and the generalization and objectification of the results, by using a sample to make inference to a population from which any sample comes from [18], based on the Academic Analytics technique also known as Analytics in Higher Education or BI in Higher Education which is basically defined as the process of evaluating and analyzing organizational information from university systems for reporting and for decision-making [2].
During the development of this project, we used the agile project development methodology, SCRUM; based on the book Learning Agile: Understanding Scrum, XP, Lean, and Kanban, from the renowned software engineering publisher O'Reilly Media.
The generality and objectification of the results through a sample that makes inference to a population was developed with a set of real data whose general objective in the study test was to calculate the academic benefit of university students who develop their studies in virtual classrooms from a qualitative and quantitative perspective, by means of a model that integrates the data that was provided by the learning analysis tools for the acquisition of personalized data of students and that is stored in the database of the educational entity during the entire process of student training. This information can also be used to create research groups for the development and implementation of strategies that contribute to the improvement of student learning. The specific objective here is to improve student learning, provide information on their own habits, reduce academic dropout and high motivation when making a decision, and provide and promote the analysis of hypothetical situations using decision-making and the information that has been retrieved from student and teacher activity within virtual classrooms, and that has been stored in the database that is available [19].
It is fundamental to evaluate the model in the practice from the very beginning, by comparing the results of the academic performance of students so that it is possible to diagnose the deficiencies and/or capacities that they may have based on the observation and analysis of their database, in order to correct learning processes that are being developed in a way that is not beneficial for the learning process.
In the process of including variables that are used for the modeling of academic processes, we took into account the teaching approach centered on the theory of Academic Analytics, so this work was developed with data provided by the information system of the university (SINU). In accordance with the above, the central objective of this research was developed in the construction of a model for the collection and analysis of data from the information system supported by Academic Analytics, in order to determine the academic performance of students and the performance of teachers through the use of multivariate techniques, since a multilevel analysis allows for the analysis not only of the relationship among students but also of the various contexts in which they operate, since individuals belonging to the same context will tend to have common interests, characteristics, and behavior, with respect to their belonging to different contexts [16] [20].
The following are the characteristics of a multilevel method [12]:
• It contains two, three or more mechanisms for analysis, simultaneously.
• It allows to explore which other particular, group, or contextual variables are controlling the behavior of the dependent variable.
• It contains fixed and random effects.
• It records the nested structure of the data and accesses to reach unbiased or centered appreciations of the diversifications that have occurred at different levels of the hierarchy.
• It manages to contain information at the level of the individual and the context.
• It shows correct evaluations of the standard errors and the statistical significance of the coefficients.
The variables have been selected in order to meet the specific objectives that were set out. These variables are of an academic, demographic, and technological nature given that there are an infinite number of variables inherent to the measurement of academic performance and academic achievement; also, the use of Academic Analytics varies within institutions, as in some functional areas users seem to be more active in the use of the analytical platforms of their institutions than others [6] [21].
Multilevel models are more applicable in the field of education because individual observations in these populations are not completely independent, that is to say, there is a hierarchical structure [22], which implies a dependence on micro-level observations (students) within the macro-level (classrooms or centers). This dependence refers to the fact that students from the same group share the same environment, teachers, rules, communication, etc.
2.1 Population under study
The first sample is used to make the quantitative analysis, and it comprises an individual, group, and contextual scope. The participants making up this sample are [12] [19]:
• Students who are enrolled in some core subject. The sample does not include generic subjects, free configuration subjects, complementary subjects, and basic training; this in order to maintain greater homogeneity, since the core subjects are characterized by providing the specific content of the degree course and also include the use of technological aspects in the teaching and learning process that will allow to obtain the variables that are involved.
• Teachers (full-time, guest, and administrative-teaching) who deliver classes for core subjects.
The second sample is used to make the qualitative analysis and is made up of :
• Students who should be in the last year of a 5-year degree, the study period comprises April 2015 - April 2019
• Careers that are offered in the distance-learning mode whose training plan include 5 years of study.
2.2 Academic performance
The general objective is to measure academic performance from a qualitative and quantitative approach.
The variable that is taken into account as a quantitative indicator is the student's final grade, which is measured in a range from 0 to 40 points (including the sum of tests, online work, and other activities).
The academic performance, according to the qualitative method, is measured by using two response variables: Grade (the average grade expressed as A, B, C, D, E) and the accumulation of university credits expressed as (1, 2, 3, 4, 5).
2.3 Final design of the Model for collection and analysis of data
In order to define the design of the final model, we took the Learning Analytics model worked by [14] as a basis, and from which some characteristics were taken (Figure 1):
• User's interface
• Data Extraction
Figure 1. System design model. Source: [11].
In turn, the processing of historical data proposes three main outputs, which are the result of the processing of the above-mentioned data:
• Generation of reports
• Data Display
• Control panels
2.4 Data base design
Based on the information that was obtained during the section, the following entities were identified:
• Academic Program (e.g. Systems Engineering, Industrial Engineering, etc.)
• Pensum of studies (Pensum were separated from the academic program, an academic program can have multiple pensum).
• Subject (e.g. Software Engineering I, Programming I, etc.)
• Course
• Professor
• Student
• Program Director
• Academic
• Teacher Evaluation
• Teacher Evaluation Question
• Classification of Teacher Evaluation Question
2.5 Data obtained by input formats
The input data for the model is obtained from the information system of the university, in three different types of format (pdf, csv and xls), detailed below:
• List of students enrolled by program/level
• Name of the student or student code.
• Student ID number.
• Student's academic semester at the time the report is generated.
• Attending time (D: Day, N: Night) to which the student belongs to or Name of the academic program.
• Code of the academic program.
• Number of students per academic semester.
• Total number of students per program.
• Subjects per study plan or Name of the program.
• Name of the study plan.
• Program code or curriculum code.
• Subjects per curriculum.
2.6 Proposals used for modeling
• A historical record must include one (1) student, one (1) academic period, one (1) group, and one (1) pensum.
• One teacher evaluation can be applied to multiple courses.
• Each course can answer multiple questions.
• One question may belong to only one set of questions.
• A processed document may or may not belong to a single academic period.
• A processed document may need multiple documents for being processed.
• A processed document can belong to one type of documents.
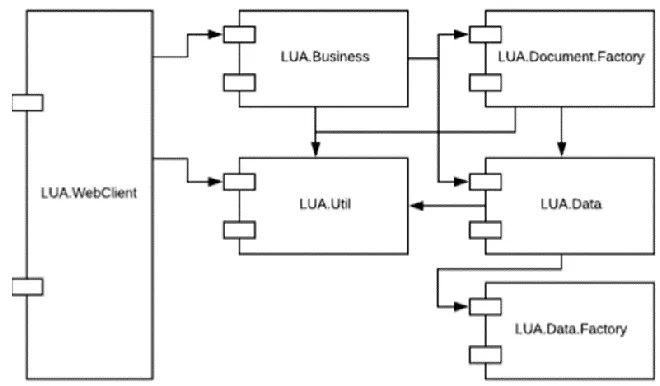
For the ideal functioning of the tool to be developed, we are proposing five sub-projects, each one responsible for a specific task at the level of programmatic operations. The purpose of creating different projects is to encapsulate codes that can undergo changes, as proposed by the SRR principle of the S.O.L.I.D. group of principles, as follows [23]:
• Subproject, LUA.Business
• Subproject, LUA.Data
• Subproject, LUA.Data.Factory
• Subproject, LUA.Document.Factory
• Subproject, LUA.Util
A component diagram was designed to show the relationships and cardinality that there are among the different projects that have been proposed, as detailed in Figure 2.
Figure 2. Diagram of components. Source: Author.
Figure 3. Directory tree. Source: Author.
This project made an approach based on the second strategy (graphs). The proposal was to use the following distribution graphics:
• Horizontal and vertical bar charts: According to the Canadian national statistics agency [24], a bar chart, whether vertical or horizontal, usually presents numerical or categorical variables grouped in intervals.
• Radar chart: According to Indrayan and Holt [25], a radar chart provides an adequate presentation when the performance of a group, or of multiple variables, is compared with another group. This because as many axes are drawn as there are variables.
• Sector graph, donut: The Canadian national statistics agency [24] states that a donut chart, derived from the pie chart, is a way of summarizing a group of categorical data or of summarizing the different values that a given variable can take.
• Line graphs: Line graphs are probably the most popular graphs compared to the graphs defined above, as they define a linear behavior in the samples and support quality sampling resulting from the method chosen by the researchers [26]. And as stated by the Canadian national statistics agency, it is a visual comparison between two variables, defined on the X and Y axis respectively [24].
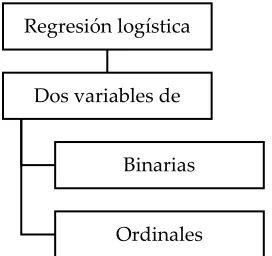
Considering the two response variables, the most suitable model for the study of the data is the bivariate logistic regression, therefore the analysis of development is carried out according to this method, as detailed in Figures 4 and 5.
Figure 4. Bivariate logistic regression. Source: Author.
Regresión logística bivariante Dos variables de
respuesta Binarias
In order to carry out the bivariate logistic estimation with two dichotomous response variables, we used the study tool of the R Program14 together with the Zelig15 package, as detailed in Figure 5.
Figure 5. Bivariate logistic estimation. Source: [12].
3. Results
Figure 6 summarizes in detail the model that was defined.
Figure 6: Model for the design of the system. Source: Author.
This model was successfully translated into the construction of a website, and the results of the implementation in the four (4) pages that were defined for the sample statistics are described below:
• User/Stats.aspx
• Teacher/Stats.aspx
• Admin/GlobalTStats.aspx
• In order to improve the display of statistics, the table was partitioned into three (3) different categories for both students and teachers:
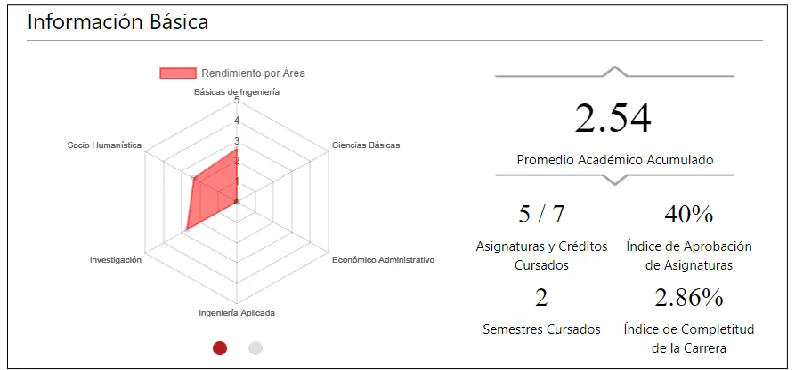
• Basic Information: It will show a radar with the performance measured by area, in addition to the scalars that were proposed in the definition of statistics.
• Detailed Charts: It will show the charts that were proposed in the definition of statistics.
• Classification: It will show the classifications that were proposed in the definition of statistics.
3.1 Individual statistics per student
a) Basic Information
Table 1 shows the information that is required to determine the performance measured by area, as well as the values proposed in the statistical definition of the data that was obtained.
Table 1. Basic Information, Individual statistics per student.
Data Type Definition
Scalar Cumulative grade point average Scalar Subject approval rating Scalar Subjects undertaken Scalar Credits earned Scalar Semesters undertaken Scalar Career completion index Chart Performance measured by area
Source: Author.
Figure 7. Basic information, individual statistics per student. Source: Author.
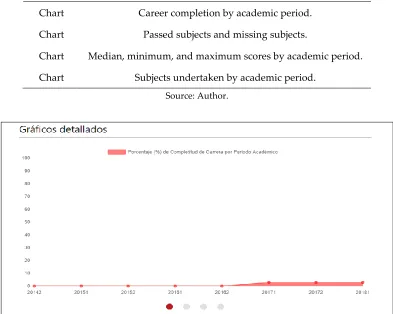
b) Chart of performance measured by area.
Table 2. Detailed chart, individual statistics per student.
Data Type Definition
Chart Career completion by academic period. Chart Passed subjects and missing subjects.
Chart Median, minimum, and maximum scores by academic period. Chart Subjects undertaken by academic period.
Source: Author.
Figure 8. Basic information, individual statistics per student. Source: Author.
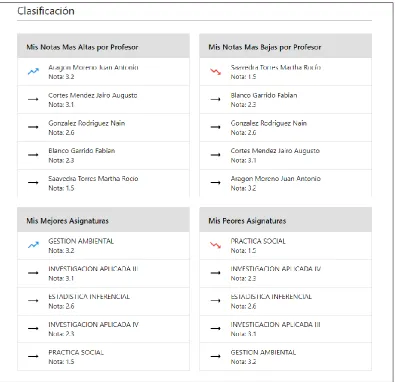
c) Classification
Table 3 specifies the classification of the values that were used, which allowed to obtain the statistical data related to the results of the subject, per student.
Table 3. Classification, individual statistics per student.
Data Type Definition
Classification Best / worst teachers according to the scores that were obtained. Classification Best / worst subjects
Figure No. 9: Classification, student global statistics. Source: Author.
3.2 Individual Statistics per Teacher
a) Basic Information
Table 4 defines the information that is required to obtain the data, which damaged the statistics according to basic information by each teacher.
Table 4. Basic information, Individual statistics per teacher.
Data Type Definition
Scalar Average Teacher Rating. Scalar Number of active semesters. Scalar Number of courses taught. Scalar Average grades obtained by students. Scalar Students' approval rate.
Chart Performance in teacher evaluation according to self-evaluation, student evaluation and administrative evaluation.
Figure 10. Basic information, individual statistics per teacher.
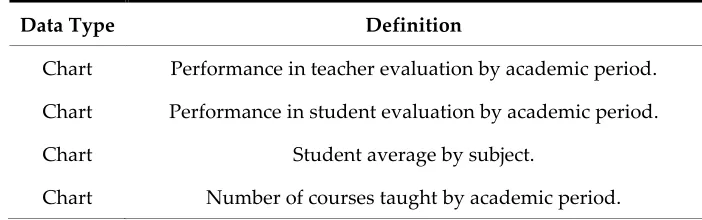
b) Detailed charts.
Table 5 specifies the values that are used for establishing the individual statistics obtained through the data, per teacher.
Table 5. Detailed charts, individual statistics per teacher.
Data Type Definition
Chart Performance in teacher evaluation by academic period. Chart Performance in student evaluation by academic period. Chart Student average by subject.
Chart Number of courses taught by academic period.
Source: Author.
c) Classification
Table 6 specifies the classification of the values that were used in order to obtain the statistical data related to the individual data, per teacher.
Table 6. Classification, individual statistics per teacher.
Data Type Definition
Classification Subjects most often taught.
Source: Author
Figure 12: Classification, teacher individual statistics. Source: Author.
The estimation of coefficients associated with the type of teacher variable shows that classrooms with administrative teachers, on average, increase the academic performance of the classroom, more than classrooms with full-time teachers. The same is true for guest teachers, since the result indicates that classrooms with guest teachers, on average, increase classroom academic performance more than classrooms with full-time teachers.
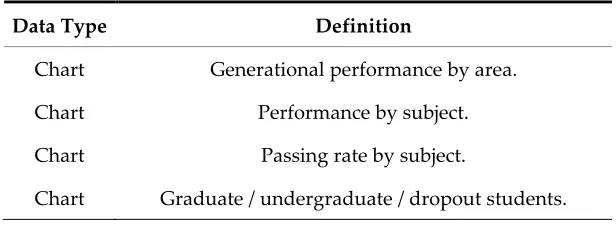
3.3 Global statistics per student
a) Basic information
Table 7 shows the detail of the statistical data obtained for the global statistics per student.
Table 7. Basic information, global statistics per student
Data Type Definition
Chart Global performance by area.
Source: Author
Figure 13. Basic information, global statistics per student.
b) Detailed Charts
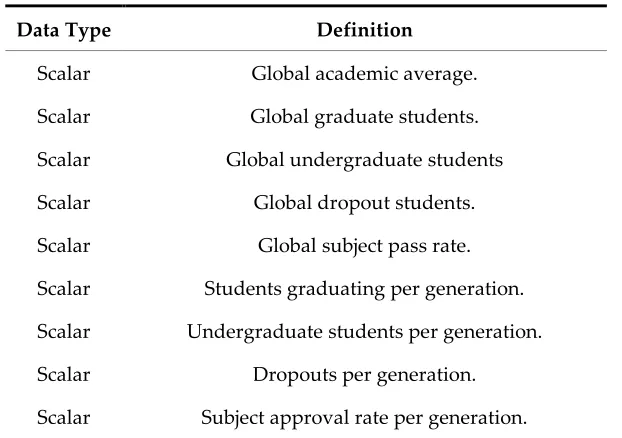
Table 8 shows the detail of the data that was obtained for the global statistics per student.
Table 8. Basic information, global statistics per student
Data Type Definition
Chart Generational performance by area. Chart Performance by subject. Chart Passing rate by subject.
Chart Graduate / undergraduate / dropout students.
Figure 14. Detailed charts, global statistics per student.
c) Classification
Table 9 shows the detail of the data that were obtained for the global statistical classification per student.
Table 9. Detailed charts, global statistics per student
Data Type Definition
Classification Students with the best/worst grades.
Figure 15. Detailed charts, global statistics per student.
3.4 Global statistics per teacher
a) Basic information
Table 10 shows the detail of the statistical data obtained for the global statistics per teacher.
Table 10. Basic information, global statistics per teacher
Data Type Definition
Scalar Global average of teacher evaluation. Scalar Number of active/inactive teachers.
Scalar Average number of courses taught per teacher by semester. Scalar Number of courses taught by semester.
Chart Global performance according to teacher evaluation.
Source: Author.
Figure 16. Basic information, global statistics per student.
b) Detailed charts
Table 11 shows the detail of the data obtained for the global statistics per teacher.
Table 11. Basic information, Global statistics per teacher
Data Type Definition
Chart Teacher evaluation by component per teacher. Chart Student evaluation per teacher.
Chart Average teacher evaluation by academic period.
Figure 17. Detailed charts, global statistics per teacher.
c) Classification
Table 12 shows the detail of the data obtained for the global statistical classification per teacher.
Table 12. Global statistical classification of teachers.
Data Type Definition
Classification Teachers with the best/worst grades.
Source: Author
Figure 18. Classification, global statistics per teacher.
3.5 Credits and Grade Association - Optimal Academic Performance
year of the career, obtaining a grade between A (Outstanding) and B (Very good). On the other hand, the students who have not achieved success are those who obtain a grade between C and E and that as a consequence, take longer to finish their career.
3.6 Credits and Grade Association - Positive Academic Performance
The IT solution that was generated by this project allowed the visualization of statistics based on the data that has already been mentioned. These statistics will work as a source of information, at the time of making decisions during the academic process, helping to improve the educational environment for managers, teachers, and students. And even when the application was initially conceived with the purpose of helping the directors of the institution to make decisions, its scope, in terms of final public, was later expanded and will also allow the involvement of both teachers and students.
This project will make an approach based on the second strategy (from the charts), since the diagrams, both bar and sector, help to capture the distribution of a categorical variable more quickly.
Positive academic performance is considered to be those cases in which students obtain a grade and an accumulation of credits above the average of the group that is being studied, so that the group that is above the average has a grade between A and D, and an accumulation of credits. Finally, we carried out a logistic analysis with the two ordinal response variables, whose specific objective is to determine which is the highest probability of occurrence (credits and low grades, low credits and high grades, high credits and low grades, credits and high grades).
4. Discussion
The variables of the Academic Analytics approach have a positive relationship with academic performance, being the participation in chat, forum, and video-collaboration the communication means with the greatest impact, since they cause an increase in academic performance, thus affirming that there is a significant relationship with academic performance [19].
The gender variable is not statistically significant in any of the estimates, since they indicate that there is no relationship between gender and academic performance [27].
The online variable shows that students who have little participation in online activities (chat, forum, and video collaboration) have less of an advantage in achieving optimal academic performance compared to students who participate moderately or actively.
It would be interesting to analyze the association that there is between two response variables through the Bivariate Logistic Regression model, in order to measure the dropout or graduation rate of students. For this purpose, it is very convenient to extend the ordinal bivariate modeling and to deepen its interpretation possibilities in educational research contexts and learning processes.
5. Conclusions
The interest in improving the quality of education also seeks to improve academic performance. This indicator is of interest to various sectors of society (educational institutions, government institutions, the business sector, citizens, etc.).
For this study, we considered variables that can be controlled by higher education institutions because the contribution is mainly directed to universities; however, it could include socioeconomic, sociocultural, institutional, intellectual, affective, and academic determinants, among others [12] [19]. The IT solution that was generated by this project allowed the visualization of statistics based on the data that has already been mentioned. These statistics will work as a source of information, at the time of making decisions during the academic process, helping to improve the educational environment for managers, teachers, and students.
Students will be able to demonstrate their performance throughout their academic process in different ways, which will become a useful tool when making decisions throughout their professional career, not only for students but also for the directors of the institution.
Finally, it should be concluded that academic performance improves when providing relevant information on the variables that are associated with it, since the academic success of students is a priority for all universities. The success of students in university was analyzed considering their performance in terms of "qualitative performance", measured by their average grade, and "quantitative performance", measured by accumulated university credits [28].
6. Patents
Contributions by Author: Conceptualization: Fredys A. Simanca H., Isabel Hernandez Artegada, Maria Unriza Puin; Methodology: Jaime Paez Paez, Jairo Cortes Mendez; Software: Fredys A. Simanca H., Fabian Blanco Garrido.
Funding: This research did not receive any external funding
Conflicts of Interest: The authors declare no conflicts of interest.
References
[1] H. P. Luhn , «Business Intelligence System,» IBM Journal, vol. 2, nº 4, pp. 314-318, Octubre 1958.
[2] D. Oblinger G., P. Deblois B. y J. Campbell P., «Academic Analytics A New Tool for a New Era,»
EDUCAUSE Review, vol. 42, nº 4, pp. 41-57, 2007.
[3] B. Martín Galán y D. Rodríguez Mateos, «La Evaluación de la Formación Universitaria Semipresencial y en Línea en el Contexto del Eees Mediante el Uso de los Informes de Actividad de la Plataforma Moodle,»
Revista Uned, vol. 15, nº 1, pp. 159-178, 2012.
[4] S. Buckingham Shum y R. Ferguson, «Social Learning Analytics: Five Approaches,» 2nd International
Conference on Learning Analytics & Knowledge/ACM International Conference Proceeding Series, vol. 5, nº 1,
pp. 1-10, 2014.
[5] D. V. Sanz Gómez, Learning Analytics: Propuesta metodológica y caso de estudio en educación no universitaria.Tesis.Master.Especialidad en Tec., Valladolid: Universidad de Valladolid, 2018.
[6] P. J. Goldstein , «Academic Analytics: The Uses of Management Information and Technology in Higher Education,» ECAR Key Findings, vol. 1, nº 1, pp. 1-12, 2005.
[7] Academicanalytics, «Academicanalytics.com,» Academicanalytics, 14 06 2020. [En línea]. Available: https://academicanalytics.com/community/documents/. [Ú ltimo acceso: 14 06 2020].
[8] P. Millares Martinez, M. B. Alfageme González y R. Rodrïguez Pérez, INVESTIGACIÓ N E INNOVACIÓ N EN EDUCACIÓ N INFANTIL, Murcia: Universidad de Murcia Servicio de Publicaciones , 2014.
[9] A. Ureña Espa, Introducción a la investigación en el deporte mediante la metodología de la observación, España: Universidad de Granada, 2003.
[10] D. Cárdenas Vélez, J. Conde González y J. Courel Ibáñez, «El uso del Match Analysis para la mejora del rendimiento físico en los deportes de equipo,» Calle Libre, vol. 8, nº 23, pp. 147-155, 2013.
[11] F. A. Simanca H., Sistema de mejora del rendimiento académico mediante Learning Analytics. Tesis. Doc., España: Universidad Internacional de la Rioja, 2018.
[13] S. Muñoz Armayones, Técnicas Multivariantes para el Análisis de Datos Ó micos. Tesis.Grd, Sevilla: Universidad de Sevilla, 2016.
[14] F. Simanca, R. González Crespo, L. Baena Rodríguez y D. Burgos, «Identificar estudiantes en riesgo de reprobar un tema mediante el uso de Learning Analytics para la tutoría personalizada posterior,» Ciencias
Aplicadas, vol. 9, nº 3, pp. 1-17, 2019.
[15] L. Kurgan y P. Musilek, «A survey of Knowledge Discovery and Data Mining process models,» The
Knowledge Engineering Review, vol. 2, nº 1, pp. 1-24, 2006.
[16] F. A. Simanca Herrera, R. González Crespo, L. Rodríguez Baena y D. Burgos, «Una solución para gestionar el ciclo de vida completo de la analítica de aprendizaje en un sistema de gestión del aprendizaje: analítico,» IEEE Revista Iberoamericana de Tecnologías del Aprendizaje, vol. 14, nº 4, pp. 127-134, 2019.
[17] A. D. Olofsson, G. Fransson y J. O. Lindberg, «A study of the use of digital technology and its conditions with a view to understanding what ‘adequate digital competence’ may mean in a national policy initiative,» Educational Studies, vol. 45, nº 1, pp. 1-17, 2019.
[18] C. Cruz, S. Olivares y M. González, Metodología de la Investigación, Mexico: Grupo Editorial Patria, 2014.
[19] F. Simanca, R. González, L. Rodríguez y D. Burgos, «Modelo de tutoría personalizada a través de la aplicación de fases de Learning Analytics,» IEEE Latin America Transactions, vol. 18, nº 1, pp. 7-15, 2020.
[20] F. Simanca, R. González, D. Burgos y L. Rodriguez Baena, «Detencion de estudiantes en Riesgo de Perdida de Asignatura Usando Learnig Analytics para una posterior tutorización personalizada,» Journal
Sensors, vol. 18, nº 1, pp. 2-17, 2018.
[21] A. Parnell, D. Jones , A. Wesaw y D. C. Brooks, Institutions’ Use of Data and Analytics for Student Success, United States : NASPA National Association of Student Personnel Administrators, 2018, pp. 1-36.
[22] T. A. Snijders y R. J. Bosker, Multilevel Analysis, London: SAGE publication Ltd, 1999.
[23] J. Garcia Carmona, «Buenas prácticas hacia el eito en el desarrollo del software.,» 15 11 2012. [En línea]. Available: https://jbravomontero.files.wordpress.com/2012/12/solid-y-grasp-buenas-practicas-hacia-el-exito-en-el-desarrollo-de-software.pdf. [Ú ltimo acceso: 17 06 2020].
[24] Naciones Unidas, Comision Económica para Europa., «Guía para presentar estadísticas/ como hacer comprensibles los datos.,» Naciones unidas, Ginebra, 2009.
[25] A. Indrayan y M. P. Holt, Enciclopedia concisa de bioestadística para profesionales médicos, Delhi: CRC Press, 2016.
[26] I. Tuyub Sànchez y G. Buendìa Abalos , «Gráficas lineales: un proceso de significación a partir de su uso en ingeniería,» Ie Revista de Investigación Educativa de la Rediech, vol. 8, nº 15, pp. 11-28, 2017.
[27] C. G. Acevedo Pierart y F. Rocha Pavés, «Estilos de aprendizaje, género y rendimiento académico,»
Revista de estilos de aprendizaje, vol. 4, nº 8, pp. 71-84, 2011.
[28] M. Enea y M. Attanasio, «Un modelo de asociación para datos bivariados con aplicación al análisis del éxito de los estudiantes universitarios.,» Journal of Applied Statistics, vol. 1, nº 1, pp. 1-4, 2015.
![Figure 1. System design model. Source: [11].](https://thumb-us.123doks.com/thumbv2/123dok_us/1010009.1600912/6.595.160.438.83.187/figure-system-design-model-source.webp)
![Figure 5. Bivariate logistic estimation. Source: [12].](https://thumb-us.123doks.com/thumbv2/123dok_us/1010009.1600912/9.595.107.466.121.336/figure-bivariate-logistic-estimation-source.webp)