Article
Comments about Rietveld Analysis and Tolerance
Factor: Y Doped BaTiO
3I. A. Lira-Hernández 1, F. R. Barrientos-Hernández 1, M. Pérez-Labra 1,*,
A. M. García-Mercado 2 and J. A. Romero-Serrano 3
1 Academic Area of Earth Science and Materials, Universidad Autónoma del Estado de Hidalgo, AACTyM, Carretera Pachuca−Tulancingo km. 4.5, C.P. 42184, Mineral de la Reforma, Pachuca de Soto 42039, Hidalgo, México; [email protected] (I.A.L.-H.);
[email protected] (F.R.B.-H.); [email protected] (J.A.R.-S.) 2 Mechanical Engineering Department, Technological Institute of Pachuca,
Road México-Pachuca km. 87.5, Pachuca de Soto 42080, Hidalgo, México; [email protected]
3 Metallurgy and Materials Department, ESIQIE-IPN. UPALM, Zacatenco, México 07738, D.F., México
* Correspondence: [email protected]; Tel.: +52-717-2000 (ext. 2297, 2280)
Abstract: The aim of this work is to compare two softwares (MAUD and TOPAS) based on the Rietveld algorithm and to test the concept of tolerance factor using the dissolution at high temperature of yttrium
into BaTiO3. In general, both softwares give up different values of the crystalline parameters however the
trends are similar in most cases but the analysis of the strain and crystallite size in the BaTiO3 crystals
suggests that, in this particular case, MAUD offered results more consistent with the expected behavior. Using the crystalline parameters calculated by Rietveld, the tolerance factor values were obtained and these data suggest even better stability in the crystalline structure than that expected using theoretical parameters. Tolerance factor concept also indicates that Ti4+ should be preferred.
Keywords: A. Ceramics; A. Oxides; C. X-ray diffraction; D. Crystal structure; D. Microstructure
1. Introduction
The technique developed by Hugo Rietveld represented a qualitative leap in the analysis of X-Ray diffraction data. Several softwares have been commercially available through time. Nowadays, TOPAS and MAUD softwares are quite popular throughout the materials science researching literature. The method is, of course, basically the same but the computational efficiency and capabilities of the numerical algorithms that each software offer is the difference. The Rietveld method includes several parameters initially designed to qualify the reliability of the results in a simple manner but the experience has shown that the interpretation of such parameters are not that simple after all.
The output parameters of the Rietveld method include [1]:
2 / 1 2 2 )) ( ( )) ( ) ( ( − =
obs y w cal y obs y w R i i i i iexp
/R R
GOF= wp (2)
[
2]
1/2exp= (N−P)/
wiyiR (3)
Where:
obs y wi =1/ i(
= ) (obs
yi Observed (gross) intensity at the i th step,
= ) (cal
yi Calculated intensity at the i th step,
N = number of data points P = number of parameters
The sum is carried out over all data points.
Observing equations 1 and 2, one could expect that the best fit occurs when → 0 or when → 1,
however the experience shows that is not exactly the case as it will be discussed later in this article. One interesting case that can be used to test these softwares is the dissolution of yttrium into the BaTiO3
crystalline lattice since yttrium can occupy both Ti4+ and Ba2+ cationic sites depending on several
parameters such as the Ba/Ti ratio, the sintering temperature, etc. [2] However, regarding that the energy
to create a Barium vacancy in the BaTiO3 lattice has been reported as 5.94 eV whereas to form a Ti4+
vacancy is 7.56 eV it is expected that at high sintering temperatures the Yttrium ion can “choose” the crystalline site of equilibrium because at these temperatures there will be a high concentration of both cation vacancies whereas at low temperature only Ba vacancies would be available. A systematic study has been published elsewhere [3] where it has been supported that at 1500°C yttrium occupies the Ti site in the lattice. It is important to know which substitution is taking place because the electrical properties depend strongly on this matter.
Dissolution of Yttrium into BaTiO3 is also a good case to test the concept of Tolerance Factor initially
developed by Goldsmith [4]. In this concept it is assumed that the cubic structure is the most stable one
for a perovskite type phase of a compound ABO3, and it uses the ionic radii to measure how much the
actual structure is deviated from the perfect cube. Such Tolerance Factor, t, is given as:
= ( − )/√2( − ) (4)
where (A-O) is the distance between the cation A and the oxygen and B-O is likewise the distance between
the cation B and the oxygen. The factor √2 is added in order to that t =1 in the case of a perfect cubic
structure. Any deviation from the unit would mean that the structure losses stability. The distance between the cations and the oxygen is quantified by the use of the ionic radii to become:
= ( − )/√2( − ) (5)
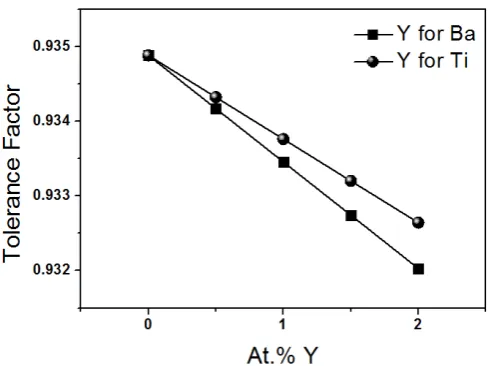
Where rA, rB, and rO are the ionic radii of A, B and O ions. To include the case of a solid solution, the mass law is used to recalculate the ionic radium of the ion which has been replaced by the solute ion. The ionic radii reported in literature are rO = 0.140 nm, rBa = 0.135 nm, rTi = 0.068 nm and rY = 0.93 nm
[5]. Using these values plots of t as a function of Y3+ concentration can be drawn (Figure 1). As observed
Figure 1.Tolerance factor for samples of Y doped-barium titanate
The t value of equations 4 and 5 can be compared to experimental results if it is observed that the distances between ions in equation 4 can be written as:
− = /√2 (6) − = /2 (7)
Where “a” and “c” are the lattice parameters of the tetragonal BaTiO3 unit cell.
2. Experimental Section
The yttrium-doped BaTiO3 ceramics were prepared using BaCO3 Sigma 99% purity, TiO2 Merck 99%
purity and Y2O3 Aldrich 99.99% purity as precursors. The powders were mixed in a stoichiometric ratio
according to Eq. (8) with the x values ranging from 0.005 to 0.02.
2 3 ) 1 ( 2
3 2 2 3
4 2
) 1
( x TiO xYO xO BaTi YO CO
BaCO + − + + → −x x + (8)
The powders were weighed and placed in a polyethylene container with de-ionized water and pellets of
zirconia (ZrO2) to homogenize the mixture for 24 hours by rotation. Excess of water was decanted and the
powder was heated at 80°C for 18 hours to remove remaining water. The powder was recovered and sintered for 1 hour at 1500°C in a furnace Model (CARBOLITE RHF 17/3E (10°C/min)). The powders were characterized at room temperature using a Bruker D8 Focus Diffractometer at an increment of 0.04°
and a 5 angle of incidence. A copper-Kα (λ=1.5418 Å) target was used. Rietveld refinement was performed
on all X-ray patterns using MAUD computer program and TOPAS Academic 4.1 software to determine the crystal structure and lattice parameters as a function of the doping level.
pattern was fitted by a polynomial function of degree 4. The recently developed software MAUD, which is based on the Rietveld method combined with Fourier analysis, has been applied to analyze XRD data for alloys and ferroelectrics [6, 7]. TOPAS Academic 4.1 was also applied using the same assumptions than in the MAUD case.
3. Results and Discussion
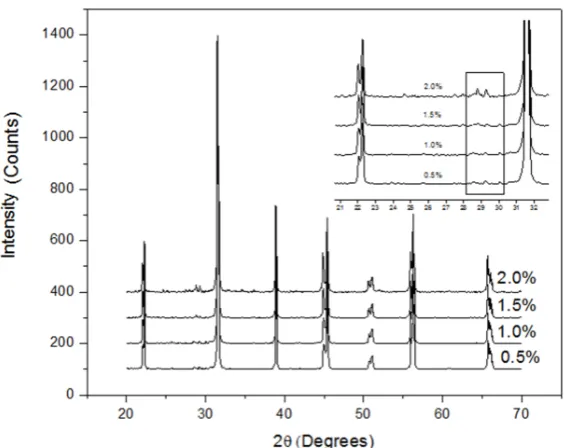
Figure 2 shows the XRD patterns of yttrium doped BaTiO3 samples. The peaks observed correspond to
BaTiO3 (ICDD PDF 05-0626) except for the small peak at 28.7° which correspond to orthotitanate
Ba6Ti17O40. Orthotitanate is formed from the reaction between TiO2 and BaTiO3. The XRD peaks are
slightly displaced from the reflections reported for pure BaTiO3 suggesting the formation of a solid
solution. It has been proved that this shift is due to a distortion of the crystal structure (tetragonal) resulted from the yttrium substitution at titanium positions [3].
Figure 2. X-ray diffraction of the powders prepared at different doping levels
At room temperature, BaTiO3 has a tetragonal structure characterized by lattice parameters “a” and “c”.
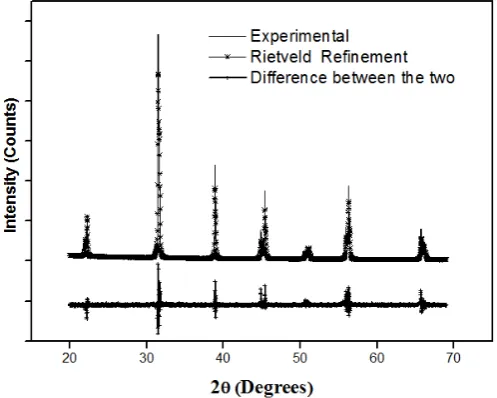
Figure 3. Rietveld refinement patterns of x-ray diffraction for x= 0.5 At Yttrium % MAUD
Figure 4. Rietveld refinement patterns of x-ray diffraction for x= 1. 5 At Yttrium % TOPAS
Initially, the positions of the peaks were corrected by successive refinements of zero-shift error. Considering the integrated intensity of the peaks as a function only of structural parameters, in the case of MAUD software the Marquardt least-squares procedures were adopted for minimization of the difference between the observed and the simulated powder diffraction patterns, and such minimization was carried out using the reliability index parameter [8].
TOPAS academic 4.1 was also used for Rietveld refinement in this work, a number of parameters were refined, including five background terms, five pseudo-Voigt profile function coefficients.
softwares are shown in Tables 1 and 2 for comparison purposes. Parameters in Tables 1 and 2 other than GOF, Rwp and Rexp are not defined in this article because are not relevant for the discussion.
Table 1. Refined parameters of sample by rietveld refinement analyses with MAUD
Sample % at Y Refined Parameters
Rexp Rwp Rp Rwpb Rpb GOF Sig.
0.5 9.3438 0.05690 0.02860 0.1298 0.0979 0.006 0.6089 1.0 6.8211 0.05069 0.02261 0.1493 0.0940 0.007 0.7432 1.5 5.6377 0.04244 0.01788 0.1607 0.0864 0.008 0.7527 2.0 4.8910 0.03068 0.01347 0.1145 0.0629 0.006 0.6273
Table 2.Refined parameters of sample by rietveld refinement analyses with TOPAS
Sample % at Y Refined Parameters
Rexp Rwp Rp Rwpb Rpb GOF
0.5 4.69122 6.943 5.589 12.847 9.760 1.480 1.0 4.24405 6.243 5.004 12.675 9.469 1.471 1.5 5.39427 6.964 5.466 11.662 8.771 1.291 2.0 5.65874 8.092 6.226 12.827 9.542 1.430
Although the algorithm is basically the same (Rietveld algorithm), tutorials of MAUD and TOPAS software emphasize different parameters to evaluate the goodness of fitting. MAUD tutorial points out the parameters Rexp and sig as the important parameters. According to this tutorial, Rexp < 15.0 and sig < 2.0, suggest good fitting, and, as observed in Table 1 these conditions are fulfilled in our results. M.R. Panigrahi et al. argued a good fitting with values of Rwp= 0.768 and GOF=0.24. According to S. Bid et al. [9], in our case, values of Rwp and sig suggest that the refinement is good but the values of GOF are out of range.
Regarding TOPAS software, a GOF factor greater than 1.5 is a strong indication of an inadequate model or false minimum. A value of the GOF factor less than 1.0, however, is an indication not of an extremely high quality refinement as could be expected but of a model that contains more parameters than can be justified by the quality of the data [10]. Values of GOF between 1.09 and 1.28 would confirm a good refinement [9]. According to Pourghahramani et al. [11] the goodness factor values for our experiments imply satisfactory fit to the measured data.
In Figure 5 the lattice parameters as a function of Y3+ concentration are presented. As observed, Figure 5
suggests that, in general, the values of lattice parameters increase when the concentration of Y3+ increases.
However, this trend is more evident for “c” parameter showing the asymmetry of the atomic bonds. In an
ionic crystal, such as BaTiO3, electron orbitals are approximately spherical due to electron exchange
between anions and cations. However, because de difference in valence between Y3+ and Ti4+ the inert
atom configuration cannot be attained and some asymmetry could be expected in the Y3+ ion. The P4mmm
Figure 5.Lattice parameters of a tetragonal unit cell (ICSD-05 0626) as a function of Y3+ concentration
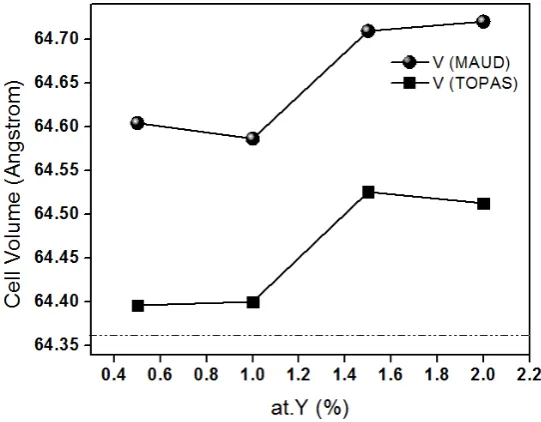
The unit cell volume increases when the Y3+ increases (Figure 6) which can be explained on the difference
in ionic sizes between Y3+ (0.93 nm) and Ti4+ (0.068 nm). It must be notice that the deformation of the
unit cell produced by the solid solution is not only due to the substitution of one small ion for other which is bigger, but also the production of oxygen vacancies is involved [3]. In both Figures, it seems that there is a systematic shift between the output values from TOPAS and MAUD softwares and there is no way to decide which one is more accurate. In the case of the unit cell volume, the difference is almost constant and around 0.2 Å3.
Figure 6. Unit cell volume as a function of Y3+ concentration. The dotted line is the unit cell volume
according the file ICDS-5 0626
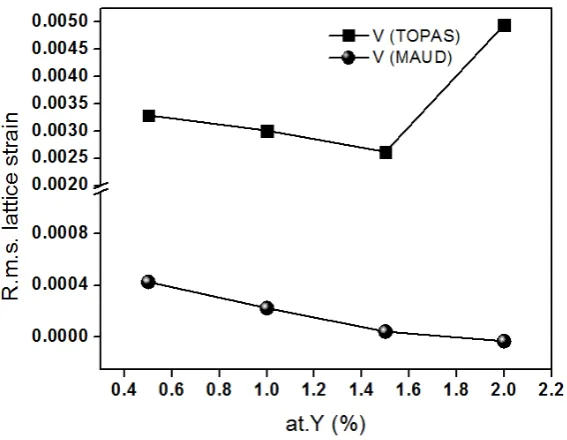
Crystallite size and microstrain as a function of Y3+ concentration is presented in Figure 7 and 8
ceramic (BaTiO3). To assess whether the behaviors shown in Figures 7 and 8 are the expected, the graph
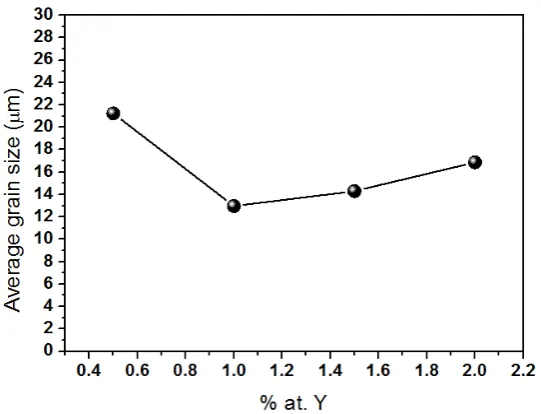
of grain size as a function of Y3+ concentration is necessary and it is presented in Figure 9.
Figure 7. Crystallite size as a function of Y concentration
Figure 9. Average grain size as function of Y3+ concentration
It is commonly seen that the higher the dopant concentration the smaller the grain size, this behavior is due to two main reasons: first, when a solute is added to the crystalline lattice, some deformation occurs which makes difficult the growing of a perfect lattice during sintering and eventually a grain boundary is built up. Second, when the dopant concentration is relatively high, the dissolution becomes harder and
particles of the dopant precursor (in this case Y2O3) play the role of nucleation points. In Figure 9, a
decreasing from 22 to 12 microns in the grain size is observed at low Y3+ concentrations and then the grain
size remains without big changes although a mild increasing is observed. If the grain size is decreasing it is expected that the crystallite size, that is, the coherent regions inside the grains, also decreases as shown in Figure 7. The strong reduction in the grain size observed in Figure 9 in the region 0.4 to 1 at % Y, corresponds to a strong reduction in the crystallite size for the MAUD case in Figure 7 but this strong reduction is not observed for the TOPAS case.
The sintering process tends to build up residual strain inside the grains as the grain growing is taking place and also during the cooling stage due to thermal contraction. However, because the material is fragile, high amounts of deformation are not possible because fracture occurs at small levels of deformation. When fracture occurs the residual strains are released and the fracture plane evolves eventually into a grain boundary. Therefore, it is expected that the strain in the lattice decreases when the grain size decreases just as observed in Figures 8 and 9. In Figure 8 the TOPAS software shows an increase in the microstrain at high Y3+ concentrations which is hard to believe.
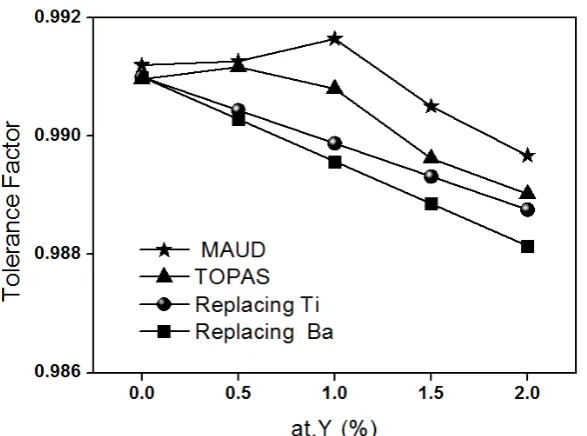
The lattice parameters calculated by MAUD and TOPAS softwares can be used to calculate the Tolerance Factor using the expressions 6 and 7. In this way it is possible to test the Tolerance Factor concept. However, the concept of ionic size assumes that ions are hard balls and therefore these sizes cannot be compared just as reported in literature. In order to compare the theoretical values with Rietveld calculations, the theoretical values plotted in Figure 1 were shift up to coincide to the experimental values
for pure BaTiO3 by adding a constant value. The comparison is presented in Figure 10. As observed,
Figure 10. Tolerance factor as a function of Y concentration for different cases
Table 3. Slopes of the curves shown in figure 10 after least square fitting
Curve Slope (x10-5)
MAUD -76
TOPAS -100
Replacing Ti -110
Replacing Ba -143
As observed, slopes of Rietveld curves have a closer value to the slope for the line corresponding to the Ti substitution, suggesting that Ti substitution is the most likely which, indeed, has been experimentally well supported elsewhere [3].
4. Conclusions
Comparison between the MAUD and TOPAS softwares, presented in this work, suggests that can be very important the optimization of the numeric routines since, although basic parameters (in our case the lattice parameters) could be basically right, some others can be far to be precise. On other hand the tolerance factor concept showed to be a solid concept in spite of its simplicity and it suggests that the actual crystalline structure is more thermodynamically stable than predicted
Acknowledgements: The authors gratefully acknowledge to PRODEP Mexico, for the financial support for this work.
Conflicts of Interest: The authors declare no conflict of interest.
References
[1] E. Prince, Mathematical aspects of Rietveld refinement, in The Rietveld Method, edited by R. A.
Young, Oxford University Press, Great Britain, 1995.
[2] DM. Smyth, The Defect Chemistry of Metal Oxides, Oxford University Press, New York, 2000.
[3] M. Paredes, I.A. Lira, C. Gomez, F. Espino, Compensation mechanisms at high temperature in
Y-doped BaTiO3. Physica B: Condensed Matter.2013,410, 157-161. doi.org/10.1016/j.physb.2012.11.001
[4] A. Rüdiger, Defect structure of oxide ferroelectrics—valence state, site of incorporation, mechanisms
of charge compensation and internal bias field. Journal of Electroceramics. 2007, 19, 11-23.
doi:10.1007/s10832-007-9068-8.
[5] M.T. Buscaglia, V. Buscaglia, M. Viviani, P. Nanni, M. Hanuskova, Journal of the European Ceramic
Society. Influence of foreign ions on the crystal structure of BaTiO3. 2000, 20, 1997-2007.
doi.org/10.1016/S0955-2219(00)00076-5.
[6] P. Sahu, S.K. Pradhan, X-ray diffraction studies of the decomposition and microstructural
characterization of cold-worked powders of Cu–15Ni–Sn alloys by Rietveld analysis. Journal of Alloys
and Compounds.2004, 377, 103-116.doi.org/10.1016/j.jallcom.2003.10.019.
[7] L. Cont, D. Chateigner, L. Lutterotti, J. Ricote, M. L. Calzada, and J. Mendiola, Combined X-ray Texture-Structure-Microstructure Analysis Applied to Ferroelectric Ultrastructures: A Case Study on Pb
0.76 Ca 0.24 TiO3. Ferroelectrics.2002, 267, 323-328. doi.org/10.1080/00150190211032.
[8] M.R. Panigrahi, S. Panigrahi, Rietveld analysis of single phase Ba0.99Dy0.01TiO3 ceramic. Physica B:
Condensed Matter. 2010, 405, 3986-3990.doi.org/10.1016/j.physb.2010.06.043.
[9] S. Bid, S.K. Pradhan, Preparation of zinc ferrite by high-energy ball-milling and microstructure
characterization by Rietveld’s analysis. Materials Chemistry and Physics. 2003, 82, 27-37.
doi.org/10.1016/S0254-0584(03)00169-X.
[10] R.A. Young, D.B. Wiles, Profile shape functions in Rietveld refinements. Journal of Applied
Crystallography. 1993, 15, 430-434.doi.org/10.1107/S002188988201231X.
[11] P. Pourghhramani, E. Altin, M. Rao, W. Peukert E. Forssberg, Microstructural characterization of
hematite during wet and dry millings using Rietveld and XRD line profile analyses. Powder Technology.
2008, 186, 9-21. doi.org/10.1016/j.powtec.2007.10.027.