R E S E A R C H
Open Access
The effects of the current and past meteorological
elements influencing the current pollen
concentrations for different taxa
László Makra
1*, Zoltán Csépe
1, István Matyasovszky
2, Áron József Deák
3, Zoltán Sümeghy
1and Gábor Tusnády
4Abstract
Background:It is an important issue to separate the current and past components of the meteorological parameters influencing the current pollen concentration for different taxa. For this purpose a new statistical procedure, factor analysis with special transformation is introduced. The data set used covers an 11-year period (1997–2007) including daily pollen counts of 19 taxa and 4 climate variables (mean temperature, precipitation amount, global solar flux and relative humidity).
Result:The taxa examined can be classified into three groups, namely arboreal deciduous (AD), arboreal evergreen (AE) and herbaceous (H) taxa. It was found that a better comparison can be established if the taxa are separated within each group according to the starting month of their pollen season. Within the group of AD taxa,Alnus, PopulusandUlmusare marked by a late summer–early autumn peak of the role of past meteorological elements exceeding the role of the current ones almost all over the pollen-free period. ForJuglans, Morus, Platanusand Quercus,the major weights of the current meteorological elements in the spring and early summer show the most characteristic contribution to the pollen production. For AE taxa, the picture is no clear. For H taxa, the curves of Cannabis, Plantago, RumexandUrticaindicate the most equalized course of weights.Ambrosia, Artemisiaand Chenopodiaceae comprise the highest weights of the past weather conditions of all taxa until at least three months before the start of the pollination. Interactions between the phyto-physiological processes and the meteorological elements are evaluated.
Conclusion:Separation of the weight of the current and past weather conditions for different taxa involves practical importance both for health care and agricultural production.
Keywords:Climate change; Allergenic taxa; Pollen; Pollen season; Respiratory allergy; Factor analysis with special transformation
Background
Recently, the earth’s ecosystem has been experiencing a global warming. Projections of future climate change suggest further global warming, sea level rise and an increase in the frequency of some extreme weather events (Parry et al. 2007). By the late 21st century, distributions of European plant species are projected to have shifted several hundred kilometres to the north (Parry et al. 2007; Lindner et al. 2010). The rate of change will exceed the ability of many species to adapt.
As for plant phenology, the timing of seasonal events in plants is changing across Europe due to changes in the climate conditions. Between 1971 and 2000, the average advance of spring and summer was 2.5 days per decade. The pollen season starts on average 10 days earlier and is longer than it was 50 years ago (Feehan et al. 2009).
Climate change in association with an extended urbanization, with high levels of vehicle emissions in urban areas, living in artificial environment with little movement exert negative impact on individuals in most industrialized countries. Hence, these factors may contribute to explain the increasing frequency of respiratory allergy and asthma (D’Amato 2011). Pollen with other factors and microorganisms, like fungal
* Correspondence:[email protected]
1
Department of Climatology and Landscape Ecology, University of Szeged, P.O.B. 653, Szeged HU-6701, Hungary
Full list of author information is available at the end of the article
spores is an important trigger of respiratory diseases. Both quantity related (total annual pollen counts, annual peak pollen counts) and phenological (start, end and duration of the pollen season) characteristics of different taxa are functions of the meteorological variables. Obviously there are other factors as well greatly influencing pollen attributes, like soil biology, topography, nutrient availability, etc. Greater concen-trations of carbon dioxide and, consequently, higher temperatures may increase pollen quantity and induce longer pollen seasons (Ziska et al. 2003; Clot 2008). Pollen allergenicity can also increase as a result of these changes in climate. Furthermore, there is evi-dence that high levels of traffic-derived air pollutants may interact with pollen and bring about more intense respiratory allergy symptoms (Hjelmroos et al. 1999; Motta et al. 2006). Accordingly, global warming may induce a wide pollen-related public health problem; for which the societies should be prepared in time.
Predicting the pollen season characteristics (e.g. the start of the pollen season) as early as possible is of basic importance in order to prepare sensitive people in time for the days of pollen dispersion. Our analysis helps to identify those key periods, meteorological variables of which affect mostly the daily pollen concentrations of the given taxon. Changing climate involves different changes in the weather elements of the individual sea-sons. A potential importance of the procedure is that a period with a changing climate that may have a major impact on the current pollen counts can be detected by the past of meteorological elements.
The main aim of this paper is to study an extended spectrum of airborne pollen characteristics (19 plant taxa) for the Szeged region in Southern Hungary. A novel procedure is introduced in order to separate the current and past effects of the climate variables influen-cing the current pollen concentration. Namely, arrays of daily values of the influencing climate variables in the pollen season of the taxa examined were labelled as current variables, while arrays of daily values of these variables in the period starting from the first pollen-free day following the previous pollen season to the last pollen-free day preceding the actual pollen season were labelled as past variables. This kind of separation has not been demonstrated in the literature. Results are evalu-ated with special attention to the interactions between the phyto-physiological processes and the meteorological elements; furthermore, they are compared for each taxon based on different aspects.
Materials and methods
Location and data
Szeged (46.25°N; 20.10°E), the largest settlement in South-eastern Hungary is located at the confluence of
the Rivers Tisza and Maros (Figure 1). The area is characterised by an extensive flat landscape of the Great Hungarian Plain with an elevation of 79 m above sea level. The city is the centre of the Szeged region with 203,000 inhabitants. The climate of Szeged be-longs to Köppen’s Ca type (warm temperate climate) with relatively mild and short winters and hot sum-mers (Köppen 1931).
The data set consists of daily pollen counts (average daily pollen count per cubic meter of air) of 19 taxa taken over the 11-year period 1997–2007. With their Latin (English) names they are: Alnus (alder), Ambrosia
(ragweed),Artemisia(mugwort),Betula(birch),Cannabis
(hemp), Chenopodiaceae (goosefoots), Juglans (walnut),
Morus(mulberry),Pinus(pine),Plantago(plantain), Plata-nus (plane), Poaceae (grasses), Populus(poplar), Quercus
(oak), Rumex (dock), Taxus (yew), Tilia (linden), Ulmus
(elm) andUrtica(nettle). These 19 taxa produce 93.2% of the total pollen amount for the given period. Taxa with
the highest pollen levels include Ambrosia (32.3%),
Poaceae (10.5%), Populus (9.6%) and Urtica (9.1%),
which together account for 61.5% of the total pollen production (University of Szeged, Pollen Database, 1989–2007) (Table 1).
As regards the taxa with the highest pollen
concentra-tions, Ambrosia genus has only one species, namely
Ambrosia artemisiifolia (Common Ragweed) in Szeged region that appears both in the urban environment and in the countryside. Ragweed occurs especially frequently west of the city. The ruling north-western winds can easily transport pollen into the city. Several species of Poaceae
family, namely Agropyron repens (Common Couch), Poa
trivialis (Rough Meadow-grass), as well as Poa bulbosa
(Bulbous Meadow-grass) over untouched areas, further-morePoa angustifolia(Narrow-leaved Meadow-grass) and
Alopecurus pratensis (Meadow Foxtail) in floodplain and along the dyke surrounding Szeged region represent a substantial proportion in the city. Along the urban lake-sides Phragmites australis (Common Reed) is the most frequent Poaceae. For Populus genus, natural species of
Populus alba(White Poplar) andPopulus canescens(Grey Poplar) are the most frequent in the city and are charac-teristic in floodplain forests along the Tisza and Maros Rivers. In addition, cultivated poplars such as I-273 Poplar andPopulus x euroamericana(Canadian Poplar) and its variants are frequently planted in urban parklands, pub-lic places, as well as along roads in peripheries. Urtica
genus with its only species of Urtica dioica (Common Nettle) in Szeged region is prevailing in the floodplain
forest underwood of the Tisza and Maros Rivers, road-and channel-sides road-and in locust-tree plantations around the city. Urticaalso occurs in neglected grassy lands of the city area (Deák 2010).
The remaining species seldom occur here. Alnus spe-cies are only found in the Botanical Garden of Szeged.
Pollen of Artemisia, Cannabis, Chenopodiaceae and
Rumex can come from neglected areas of both the city and its surroundings, as well as from stubble pastures.
Betula, Juglans, Pinus, Platanus, Taxusand Tiliaspecies have been planted exclusively in public places and gar-dens; they have no natural habitats in the Szeged region. However, since the 1960s Pinus (Pinus sylvestris and
Pinus nigra) species have been extensively planted in the sandy regions north-west of Szeged within the frame-work of an afforestation programme. Their pollen can easily reach Szeged via north-western winds. Morus is planted along avenues and in public places. Plantago
species occur in natural grassy areas of both the city and its surroundings. Quercus species are planted along the embankment surrounding the city, as well as north of the city. Ulmus is planted in the city too; however it is
not very common there. Formerly planted Ulmus
pumila, as an adventive species, also occurs, but its spread is not characteristic. Large natural stocks of
Ulmus minortogether with Ulmus laevislive in the oak-elm-ash alluvial forests alongside the River Maros where planted and spontaneous stocks also appear. They can be found spontaneously even in the willow-poplar allu-vial forests thanks to the mature stocks of the Pécska forest on the Romanian side (Deák 2010).
The pollen content of the air was measured using a 7-day recording Hirst type volumetric spore trap (Hirst 1952) (Figure 1). Pollen sampling was performed as fol-lows: A specific tape was made adhesive by washing it with silicone oil. The sampler absorbed air at a rate of 10 l/min (=14.4 m3/day, which is corresponding to the daily requirement of an adult person) and was supplied with a timer, to which a rotating drum was fitted. The drum moved the adhesive tape (2 mm/h) where pollen grains adhered. After a week of exposure, the tape was removed and cut to a length corresponding to 24 h pollen sampling, covered with a gel mounting agent con-taining fuxin as a stain and put on a microscope slide. Afterwards, the samples were examined under a light microscope at a magnification of 400× to determine pollen types and counts. Five horizontal sweeps were analysed on each slide. Horizontal sweeps were used be-cause the variation in the concentration during the day can be observed along this axis (the direction of the tape shifts in the sampler). The accuracy of the measurement was proportional to the number of sweeps and the con-centration of particles. Counting was performed using a standard sampling procedure. Pollen concentrations
Table 1 Plant habits and phenological pollen season characteristics
Taxa 1Plant habit Pollen season
Start End Duration, day
Alnus AD Feb 3 Apr 8 65
Betula AD Mar 22 May 8 48
Juglans AD Apr 12 May 19 38
Morus AD Apr 18 May 22 35
Platanus AD Apr 8 May 20 43
2Populus
AD Feb 27 Apr 20 53
Quercus AD Apr 2 May 11 40
Tilia AD May 16 Jul 1 47
Ulmus AD Feb 6 Apr 8 62
Pinus AE Apr 25 Jun 8 45
Taxus AE Feb 13 Apr 15 62
2Ambrosia H Jul 15 Oct 15 93
Artemisia H Jul 18 Oct 9 84
Cannabis H Jun 6 Sep 3 90
Chenopodiaceae H Jun 22 Oct 11 112
Plantago H May 12 Aug 29 110
2
Poaceae H Apr 16 Oct 11 180
Rumex H May 13 Aug 12 92
2Urtica
H May 4 Sep 26 146
1
AD: arboreal deciduous, AE: arboreal evergreen, H: herbaceous.
2
were expressed as number of pollen grains ⋅m−3of air (Käpylä and Penttinen 1981; Peternel et al. 2006). The air sampler is located on top of the building of the Fac-ulty of Arts at the University of Szeged, approximately 20 m above the ground surface (Makra et al. 2010).
Time dependent daily pollen concentrations are influ-enced by numerous underlying processes. They include (1) genetic attributes, (2) soil type including location specific nutrient availability, (3) meteorological condi-tions in the root zone, (4) land use changes, (5) current and preceding weather variables, (6) the height of the planetary boundary layer (PBL) and the ventilation coef-ficient, (7) long-range pollen transport, (8) resuspenson of the pollen grains, (9) disruption of the pollen grains, and (10) pollen grains as condensation nuclei.
Though the above mentioned components can affect current pollen level, they are omitted and we analyse only (5), since our purpose is separating the effects of the current and past meteorological elements influen-cing the current pollen concentrations.
Nevertheless it should be mentioned that (2) indicates a definite weather dependence. Namely, plant growth and development largely depend on the combination and concentration of nutrients. Whilst, nutrient defi-ciency can have a significant impact on plant develop-ment, resulting in reduced plant quality or reduced pollen production. Nutrients are usually obtained from the soil through plant roots, but many factors like soil properties (chemistry, composition, compaction, humid-ity, temperature) and pH substantially influence the effi-ciency of nutrient acquisition (Forde and Lorenzo 2001; López-Bucio et al. 2003). The availability of certain nutrients for plants is largely weather dependent. From the above-mentioned soil parameters humidity and temperature are in direct, while the remaining compo-nents are in indirect association with climate variables.
Since some of the above parameters are either con-stant for a given taxon (1), or can be neglected (4), or not available (3, 6) or are hard to model (2, 8, 9) or diffi-cult to consider their effect when assessing the target variable (7, 10), they are omitted from further consider-ation. At the same time, daily values of the current and past weather variables [mean temperature, (T,°C); rela-tive humidity (RH,%), global solar flux (GSF, Wm−2) and precipitation amount (P, mm) influencing daily pollen concentrations were used in the study. They were col-lected in a meteorological station located in the inner city area of Szeged (Figure 1). These elements were used since they indicate the highest impact on pollen production (Galán et al. 2000; Bartková-Ščevková 2003; Štefaničet al. 2005; Kasprzyk 2008; Makra and Matyasovszky 2011).
The pollen season is defined by its start and end dates. For the start (end) of the season we used the first (last) date on which 1 pollen grain m−3of air is recorded and
at least 5 consecutive (preceding) days also show 1 or more pollen grains m−3(Galán et al. 2001). For a given pollen type, the longest pollen season during the 11-year period was considered for each year.
Daily values of mean temperature, relative humidity, global solar flux and precipitation amount were labelled as current meteorological conditions for the pollen sea-son of a given taxon, while they were considered as past meteorological conditions for the period starting from the first pollen-free day following the previous pollen season to the last pollen-free day preceding the actual pollen season.
Factor analysis with special transformation
The calculation procedure and main results are pre-sented in detail for Poaceae, because this species has the longest pollen season in Hungary and has big contribu-tion to the total annual pollen produccontribu-tion. In order to assess the effect of the antecedent and current meteoro-logical conditions on the current Poaceae pollen concen-tration, the 1st-day, 2nd-day, …, 180th-day values of both the pollen concentration and the four meteoro-logical elements of the current pollen season were taken. [The duration of the Poaceae pollen season in Szeged lasts from April 16 until October 12, namely 180 days. (Table 1)]. The values of these meteorological variables
were then cumulated for 186-day, 185-day, …, 1-day
periods starting 186 days, 185 days,…, 1 day before the actual day of the actual pollen season. This is because there are 186 days between the end of the previous-year pollen season and the beginning of the actual pollen season. Hence, 186 9-dimensional data sets were produced and a factor analysis with special transformation was performed for each of them (Figure 2). The altogether 5496 factor analyses carried out for all the 19 taxa re-sulted in 3 and 4 factors, except forArtemisia(2 factors) (Figures 2, 3, 4).
The reason of using factor analysis with special trans-formation is that this procedure makes possible to deter-mine the weight and the rank of importance of the individual variables influencing the target variable, namely the current daily pollen counts. At the same time, when using autocorrelation, time dependent associations with the target variable can be determined; however, the weight of the individual influencing variables in the current pollen counts cannot be specified.
Results
When analyzing the results, note that if the total weight of the factor loadings for the current climate variables is higher (lower), accordingly its effect is also higher (lower) than that of the past climate variables.
The curve of the total weights of the factor loadings for the current and past meteorological elements (Figures 2, 3, 4) were associated with the curve of the weights of the factor loadings for the current and past meteoro-logical elements (Figure 5). The purpose of this relation-ship was to detect the weight of the current/past effect of the climate parameters back in time having the high-est role in determining the current pollen counts.
ForAlnus,the weights of the past meteorological pa-rameters are somewhat higher with small variability compared to those of the current ones almost in the whole pollen-free season (Figure 3, 1st panel from above, left). For Ambrosia, the total weights of the factor loadings for the past meteorological variables are gradually increasing from the first pollen-free day
following the last Ambrosia pollen season until the
middle of March (Figure 3, 1st panel from above, right). ForArtemisia,the past meteorological elements have a much more important effect on pollen production almost in all the pollen-free period, especially between mid-April and mid-June (Figure 3, 2nd panel from above, left). For Betula, the effect of the past and current me-teorological elements is very similar in the preceding pollen-free season, except the period from August until the end of the autumn when the difference between the weights of the past and current meteorological parameters is the highest with the bigger weights of the past elements (Figure 3, 2nd panel from above, right). For Cannabis,
the past and current weather conditions have a balanced role, i.e. almost equal weights in the pollen-free period (Figure 3, 3rd panel from above, left). For Chenopodia-ceae family, after finishing the previous pollen season (October 11), the weights of the past meteorological elements are substantially higher than those of the current ones. Whilst, around two months before the current pollen season this difference vanishes (Figure 3, 3rd panel from above, right). For Juglans and Morus, with very similar curves, after finishing the previous pollen sea-son, the weight of current meteorological elements is higher reaching the maximum weight in early July, while afterwards the difference practically disappears (Figure 3, 4th panel from above, left and right). Pinus
andPlantagogenera are sensible especially for the current weather conditions (Figure 2, 1st panel from above). The past meteorological elements indicate the smallest effect on these taxa of all analyzed in the study. ForPlatanus,
the weights of the current meteorological elements exceed those of the past climate in the summer period (late May–early August), however their values are very similar to each other (Figure 2, 2nd panel from above, left). For For Poaceae the results are in agreement with our preliminary expectation. Namely, current climate has a higher importance close to the current pollen release; while back in time the role of both the past and current climate varies depending on periods (Figure 2,
2nd panel from above, right). Populus, the past
me-teorological elements have higher weights compared to the current climate parameters except 2–3 days before the start of the pollen season (Figure 2, 3rd panel from above, left). For Quercus, the weight of the current meteorological elements is much higher than that of the past climate parameters from May until mid-August.. However, in the remaining period these values are very similar (Figure 2, 3rd panel from above, right). ForRumex,only very small differences can be observed in the weights of the current and past meteorological elements in the pollen-free period preceding the current pollen season (Figure 2, 4th panel from above, left). For
Alnus
Ambrosia
Artemisia Betula
Cannabis Chenopodiaceae
Juglans Morus
Pinus Plantago
Platanus Poaceae
Populus Quercus
Rumex Taxus
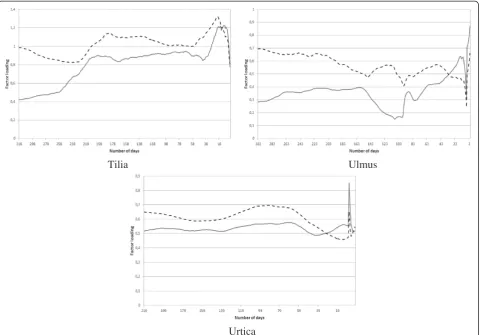
except for a few days before the start of the current pollen season in early February when the current me-teorological elements become dominant (Figure 2, 4th panel from above, right).Tilia seems to be more sensi-tive to the past weather conditions as the weights of the past meteorological elements is higher than those of the current ones except for several days before the start of pollen season when the current weather conditions be-come a bit more important (Figure 4, 1st panel from above, left). ForUlmus,again the major role of the past weather conditions can be identified except for a few days before the start of the current pollen season, when the weights of the current meteorological parameters exceed those of the past ones (Figure 4, 1st panel from above, right). The shape of the curves for Urticais the most equalized of all taxa, with very similar weights of the current and past meteorological elements (Figure 4, 2nd panel from above, left).
Discussion and conclusions
Climate change can modify the pollen season character-istics of different allergenic taxa in diverse ways and can
exert a substantial influence on habitat regions. To our knowledge, a comprehensive spectrum of the regional pollen flora has yet been analysed in three studies, namely in Clot (2003, 25 plant taxa), Damialis et al. (2007, 16 plant taxa) and Cristofori et al. (2010, 63 plant taxa), respectively. The present study analyses one of the largest spectra with 19 taxa. Our study can be considered unique in the sense that it separates the effects of the current and past meteorological elements that influence the current pollen concentrations.
Airborne pollen concentrations can be influenced not only by the current values of the meteorological ele-ments, but also by their past values. As it is hard to dis-tinguish between the effect of the current and past values of the meteorological variables no attempt has been made so far to determine the relative weight of these two components in influencing the measured current pollen concentration. In our present approach the current meteorological elements (the daily mean temperature, daily relative humidity, daily global solar flux and daily precipitation amount) were characterised by their actual values, while past meteorological elements
Tilia
Ulmus
Urtica
were described by their cumulative values. These elements were considered since they indicate the highest impact on pollen production (Galán et al. 2000; Bartková-Ščevková 2003; Štefanič et al. 2005; Kasprzyk 2008; Makra and Matyasovszky 2011). A potential importance of our pro-cedure is that a period with a changing climate that may have a major impact on the current pollen counts can be detected by the past of meteorological elements.
The taxa examined can be classified into three groups, namely arboreal deciduous (AD), arboreal evergreen (AE) and herbaceous (H) taxa. It was found that a better comparison can be established if the taxa are separated within each group according to the starting month of their pollen season. Within the group of AD taxa,Alnus, Populus and Ulmus are marked by a definitely higher weight of the past meteorological elements in late summer– early autumn, exceeding those of the current ones almost all over the pollen-free period. For Juglans, Morus, Platanus and Quercus, the major weights of the current meteorological elements in the spring and early summer involve the most characteristic contribution to
the pollen production. A few days before the start of the current pollen season the current weather conditions are predominant for all AD taxa (Figures 2, 3; Table 1). AE taxa comprise onlyPinusandTaxus, but their curves are totally reverse without any similarity (Figures 2, 3; Table 1). For H taxa, Poaceae is the only taxon starting its pollin-ation in April, so it is excluded from further analysis. Since the pollen season ofCannabisand Chenopodiaceae starts in early and late June, these taxa are listed into the groups pollinating from May and July, respectively. In this way, the curve of the taxa pollinating from May (Cannabis, Plantago, RumexandUrtica) indicate the most equalized course of weights in the study. For Cannabis, Plantago
andRumexthe effect of the current weather conditions is more important from the beginning of the pollen-free sea-son, while just before the start of the new pollen season the weights of the past climate elements are more remark-able (Figures 2, 3, 4; Tremark-able 1). Ambrosia, Artemisia and Chenopodiaceae comprise the highest weights of the past weather conditions of all taxa until at least three months before the start of the pollination that are
global solar flux
temperature
relative humidity
precipitation
characteristic in determining the pollen production. However, some days or weeks before the start of the current pollen season the current climate elements have a higher importance (Figure 3; Table 1).
We should remark that stored water in the soil is much more essential to genera dominated by trees like
Quercus, Platanus, Pinus, Morus, Juglans, Betula and
Alnus. In this way, autumn and winter precipitation in-come better influences their growth and pollen produc-tion potentials than for herbaceous plants.
Note, that our findings for assessing the effect of the antecedent and current meteorological conditions on the current pollen concentration are valid only for variations of the daily pollen concentrations accounted for by the above-mentioned eight explanatory variables and noth-ing is known about the variance portion not explained by these variables.
We should remark that factor analysis with special transformation can only be applied if it is assumed that the relationships between the variables are linear. The associations analysed in the study can be non-linear, hence our results are possibly distorted. However, our methodologies are capable of separating the joint effect of the current and past weather elements respectively and, in this way; the results received can be considered as a first step towards discovering these non-linear relationships.
It should be noted that only 11-year data sets were available that involve a limitation for the analysis. The difference between the factor loadings of daily pollen counts on the current and past values of daily meteoro-logical variables as a function of the day of the year was based on only 11-year data sets. Hence, the short data set constrains not to involve further influencing variables.
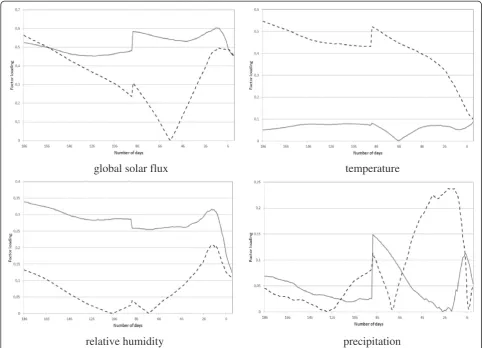
Phyto-physiological associations of the climate param-eters used are as follows. Global solar flux has a major direct effect on the photosynthetic processes, as well as an indirect effect on the plants development through the temperature parameters. The start and run of the photo-synthetic and generative processes occur in a limited range of temperature. In this way, extreme global solar flux involves too high or too low temperatures and, due to this, the available water may limit the vegetative and generative processes (see winter and summer periods) (Makra et al. 2011; Deák et al. 2013). Concerning the four climatic parameters, the current and past compo-nents of temperature and precipitation indicate a major effect on the current pollen concentration. Long-time effect of the precipitation is manifested in the storage of groundwater or in the stored water in the plants. Relative humidity is a largely variable parameter that has a rather small long-time effect on the current pollen production. An optimum relative humidity is necessary for the plants for performing generative and
vegetative (e.g. photosynthesis) processes smoothly. Rela-tive humidity has a major role only in dry climate con-ditions (see Mediterranean, deserts, steppes, savannas), where the limitation or lack of groundwater is substituted partly by relative humidity. However, these conditions are not typical in the temperate belt (Láng 1998; Haraszty 2004; Makra et al. 2011; Deák et al. 2013).Wind compo-nent, concerning the specific subject of the manuscript was omitted since its past values cannot be interpreted in the current pollen concentration. However, in general, wind sometimes has a substantial role in the measured local pollen counts. Depending the location of the source areas and wind direction, wind parameter can exert either positive or negative role on the local pollen level. Further-more, long-range and medium range components of the pollen transport can also be separated and for given locations, periods of the year and pollen type their ratio is an important characteristics of the local pollen statistics (Makra et al. 2010).
We should stress that papers comparing the weight of current and past weather parameters in influencing the current local pollen production are not available in the literature. Though there are some studies presenting the impact of past weather conditions on certain pheno-logical phases of different taxa (Spieksma et al. 1995; Giner et al. 1999; Emberlin et al. 2007, only few papers deal with this area. Additionally, no papers have been found demonstrating the influence of past meteorological elements on phenological phases of the 19 taxa analysed.
It is to be mentioned that not all possible influencing variables were considered and perhaps not the most influ-ential variables were used in the study. However, acknow-ledging the limiting factors mentioned above, this is the first approach to separate the weight of the current and past weather elements in determining the current local pollen production of herbaceous and arboreal taxa.
Separation of the weight of the current and past cli-mate conditions for different taxa presented in the study involves practical importance not only for pollen sensitized people but also for agricultural production. Namely, the knowledge of taxon specific effects of the past weather depending in time may help to predict future pollen levels well ahead in time; furthermore, it may contribute to reduce weather dependence of agri-cultural production.
Competing interests
The authors declare that they have no competing interests.
Authors’contributions
Acknowledgements
The authors would like to thank Miklós Juhász (University of Szeged) for providing daily pollen concentration data of Szeged. This research was supported by the European Union and the State of Hungary, co-financed by the European Social Fund in the framework of TÁMOP 4.2.4. A/2-11-1-2012-0001
‘National Excellence Program’.
Author details
1Department of Climatology and Landscape Ecology, University of Szeged,
P.O.B. 653, Szeged HU-6701, Hungary.2Department of Meteorology, Eötvös Loránd University, Pázmány Péter st. 1/A, Budapest HU-1117, Hungary.
3
Department of Physical Geography and Geoinformatics, University of Szeged, P.O.B. 653, Szeged HU-6701, Hungary.4Mathematical Institute of the
Hungarian Academy of Sciences, P.O.B. 127, Budapest HU-1364, Hungary.
Received: 24 February 2014 Accepted: 7 April 2014
References
Bartková-Ščevková J (2003) The influence of temperature, relative humidity and rainfall on the occurrence of pollen allergens (Betula, Poaceae, Ambrosia artemisiifolia) in the atmosphere of Bratislava (Slovakia). Int J Biometeorol 48:1–5
Clot B (2003) Trends in airborne pollen: an overview of 21 years of data in Neuchâtel (Switzerland). Aerobiologia 19:227–234
Clot B (2008) Recent changes in airborne pollen and allergy risk. Environ Risque Sante 7:431–434
Cristofori A, Cristofolini F, Gottardini E (2010) Twenty years of aerobiological monitoring in Trentino (Italy): assessment and evaluation of airborne pollen variability. Aerobiologia 26:253–261
D’Amato G (2011) Effects of climatic changes and urban air pollution on the rising trends of respiratory allergy and asthma. Multidiscip Respir M 6(1):28–37 Damialis A, Halley JM, Gioulekas D, Vokou D (2007) Long-term trends in
atmospheric pollen levels in the city of Thessaloniki, Greece. Atmos Environ 41:7011–7021
Deák JÁ (2010) Csongrád megye kistájainak élőhely-mintázata és tájökológiai szempontú értékelése. (Habitat-pattern and landscape ecological evaluation of the microregions of Csongrád country.), PhD Dissertation. University of Szeged, Hungarian, p 125
Deák JÁ, Makra L, Matyasovszky I, Csépe Z, Muladi B (2013) Climate sensitivity of allergenic taxa in Central Europe associated with new climate change–related forces. Sci Total Environ 442:36–47
Emberlin J, Smith M, Close R, Adams-Groom B (2007) Changes in the pollen seasons of the early flowering treesAlnusspp. andCorylusspp. in Worcester, United Kingdom, 1996–2005. Int J Biometeorol 51:181–191
Feehan J, Harley M, van Minnen J (2009) Climate change in Europe. 1. Impact on terrestrial ecosystems and biodiversity. A review (Reprinted). Agron Sustain Dev 29:409–421
Forde B, Lorenzo H (2001) The nutritional control of root development. Plant Soil 232:51–68
Galán CP, Alcázar P, Cariňanos H, Garcia E, Domínguez V (2000) Meteorological factors affecting daily Urticaceae pollen counts in southwest Spain. Int J Biometeorol 43:191–195
Galán C, Cariňanos P, García-Mozo H, Alcázar P, Domínguez-Vilches E (2001) Model for forecasting Olea europaea L. airborne pollen in South-West Andalusia, Spain. Int J Biometeorol 45:59–63
Giner MM, Garcia JSC, Selles JG (1999) Aerobiology of Artemisia airborne pollen in Murcia (SE Spain) and its relationship with weather variables: annual and intradiurnal variations for three different species. Wind vectors as a tool in determining pollen. Int J Biometeorol 43:51–63
Haraszty Á (2004) Növényszervezettan és növényélettan. (Plant Anatomy and Plant Physiology.). Nemzeti Tankönyvkiadó, Budapest
Hirst JM (1952) An automatic volumetric spore trap. Ann Appl Biol 39:257–265 Hjelmroos M, Burkhead T, Egen NB, Spangfort M, Schumacher MJ (1999) Effects
of automobile pollution and sunlight on variation of Bet v I content of birch pollen. J Allergy Clin Immun 103:S91–S91, Part 2, Meeting Abstract: 347 Jahn W, Vahle H (1968) Die Faktoranalyse und ihre Anwendung. (Factor Analysis
and its Application.). Verlag die Wirtschaft, Berlin (in German)
Jolliffe IT (1993) Principal component analysis: A beginner’s guide–II. Pitfalls, myths and extensions. Weather 48:246–253
Käpylä M, Penttinen A (1981) An evaluation of the microscopial counting methods of the tape in Hirst–Burkard pollen and spore trap. Grana 20:131–141
Kasprzyk I (2008) Non-native Ambrosia pollen in the atmosphere of Rzeszow (SE Poland): Evaluation of the effect of weather conditions on daily concentrations and starting dates of the pollen season. Int J Biometeorol 52:341–351
Köppen W (1931) Grundriss Der Klimakunde. (Outline of climate science.). Walter De Gruyter & Co, Berlin
Láng F (1998) Növényélettan. A növényi anyagcsere. (Plant physiology. Metabolism of plants.). ELTE Eötvös Kiadó, Budapest
Lindner M, Maroschek M, Netherer S, Kremer A, Barbati A, Garcia-Gonzalo J, Seidl R, Delzon S, Corona P, Kolström M, Lexer MJ, Marchetti M (2010) Climate change impacts, adaptive capacity, and vulnerability of European forest ecosystems. Forest Ecol Manag 259:698–709
Liu PWG (2009) Simulation of the daily average PM10 concentrations at Ta-Liao with Box-Jenkins time series models and multivariate analysis. Atmos Environ 43:2104–2113
López-Bucio J, Cruz-Ramírez A, Herrera-Estrella L (2003) The role of nutrient availability in regulating root architecture. Curr Opin Plant Biol 6:280–287 Makra L, Matyasovszky I (2011) Assessment of the daily ragweed pollen
concentration with previous-day meteorological variables using regression and quantile regression analysis for Szeged, Hungary. Aerobiologia 27:247–259 Makra L, Sánta T, Matyasovszky I, Damialis A, Karatzas K, Bergmann KC, Vokou D
(2010) Airborne pollen in three European cities: Detection of atmospheric circulation pathways by applying three-dimensional clustering of backward trajectories. J Geophys Res-Atmos 115:D24220. doi:10.1029/2010JD014743 Makra L, Matyasovszky I, Deák JÁ (2011) Trends in the characteristics of allergenic
pollen circulation in Central Europe based on the example of Szeged, Hungary. Atmos Environ 45:6010–6018
Motta AC, Marliere M, Peltre G, Sterenberg PA, Lacroix G (2006) Traffic-related air pollutants induce the release of allergen-containing cytoplasmic granules from grass pollen. Int Arch Allergy Imm 139:294–298
Parry ML, Canziani OF, Palutikof JP, van der Linden PJ, Hanson CE, IPCC (2007) Climate Change 2007. Impacts, Adaptation and Vulnerability. Contribution of Working Group II to the Fourth Assessment Report of the Intergovernmental Panel on Climate Change. Cambridge University Press, Cambridge, UK Peternel R,Čulig J, Hrga I, Hercog P (2006) Airborne ragweed (Ambrosia
artemisiifolia L.) pollen concentrations in Croatia, 2002–2004. Aerobiologia 22:161–168
Spieksma FTM, Emberlin JC, Hjelmroos M, Jäger S, Leuschner RM (1995) Atmospheric birch (betula) pollen in europe - trends and fluctuations in annual quantities and the starting dates of the seasons. Grana 34:51–57 ŠtefaničE, KovačevičV, LazaninŽ(2005) Airborne ragweed pollen concentration
in north-eastern Croatia and its relationship with meteorological parameters. Ann Agr Env Med 12:75–79
Ziska LH, Gebhard DE, Frenz DA, Faulkner S, Singer BD, Straka JG (2003) Cities as harbingers of climate change: Common ragweed, urbanization, and public health. J Allergy Clin Immun 111:290–295
Submit your manuscript to a
journal and benefi t from:
7Convenient online submission 7Rigorous peer review
7Immediate publication on acceptance 7Open access: articles freely available online 7High visibility within the fi eld
7Retaining the copyright to your article