O R I G I N A L A R T I C L E
Open Access
Carbohydrate metabolism and fertility
related genes high expression levels
promote heterosis in autotetraploid rice
harboring double neutral genes
Lin Chen
1,2,3†, Yun Yuan
1,2,3†, Jinwen Wu
1,2,3, Zhixiong Chen
2,3, Lan Wang
2,3, Muhammad Qasim Shahid
1,2,3*and
Xiangdong Liu
1,2,3*Abstract
Background:Autotetraploid rice hybrids have great potential to increase the production, but hybrid sterility is a major hindrance in the utilization of hybrid vigor in polyploid rice, which is mainly caused by pollen abortion. Our previous study showed that double pollen fertility neutral genes,Sa-nandSb-n, can overcome hybrid sterility in autotetraploid rice. Here, we used an autotetraploid rice line harboring double neutral genes to develop hybrids by crossing with auto- and neo-tetraploid rice, and evaluated heterosis and its underlying molecular mechanism. Results:All autotetraploid rice hybrids, which harbored double pollen fertility neutral genes,Sa-nandSb-n, displayed high seed setting and significant positive heterosis for yield and yield-related traits. Cytological observations revealed normal chromosome behaviors and higher frequency of bivalents in the hybrid than parents during meiosis. Transcriptome analysis revealed significantly higher expressions of important saccharides metabolism and starch synthase related genes, such asOsBEIIbandOsSSIIIa, in the grains of hybrid than parents. Furthermore, many meiosis-related and specific genes, includingDPWandCYP703A3, displayed up-regulation in the hybrid compared to a parent with low seed setting. Many non-additive genes were detected in the hybrid, and GO term of carbohydrate metabolic process was significantly enriched in all the transcriptome tissues except flag leaf (three days after flowering). Moreover, many differentially expressed genes (DEGs) were identified in the yield-related quantitative trait loci (QTLs) regions as possible candidate genes.
Conclusion:Our results revealed that increase in the number of bivalents improved the seed setting of hybrid harboring double pollen fertility neutral genes. Many important genes, including related and meiosis-specific genes and saccharides metabolism and starch synthase related genes, exhibited heterosis meiosis-specific expression patterns in polyploid rice during different development stages. The functional analysis of important genes will provide valuable information for molecular mechanisms of heterosis in polyploid rice.
Keywords:Neo-tetraploid rice, Hybrid vigor, Transcriptome, Chromosome, Sterility, Polyploidy
© The Author(s). 2019Open AccessThis article is distributed under the terms of the Creative Commons Attribution 4.0 International License (http://creativecommons.org/licenses/by/4.0/), which permits unrestricted use, distribution, and reproduction in any medium, provided you give appropriate credit to the original author(s) and the source, provide a link to the Creative Commons license, and indicate if changes were made.
* Correspondence:qasim@scau.edu.cn;xdliu@scau.edu.cn †Lin Chen and Yun Yuan contributed equally to this work. 1State Key Laboratory for Conservation and Utilization of Subtropical
Agro-Bioresources, South China Agricultural University, Guangzhou 510642, China
Background
Heterosis, or hybrid vigor, is a complex biological phenomenon, which is improved or superior phenotypic performance of hybrid in comparison to one or both par-ents, such as enhanced grain yield, stress tolerance and biomass production. Heterosis has been extensively ap-plied to increase the rice yield in the world (Cheng et al. 2007). However, productivity of rice has been stagnant in the past few years. Polyploid species play an important role in breeding programs, such as cotton (Flagel et al. 2008), wheat (Goncharov et al. 2007), and rapeseed (Albertin et al.2006). Rice polyploidization is an effective method to increase the size of rice genome and improve the wide adaptability (Cai et al.2001; Guo et al.2017).
The polyploid rice hybrids showed stronger biological advantage and yield potential compared with diploid rice hybrids, and has attracted the attention of many rice re-searchers (Shahid et al.2011; Wu et al.2013; Guo et al. 2017). However, autotetraploid rice has many unfavor-able traits, especially low seed setting, which limits its commercial utilization (Shahid et al.2010, 2013a; Wu et al.2014; Chen et al.2018a). Recently, our research team found that polyploidy enhanced pollen sterility loci in-teractions and increased chromosomal abnormalities in autotetraploid hybrid rice (Wu et al.2015), and also re-vealed that intersubspecific diploid and autotetraploid hybrid rice sterility could be overcome by double neutral genes (Shahid et al. 2013b; Wu et al. 2017). After years of efforts, our research group have developed few neo-tetraploid rice lines with high seed setting (> 80%) (Guo et al. 2016, 2017), and two new neo-tetraploid rice have been registered for the PVP (Protection for new var-ieties of plant) in China (Guo and Liu 2014). Moreover, neo-tetraploid rice could overcome the sterility and pro-duce high heterosis in autotetraploid hybrid rice (Guo et al. 2017). Two photoperiod- and thermo-sensitive genic male sterile lines (PS006 and PS012) of polyploid rice showed stronger hybrid vigor and great potential for im-proving rice quality and productivity (Zhang et al.2017).
Next generation high-throughput sequencing, such as RNA sequencing (RNA-seq) and microarray technology, is widely used to investigate gene expression and function. The RNA-seq enabled us to understand differentially expressed genes associated with abiotic stresses and pollen development in diploid rice (Jin et al.2013; Hu et al.2016; Fu et al.2017). The RNA-seq has also been applied to de-tect differentially expressed genes between diploid and auto-tetraploid rice during pollen development (Wu et al.2014; Chen et al. 2018a; Li et al. 2018). Furthermore, RNA-seq has been widely used to investigate heterosis in various plants, such as wheat (Liu et al. 2018), maize (Ma et al. 2018), rapeseed (Shen et al. 2017), tobacco (Tian et al. 2018) and rice (Wei et al.2009). The differentially expressed genes were found to be closely associated with heterosis in
super rice LYP9 and its parents through RNA-seq (Wei et al.2009). Later, many differentially expressed genes closely related to root heterosis at tillering and heading stage were detected in super hybrid XY9308 and its parents through RNA-seq (Zhai et al.2013). Chen et al. (2018b) compared the transcriptomes between super hybrid Wufengyou T025 (WFYT025) and its parents during young panicle develop-ment, and suggested that carotenoid biosynthesis and plant hormone signal transduction were enriched in differentially expressed genes, and these genes were related to the grain number heterosis. A number of genes associated with leaf, anthers and ovary heterosis in neo-tetraploid rice hybrids were identified by RNA-seq, which were related to photo-synthesis and metabolic process and transport (Guo et al. 2017).
Our previous study indicated that saccharide abnormal distribution and down-regulation of saccharide transport genes may cause pollen sterility and lead to low seed set-ting in autotetraploid rice (Chen et al. 2018a). In this study, to increase yield of autotetraploid rice, we used an autotetraploid rice line harboring double neutral genes for pollen fertility at Sa and Sbloci, which could over-come F1sterility when it crossed with low fertility
auto-tetraploid rice (Wu et al. 2017; Chen et al. 2018a). We thus primarily aimed to evaluate heterosis mechanism of neo-tetraploid and autotetraploid rice harboring double neutral genes, and to observe the role of chromosome configuration and behavior in heterosis and fertility. In addition, we detected differentially expressed genes between parents and hybrid in nine tissues at three de-velopment stages using RNA-seq, which would provide insights into the molecular mechanism underlying heter-osis in autotetraploid and neo-tetraploid rice, and pro-vide new germplasm for polyploid rice breeding.
Results
Heterosis evaluation of hybrids generated by crossing of autotetraploid with neo-tetraploid rice
Analysis of the agronomic traits of five hybrids, which were developed by crossing autotetraploid rice line (T449) with five neo-tetraploid rice lines, showed signifi-cant improvement in important yield-related traits, in-cluding number of filled grains per plant, yield per plant and seed setting. Evaluation of heterosis indicated that the values for mid-parent heterosis (MPH) were positive for all the traits except grain length and total grains per plant, and the highest MPH was found for grain yield per plant (170.89%). The high-parent heterosis (HPH) values were positive for the filled grains and grain yield per plant, and the highest HPH was detected for filled grains per plant (71.10%) (Additional file1: Table S1).
sac fertility (Fig.1; Table1and Additional file2: Table S2), although the maternal line, T449, had low pollen fertility and seed setting. The hybrid displayed significant positive MPH for all the traits, and the values for MPH were very high for filled grains per plant, grain yield per plant and seed setting (Table1). Meanwhile, the hybrid also showed posi-tive HPH values for most of the traits except effecposi-tive num-ber of panicles per plant, 1000-grain weight, and grain length and width (Table1).
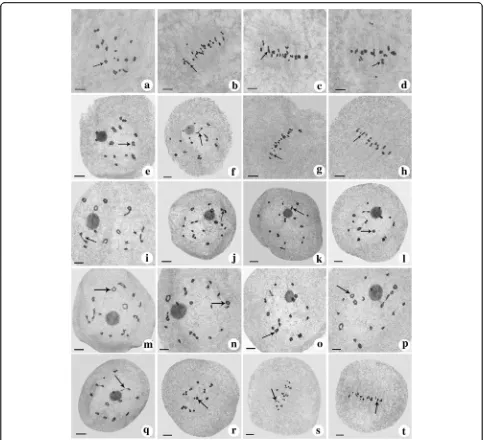
Chromosome configuration at diakinesis and metaphase I in F1hybrid compared to its parents
The tetravalent was the most type of chromosome con-figuration at diakinesis and metaphase I in the parents.
The numbers of bivalent chromosomes were higher in H1 (high seed setting) than T449 (low seed setting), and univalent type of chromosomes were higher in T449 than both H1 and F1(Table2, Fig.2). However, bivalent
chromosomes were the most frequent in F1 (Table 2),
and 9.07 and 12.57 bivalents were found in each pollen mother cell (PMC) at diakinesis and metaphase I, respectively. There were significant differences in the numbers of chromosome configurations between F1
hybrid and parents, and these results indicated that the increase of bivalent type may improve pollen fertility and seed setting. The chromosome configurations of tetravalent types were divided into five types, including ring shape (Fig.3a1-a4), chain shape (Fig.3b1-b4), frying
Fig. 1Comparisons of morphological characteristics between F1hybrid and its parents.aPlant appearance of F1, T449 and H1. Pollens of T449
(b), F1(c), and H1 (d), blue arrows indicate normal pollens, red arrows indicate abnormal pollens. Bar = 100μm. Embryo sacs of T449 (e), F1(f) and
pan shape (Fig. 3c1-c4), “X” shape (Fig. 3d1-d4) and “OK” shape (Fig. 3e1-e4). The frequency of ring shape was the most frequent chromosome configuration of tetravalent types at diakinesis and metaphase I (Table2).
Chromosome behavior during PMC meiosis in F1hybrid and its parents
Meiotic stages in hybrid were consistent with its par-ents, and could be divided into nine development stages, including prophase I (leptotene, zygotene, pachytene, diplotene, and diakinesis) (Additional file 3: Figure S1A-D), metaphase I (Additional file 3: Figure S1E), anaphase I (Additional file 3: Figure S1F), telo-phase I (Additional file 3: Figure S1G), prophase II (Additional file 3: Figure S1H), metaphase II (Add-itional file 3: Figure S1I), anaphase II (Additional file 3: Figure S1J), telophase II (Additional file 3: Figure S1K), and tetrad (Additional file 3: Figure S1L). The average frequency of normal chromosome behavior at metaphase I, anaphase I, telophase I, metaphase II, anaphase II, telophase II were remarkably higher in F1 and H1 than T449 (Table 3 and Additional file 5:
Table S3).
Differentially expressed genes in F1hybrid and parents
In order to investigate transcriptome changes in F1and
its parents, the transcriptome profiles of F1 and parents
were analyzed in nine tissues, including anthers (P1) and flag leaves (L1) at meiosis stage, and flag leaves (L2), leaf sheath (Z2), anther (P2) and embryo sac (E2) at pre-flowering stage, and flag leaves (L3), leaf sheath (Z3) and grain (P3) at three days after flowering (Add-itional file 4: Figure S2). In total, more than 3.7 billion clean reads were detected in different samples. We aligned clean reads against the Nipponbare reference genome (MSU 7.0), and 92.52% to 96.32% annotated transcripts of the reference genome was obtained in our materials (Additional file 6: Table S4). The correlation for the gene expression level from three biological repli-cates of each line was more than 0.8 (Additional file 7: Table S5), and principal component analysis (PCA) indi-cated that three biological replicates were clustered to-gether, and flag leaves and leaf sheath were also clustered together (Additional file8: Figure S3). The cor-relations between F1and its parents were investigated in
different samples by hierarchical cluster analysis using Cluster 3.0 software. The results demonstrated that F1
and its parents always assembled into primary groups at Table 1Heterosis analysis of hybrids generated by crossing of T449 and neo-tetraploid (H1) rice lines
Traits T449 H1 F1 MPH (%) HPH (%)
PH (cm) 87.40 ± 3.91 102.50 ± 3.09 116.44 ± 3.74 22.63 13.60
EP 4.40 ± 0.55 7.60 ± 1.34 6.60 ± 1.34 10.00 −13.16
GL (cm) 8.07 ± 0.11 8.92 ± 0.12 8.80 ± 0.16 3.59 −1.35
GW (cm) 2.71 ± 0.15 3.23 ± 0.05 3.10 ± 0.09 4.38 −4.02
TGW (g) 30.20 ± 0.89 36.85 ± 0.56 36.15 ± 0.41 7.83 −1.90
FGP 127.00 ± 31.89 421.20 ± 49.26 757.00 ± 166 176.18 79.72
TGP 612.00 ± 100.21 614.60 ± 134.33 907.80 ± 179.58 48.02 47.71
GYP (g) 3.83 ± 0.93 15.53 ± 1.90 27.32 ± 5.79 182.36 75.98
SS (%) 20.55 ± 2.63 69.75 ± 7.79 83.12 ± 2.83 84.10 19.17
PF (%) 35.10 ± 6.28 77.95 ± 2.26 77.01 ± 0.47 36.24 −1.21
Note: Fifteen plants were selected for traits investigations; HPH: High-parent heterosis; MPH: Mid-parent heterosis. PH: Plant height; EP: Effective number of panicles per plant; GL: Grain length; GW: Grain width; TGW: 1000-grain weight; FGP: Filled grains per plant; TGP: Total grains per plant; GYP: Grain yield per plant; SS: Seed setting; PF: Pollen fertility; ±: represents standard deviation
Table 2Meiotic chromosome configurations at diakinesis and metaphase I in F1hybrid and parents
Material Stage No. I II III IV
ring shape chain shape X shape frying pan shape OK shape Total
T449 Diakinesis 124 3.21 ± 2.87 5.73 ± 4.30 1.23 ± 1.50 2.91 ± 1.84 1.03 ± 1.04 2.13 ± 1.60 0.81 ± 1.03 0.52 ± 0.78 7.41 ± 2.02
Metaphase I 53 4.13 ± 3.15 5.36 ± 3.42 1.26 ± 1.30 3.06 ± 1.94 1.28 ± 1.23 2.08 ± 1.48 0.49 ± 0.72 0.43 ± 0.69 7.34 ± 2.23
H1 Diakinesis 135 0.59 ± 1.41 6.10 ± 3.91 1.28 ± 2.29 4.79 ± 2.20 0.44 ± 0.80 2.33 ± 1.93 0.15 ± 0.41 0.14 ± 0.37 7.84 ± 2.13
Metaphase I 53 2.51 ± 7.50 6.53 ± 4.52 0.92 ± 2.08 4.06 ± 2.28 0.43 ± 0.82 2.53 ± 1.85 0.17 ± 0.47 0.23 ± 0.42 7.42 ± 2.80
F1 Diakinesis 98 0.51 ± 1.52 9.07 ± 4.45 0.08 ± 0.31 4.42 ± 2.15 0.28 ± 0.53 2.30 ± 1.53 0.18 ± 0.54 0.09 ± 0.29 7.28 ± 2.28
Metaphase I 99 0.65 ± 1.19 12.57 ± 5.36 0.08 ± 0.27 1.95 ± 1.79 0.42 ± 0.72 2.76 ± 1.61 0.14 ± 0.53 0.21 ± 0.44 5.49 ± 2.65
the same tissue, and the transcriptome profiles of F1
were similar to H1, and these results were consist with the morphological and cytological observations (Add-itional file 9: Figure S4). A total of 12 DEGs were ran-domly selected for qRT-PCR validation. We compared the qRT-PCR results, and the expression trends were consistent with RNA-seq data, and a correlation
coefficient was R2= 0.8806 (Additional file 10: Figure S5), which demonstrated that RNA-seq data is reliable.
Identification of differentially expressed genes (DEGs) by RNA-Seq
The two filter conditions (false discovery rate (FDR) less than or equal to 0.05 and fold change (FC) higher than
Fig. 2Chromosome configuration at diakinesis and metaphase I.a-d, T449. E-H, H1. I-T, F1.a, 9IV (6 ring shape (arrow) + 1 OK shape + 2 X shape)
Fig. 3Classification of chromosome configuration. a1–a4 represent ring shape, b1–b4 represent chain shape, c1–c4 represent frying pan shape, d1–d4 represent“X”shape, e1–e4 represent“OK”shape
Table 3Frequency of normal chromosome behaviors during meiosis in hybrid and parents
T449 H1 F1
Stage Number of cells Normal (%) Number of cells Normal (%) Number of cells Normal (%)
Metaphase I 243 72.02 245 98.37 173 83.82
Anaphase I 106 61.32 141 94.33 83 87.95
Telophase I 170 77.06 215 99.53 144 96.53
Metaphase II 294 58.84 145 90.34 183 65.57
Anaphase II 139 23.02 50 44.00 75 32.00
Telophase II 249 67.07 179 94.41 129 92.25
or equal to 2) were applied to identify DEGs. Using these two filter conditions, we identified 781 to 3813 DEGs in different tissues between F1compared to its parents and
between two parents (Table 4). We defined DEGs between the hybrid and its parents as DEGFPand those
between the parental lines as DEGPP. The DEGFPcan be
divided into two categories, such as DEGC that were
shared by DEGPP and DEGFP, and another uniquely
be-longing to F1compared to parents, which were called as
DEGFPU. The DEGFPUmay relevant to phenotypic
differ-ences between F1 and its parents (Wei et al. 2009);
therefore, we specifically focused on the DEGFPUto
ex-plore genes associated with the heterosis in polyploid rice. A total of 984 DEGs belonging to 50 transcription factor (TF) families, including 188, 102, 95, 148, 92, 96, 56, 84 and 123 TFs, were found in the L1, L2, L3, P1, P2, P3, E2, Z2 and Z3, respectively. The TFs of bHLH, WRKY, WRKY, NAC, NAC, NAC, ERF, MADS and bHLH were mostly detected in L1, L2, L3, P1, P2, P3, E2, Z2 and Z3, respectively (Additional file 11: Figure S6). The gene ontology (GO) enrichment analysis was employed for the functional categorization of genes, and the results revealed that differential gene expressions might be associated with fertility and heterosis in flag leaf, leaf sheath, anther, embryo sac and grain. GO ana-lysis showed that a total of 68, 69, 79, 36, 4, 40, 16, 103 and 64 GO terms were significantly enriched in L1, L2, L3, P1, P2, P3, E2, Z2 and Z3, respectively. Interestingly, GO term of carbohydrate metabolic process was signifi-cantly enriched in all tissues (Fig.4and Additional file12: Table S6). To further understand the functions of DEGFPU, we classified these genes according to their
functional categories by KEGG pathway analysis, and the
results showed that DEGFPUwere mostly enriched in the
carbohydrate metabolism categories (Table5). A total of 79, 60, 37, 70, 27, 58, 33, 78 and 93 DEGFPU were
in-volved in the carbohydrate metabolism categories in L1, L2, L3, P1, P2, P3, E2, Z2 and Z3, respectively.
Gene expression patterns of DEGFPand non-additive genes (NAGs) in the hybrid
According to the gene expression levels in F1 hybrid
relative to its parents, the DEGFP were classified into
five groups, including higher than both parents (HBP), close to higher parent (CHP), between both parents (BBP), close to lower parent (CLP) and lower than both parents (LBP). Genes classified as HBP accounted for the majority of DEGFP in P1, CHP
accounted for the majority of DEGFP in L3 and P3,
CLP occupied the majority of DEGFP in the L1, L2,
P2, E2, Z2 and Z3, while the BBP and LBP groups accounted for the smallest number of genes in all tis-sues (Table 6). These results showed that most of the DEGFP were HBP, CHP and CLP in the hybrid, which
revealed that these genes would have an important role in the heterosis.
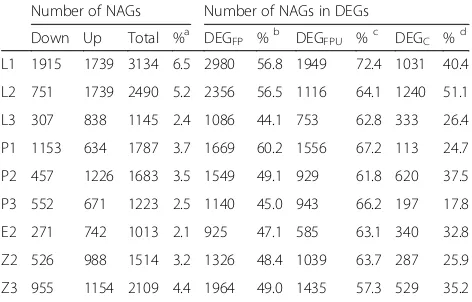
The number of NAGs (non-additive genes) in each sample were ranged from 1013 to 3134, and accounted for 2.1–6.5% of total genes, and 44.1–60.2% of DEGFP,
57.3–72.4% of DEGFPUand 17.8–51.1% DEGC in all
tis-sues (Table 7). GO analysis for NAG revealed that 102, 109, 110, 41, 34, 52, 37, 73 and 52 GO terms were sig-nificantly enriched in L1, L2, L3, P1, P2, P3, E2, Z2 and Z3, respectively. Interestingly, GO term of carbohydrate metabolic process was significantly enriched in all tissues except L3 (Additional file13: Table S7).
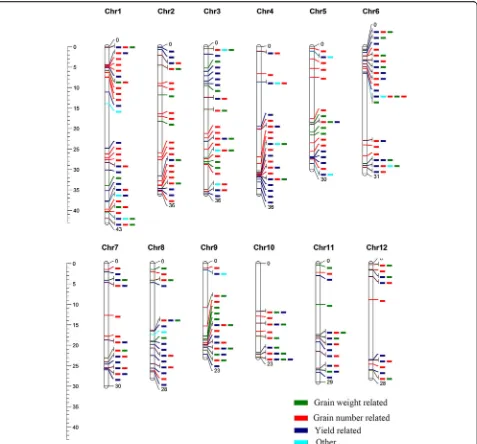
Mapping of DEGFPUin known yield-related quantitative trait loci (QTLs)
To understand the relationship between the observed DEGFPU and autotetraploid hybrid yield-related traits,
we explored DEGFPU in yield related QTLs. We
mapped all DEGFPU onto 1019 yield-related QTLs and
26 traits present in the rice Gramene database. Among them, 2610, 1674, 1164, 2235, 1448, 1374, 896, 1585 and 2432 DEGFPU were mapped onto yield-related
QTLs in L1, L2, L3, P1, P2, P3, E2, Z2 and Z3, respect-ively, and more than 95% of the DEGFPU were located
in yield-related QTLs (Additional file14: Figure S7 and Additional file 15: Figure S8). A total of 74, 221, 207, 267,199 and 42 QTL intervals contained 1~10, 11~50, 51~100, 101~ 200, 201~500 and more than 500 DEGFPU, respectively (Fig. 5 and S8B). The DEGFPU
were found in each yield-related QTLs expect 6 groups (Additional file 15: Figure S8C). Among DEGFPU
-re-lated QTLs, many QTLs are well characterized, includ-ing filled grain number (AQGH026, AQCB013, Table 4Number and classification of differentially expressed
genes (DEGs) in parents and F1hybrid harboring double neutral genes
Sample DEGPP T/F1 H/F1 DEGFPU DEGC DEGFP
L1 3813 3485 3041 2693 2549 5242
L2 3576 3264 1342 1740 2428 4168
L3 1886 1419 1402 1200 1261 2461
P1 1413 2054 1681 2314 457 2771
P2 2280 2556 1075 1504 1654 3158
P3 1866 1520 1561 1424 1109 2533
E2 1439 1479 781 927 1037 1964
Z2 1664 2051 1168 1631 1110 2741
Z3 2075 3051 1440 2505 1504 4009
AQCF042, AQGH009, etc.), panicle number (AQCQ008, AQCE001, AQDQ015, AQFF055, etc.), grain yield per plant (AQCQ022, AQDQ048, AQED049, AQDQ018, etc.) and spikelet number (AQAB057, AQEF001, AQGP054, AQAI017, etc.). Functional annotations of some DEGFPU can explain
the potential association between DEGFPU and QTL,
for example relationship between Starch synthase IIIa
(LOC_Os08g09230) and CQAS104 for yield, sucrose
synthase (LOC_Os03g22120) and AQED032 for grain number, and invertase gene (LOC_Os02g01590) and AQFJ064 for grain yield per plant. The above listed re-sults suggested that DEGFPUcan be correlated with
het-erosis in autotetraploid hybrid rice.
Differentially expressed anther specific genes were associated with meiosis stage-specific genes in F1 compared to its parents
T449 is an autotetraploid rice line with low fertility and H1 is a neo-tetraploid rice line with high fertility, so we specifically investigated meiosis-specific genes associated with high fertility. We compared expres-sion levels of genes between F1 vs T449 and H1 vs
T449, and 381 genes were found to be commonly up-regulated between both comparisons in anthers during meiosis (Additional file 16: Table S8). GO ana-lysis of these 381 genes showed that six biological process categories and nine molecular function cat-egories were significantly enriched (Additional file 17:
Fig. 4Gene ontology (GO) enrichment heat map for DEGFPUin 9 tissues (GO terms were selected based on their appearance at least in three
Table S9). We compared 381 up-regulated genes with microarray data of wild type rice anther meiosis stage-specific expression, and meiosis-related genes (Fujita et al. 2010; Tang et al. 2010; Deveshwar et al. 2011; Yant et al. 2013; Luo et al. 2014; Wright et al. 2015), and identified 4 meiosis-related genes including
LOC_Os09g32020 (OsDFR), LOC_Os01g68870 (MSP1)
and LOC_Os12g24420 and LOC_Os10g06770
(CDKG1), and 26 meiosis-specific expressed genes (Additional file 18: Table S10). Four pollen-related genes were identified from further analysis of 26 meiosis-specific expressed genes, including LOC_
Os03g07140 (DPW), LOC_Os04g24530 (OsACOS12),
LOC_Os06g40550 (OsABCG15; PDA1) and LOC_
Os08g03682 (CYP703A3).
Among 381 genes, 47 genes exhibited down-regulation in T449 compared to its diploid counterpart (E249) (Chen et al. 2018a) (Fig. 6a). Interestingly, two meiosis-related and 19 meiosis-specific genes were
identified in these genes (Additional file 19: Table S11), including LOC_Os09g32020 (OsDFR) and LOC_ Os12g24420 (CDKG1), and analysis of 19 meiosis-spe-cific genes revealed four pollen-related genes, including
LOC_Os03g07140 (DPW), LOC_Os04g24530 (
OsA-COS12), LOC_Os06g40550 (OsABCG15; PDA1) and
LOC_Os08g03682 (CYP703A3). We performed the pre-dicted protein-protein interactions of 47 genes using STRING v10, and the results showed that 17 genes constituted genetic sub-networks, including one meiosis-related and six meiosis-stage specific genes. The meiosis-related gene (OsDFR, LOC_Os09g32020) inter-acted with two meiosis-specific gene, including
LOC_Os08g03682 (CYP703A3), encodes cytochrome
P450 hydroxylase and LOC_Os04g24530 (OsACOS12), encodes acyl-CoA synthetase 12, which interacted with six differently expressed genes, including three cyto-chrome P450, two AMP-binding enzyme and a protein binding protein (Fig.6b).
Table 5Functional classification of DEGFPUin different tissues
Functional categories L1 L2 L3 P1 P2 P3 E2 Z2 Z3
Metabolism
Amino acid metabolism 61* 38* 28* 49** 18 33* 11 33 51
Biosynthesis of other secondary metabolites 55** 29* 18 31* 14 17 15** 30* 42
Carbohydrate metabolism 79 60* 37 70** 27 58** 33** 78* 93*
Energy metabolism 17 37* 18 20 18 21 12 47* 61**
Glycan biosynthesis and metabolism 4 2 2 8 4 2 1 4 9
Lipid metabolism 42 26 21 41** 18 24 4 30 37
Metabolism of cofactors and vitamins 20 31** 14 25* 7 12 6 22 22
Metabolism of other amino acids 31* 16 11 23* 9 11 7 30** 16
Metabolism of terpenoids and polyketides 26 21** 11 15 9 12 7 25** 29*
Nucleotide metabolism 23 10 5 7 5 7 4 6 20
Genetic Information Processing
Replication and repair 13 6 3 6 3 2 0 1 10
Transcription 17 6 8 11 8 13 2 6 18
Translation 79 10 10 27 25 27 7 37 124**
Folding, sorting and degradation 35 23 16 34 18 26 12 33 43
Environmental Information Processing
Signal transduction 52** 27 22* 19 10 19 15* 17 31
Membrane transport 2 1 1 2 0 2 0 3 2
Cellular Processes
Transport and catabolism 29 19 11 27 11 8 4 16 32
Organismal Systems
Environmental adaptation 50** 40** 26** 30 22** 10 11 23 32
Human Diseases
Endocrine and metabolic diseases 3 2 3 2 1 1 1 0 1
Co-expression network analysis of differentially expressed genes in different tissues by weighted gene
co-expression network analysis (WGCNA)
WGCNA, which is a systems biology tool, was used to understand the relationships and networks in a set of genes. In this study, WGCNA was constructed using RNA-seq data, and 28 WGCNA modules were identified (Fig. 7a, Additional file 20: Table S12). The gene numbers in these modules were ranged from 30 (MEwhite module) to 9294 (MEgrey module). Inter-estingly, the turquoise and grey modules consist of 67.72% of the genes in the network analysis. We
found that some modules showed correlation with the different tissues in F1 and parents (Fig. 7b), for
ex-ample, MEbrown module in leaf, MEblue module in mature anther, MEred module in mature embryo sac, and MEturquoise and MEgrey module in three tissues (anther, embryo sac and grain), which indicated that these modules may play putatively important roles in tetraploid rice leaf and reproductive organs. Further-more, a total of 1335 genes were involved in the MEbrown module, and GO enrichment analysis showed significant enriched terms that were related to photosynthesis light harvesting, light reaction, car-boxylic acid metabolic process and chlorophyll meta-bolic process. These results indicated that brown module genes may play an important role in the photosynthesis in tetraploid rice. In total, 9291 genes were involved in the MEturquoise module, and GO analysis revealed significant terms associated with DNA repair, carbohydrate metabolic process and transport, which indicated that MEturquoise module plays an important role in the fertility and yield of tetraploid rice (Additional file 21: Table S13).
Association between DNA sequence variations and differentially expressed genes in F1hybrid compared to parents
A total of 100,395,344 and 150,936,032 clean reads were obtained in T449 and H1 by using genome re-sequencing, respectively. Approximately 98.16% (T449) and 96.11% (H1) of clean reads were mapped onto the Nipponbare reference genome, and the reads coverage depths were 35× and 49× in T449 and H1, respectively (Additional file 22: Table S14). A total of 912,892 SNPs and 195,976 InDels were detected be-tween T449 and H1 by using the two filter conditions (coverage ≥10 and≤100, and removal of heterozygous SNPs and InDels). We found that about 5% of SNPs and 6% of InDels were detected in intergenic regions, and 60% SNPs and 65% InDels were identified in up or down regulatory regions, which might be related to the differentially expressed genes (Additional file 23: Table S15). Furthermore, we identified the genes vari-ations (SNP + InDel) in the DEGFPU, and found that
2044, 1297, 906, 1777, 1132, 1053, 707, 1232 and 1880 genes displayed variations between T449 and H1 in L1, L2, L3, P1, P2, P3, E2, Z2 and Z3, respectively (Additional file 24: Table S16). Of these genes, 53, 71, 79, 27, 3, 24, 18, 56 and 49 GO groups were signifi-cantly enriched in the L1, L2, L3, P1, P2, P3, E2, Z2 and Z3, respectively. Interestingly, GO term of carbo-hydrate metabolic process was significantly enriched in all tissues except L3 (Additional file 25: Table S17). These results were nearly consistent with the GO en-richment of DEGFPU.
Table 7Non-additive expressed genes (NAGs) in F1hybrid harboring double neutral genes
Number of NAGs Number of NAGs in DEGs
Down Up Total %a DEGFP %b DEGFPU %c DEGC %d
L1 1915 1739 3134 6.5 2980 56.8 1949 72.4 1031 40.4
L2 751 1739 2490 5.2 2356 56.5 1116 64.1 1240 51.1
L3 307 838 1145 2.4 1086 44.1 753 62.8 333 26.4
P1 1153 634 1787 3.7 1669 60.2 1556 67.2 113 24.7
P2 457 1226 1683 3.5 1549 49.1 929 61.8 620 37.5
P3 552 671 1223 2.5 1140 45.0 943 66.2 197 17.8
E2 271 742 1013 2.1 925 47.1 585 63.1 340 32.8
Z2 526 988 1514 3.2 1326 48.4 1039 63.7 287 25.9
Z3 955 1154 2109 4.4 1964 49.0 1435 57.3 529 35.2
Note: %a
denotes the percentage of NAGs in the total gene set (48,018), %b , %c, and %ddenote the percentages of NAGs in total number of DEGFP, DEGFPU and DEGC, respectively. L1 and P1 represent flag leaves and anthers at meiosis stage, respectively. L2, P2, E2 and Z2 represent flag leaves, anther, embryo sac and leaf sheath at pre-flowering stage, respectively. L3, P3 and Z3 represent flag leaves, grain and leaf sheath at three days after flowering, respectively
Table 6Number and classification of DEGFP
HBP a% CHP b% BBP c% CLP d% LBP e%
L1 1433 27.34 1418 27.05 215 4.10 1854 35.37 322 6.14
L2 357 8.57 1011 24.26 228 5.47 2228 53.45 344 8.25
L3 225 9.14 925 37.59 102 4.14 784 31.86 422 17.15
P1 1071 38.65 693 25.01 148 5.34 591 21.33 269 9.71
P2 363 11.49 843 26.69 237 7.50 1397 44.24 318 10.07
P3 543 21.44 785 30.99 135 5.33 741 29.25 329 12.99
E2 246 12.53 650 33.10 71 3.62 754 38.39 243 12.37
Z2 397 14.48 807 29.44 151 5.51 967 35.28 419 15.29
Z3 676 16.86 1156 28.84 132 3.29 1692 42.21 353 8.81
DEGFPwas classified into five groups according to their expression levels relative to both parental inbred lines. HBP, higher than both parents, CHP, close to high parent, BBP, between two parents, CLP, close to lower parent, LBP, lower than both parents. a% denotes the percentage of HBP in DEGFP, b% denotes the percentage of CHP in DEGFP, c% denotes the percentage of B2P in DEGFP, d% denotes the percentage of CLP in DEGFPand e% denotes the percentage of LBP in DEGFP. L1 and P1 represent flag leaves and anthers at meiosis stage, respectively. L2, P2, E2 and Z2 represent flag leaves, anther, embryo sac and leaf sheath at pre-flowering stage, respectively. L3, P3 and Z3 represent flag leaves, grain and leaf sheath at three days after
Expression patterns of saccharides metabolism and starch synthase related genes in the hybrid compared to parents
The GO and KEGG analyses of DEGFPUshowed that there
were significant differences for carbohydrate metabolic process in nine tissues between F1 and its parents, and
DEGFPUwere involved in sucrose synthase, cell wall
invert-ase, 6-phosphofructokininvert-ase, and hexokinase. Many sacchar-ide metabolic genes were up-regulated in the F1compared
to its parents in L1, P1 and P3 (Additional file 26: Table S18). Interestingly, the saccharide transporters were up-regulated in the F1 compared to its parents in L1, P1
and P3, and these results were consistent with saccharide
metabolic genes (Additional file 26: Table S18). The two saccharide transporter genes (LOC_Os02g10800 and
LOC_Os03g07480) were also up-regulated in F1compared
to both parents in P3 (Additional file 26: Table S18). In addition, the invertase (OsINV3andOsINV4), sucrose syn-thase (OsSUS3 and OsSUS4), hexokinase gene (OsHXK6), starch branching enzyme (OsBEIIb) and two starch syn-thase genes (OsSSIIIaandwx) displayed higher levels of ex-pressions in F1than parents in the grains (three days after
flowering) (Fig. 8a). Moreover, the promoter regions of
OsSUS3, OsBEIIb and OsSSIIIa also exhibited differences between maternal and paternal rice lines by re-sequencing (Fig.8b).
Fig. 5Distribution of DEGFPUmapped onto yield-related QTLs. QTLs in Gramene (number of harbored genes≤100) harboring DEGFPUwere
Discussion
High heterosis and the frequency of bivalents in F1 hybrid harboring double neutral genes
In the current study, the paternal line was high fertility neo-tetraploid rice and maternal line was autotetraploid rice harboring double neutral genes. The hybrid dis-played stronger heterosis for yield and yield-related traits, such as filled grains per plant, total grains per plant, grain yield per plant and seed setting. These re-sults were consistent with the previous studies, where autotetraploid hybrids exhibited high heterosis for filled grains per panicle, grain yield per plant and seed setting (Shahid et al. 2012; Guo et al. 2017). In addition, the pollen and embryo sac fertilities were investigated to
evaluate the fertility of hybrid and its parents. Our re-sults showed that the embryo sac fertility of hybrid and its parents was higher than 89%, and pollen fertility of hybrid and paternal line was high, while pollen fertility of maternal line was low. These results revealed that pollen fertility has a greater impact on seed setting than embryo sac fertility in autotetraploid rice hybrid and its parents.
It is well known that meiosis process has a great effect on plant reproductive development, and chromosome behavior and configuration play an important role in the plant meiosis and directly correlated with pollen fertility. The way of quadrivalent separation depends on chromosome configuration. Many quadrivalent
Fig. 6Gene expression levels of 47 genes and predicted protein-protein interaction network.a, The distribution of 47 genes exhibited up-regulation in F1
chromosomes were found in Triticum monococcum
during diakinesis and metaphase I (Kim and Kuspira 1993), while chain, ring and frying pan shapes were three main types of chromosome configurations in autotetraploid rice (Luan et al. 2007; He et al. 2011a). Ring, chain, frying pan, “X” and “OK” shapes were observed in the present study, and we have drawn these shape models based on the observation. The ring shape quadrivalent was found more frequently compared to other quadrivalent types in the present study. Our results were in agreement with the previ-ous studies, who also observed ring shape quadriva-lent in autotetraploid rice (Luan et al. 2007; He et al. 2011b). He et al. (2011b) revealed that high frequency
of bivalent was related to high pollen fertility and seed setting in autotetraploid rice hybrid. We also ob-served higher frequency of bivalents in the autotetra-ploid hybrid than parents at diakinesis and metaphase I. Chromosome behavior had a direct relationship with pollen fertility and seed setting in autotetraploid rice hybrids and interspecific hybrid between Bra-chiaria ruziziensis and B. brizantha (Adamowski et al. 2008; He et al. 2011b; Guo et al. 2016). Here, the fre-quency of normal chromosome behavior was signifi-cantly higher in the hybrid with high fertility than maternal line with double neutral genes.
It is worth to mention that the frequency of abnormal chromosome behavior is much higher during anaphase II
than other stages in this study. Here, many types of abnor-mal chromosome behaviors, including asynchronous meiocytes, abnormal spindles and straggling chromo-somes were observed at anaphase II (Additional file 5: Table S3). Of these abnormalities, asynchronous meio-cytes was the highest, and the frequencies of asynchron-ous meiocytes were 66.9%, 65.3% and 56.0% in T449, F1
and H1, respectively. We inferred that most of asynchron-ous meiocytes could develop normal tetrad according to their morphology, which might be the major reason for lower frequency of the normal cells at anaphase II than other phases.
The expression patterns of meiosis and meiosis-related genes promote high fertility in F1hybrid
A number of meiosis-related and meiosis-specific genes were detected in rice (Fujita et al.2010; Tang et al.2010; Deveshwar et al.2011; Yant et al.2013; Luo et al. 2014; Wright et al. 2015). A total of 55 meiosis-related or meiosis-stage-specific genes were found to be down-regulated, which increased pollen sterility loci in-teractions in autotetraploid rice hybrids (Wu et al. 2015). In the present study, the meiotic stages were
determined by the floret length and according to the ob-servation by 4′, 6-diamidino-2-phenylindole (DAPI) staining (He et al. 2011a). The DAPI staining could clearly distinguish between meiotic stages and other pollen development stages. For the proper understand-ing of meiosis-related and meiosis-specific genes between hybrid and parents, we dissected anthers from floret for RNA-seq analysis. A total of four meiosis-related and 26 meiosis-stage specific genes were identified, which were found to be up-regulated in hybrid and paternal line compared to maternal line. Interestingly, of the four meiosis-related and 26 meiosis-specific genes, two meiosis-related and 19 meiosis-specific genes were also found to be down-regulated in autotetraploid rice compared to dip-loid progenitors (Chen et al. 2018a). For example,DPW
gene encodes a fatty acyl ACP reductase, and was found to be essential for anther cuticle, pollen wall and pollen sporopollenin biosynthesis (Shi et al. 2011), and mater-nal and patermater-nal lines showed upstream and intron vari-ations in DPW gene. OsACOS12, which is an acyl-CoA synthetase, is essential for sporopollenin synthesis in rice (Li et al. 2016a; Yang et al. 2017), and maternal and
Fig. 8Predicted carbohydrate pathways in grains three days after flowering and related-gene variations in parents.aStarch pathway in grains of polyploid rice. The log2-transformed ratio between hybrid and parents was drawn by heatmap (F, F1hybrid; T449, maternal line; H1, paternal
paternal lines displayed downstream, upstream, intron and non-synonymous variations in OsACOS12. PDA1
encodes an ABC transporter (OsABCG15) and required for the transport of lipidic precursors for anther cuticle and pollen exine development (Zhao et al. 2015).
CYP703A3, cytochrome P450 hydroxylase, is involved in the tapetum degeneration retardation, a known pollen exine formation (Yang et al. 2014). The meiosis-related gene (LOC_Os12g24420) encoded cyclin-dependent kin-ase, which is homolog to CDGK1 in Arabidopsis, and
CDKG1protein kinase is crucial for synapsis and recom-bination in Arabidopsis during meiosis (Zheng et al. 2014), and we observed changes in the downstream and intron region ofCDKG1 in maternal and paternal lines.
These results suggested that the expression profiles of important meiosis-related or meiosis-specific genes have a significant effect on the fertility of polyploidy hybrid rice.
Dominance, non-additive and yield-related genes/QTLs contribute to heterosis
The DEGFPwere divided into five basic groups according
to their expression profiles, including over-dominance (HBP), under-dominance (LBP), dominance (CHP and CLP), and mid-parent (BBP) (Liu et al.2018). In our data, the dominance expression was the most prevalent class among DEGFP (46.34–77.71%). Similarly, the dominance
expression patterns were found to be the most abundant among DEGFPin wheat and rice hybrids by RNA-seq
ana-lysis (Zhai et al.2013; Liu et al.2018). These results indi-cated that dominance expression have a great effect on the performance of hybrids. According to gene expression levels of hybrid and its parents, the gene expression pro-files of F1could be divided into two types, the first type is
called as additive expression, which is contributed by each allele from its parents in a hybrid, and another is non-additive expression that differed from the mid-parent value (MPV) (Wei et al. 2009). In the previous study, whether or not a transcript shows non-additive expression is most likely to be affected by the contributions of
cis-andtrans-acting element of a gene (Zhang et al.2008). In this study, NAGs only accounted for 2.1–6.5% of the total expressed genes, but 57.3–72.4% of DEGFPU were NAGs
in each tissue. These results were consistent with diploid rice (Wei et al. 2009), wheat (Liu et al.2018) and maize heterosis (Swanson-Wagner et al. 2006), who also detected NAGs in F1. The previous studies have shown
that NAGs play vital roles in heterosis (Zhang et al.2008; Liu et al.2018), and NAGs were associated with circadian rhythm, flowering time, and panicle branching in rice (Li et al. 2016b). Overall less number of NAGs detected in this study, but major portion of DEGFPUwas constituted
of NAGs. Therefore, we speculated that NAGs play im-portant roles in high F1heterosis of polyploid rice.
The potential relationships between differently expressed genes and QTLs have been proposed in many yield-related QTL regions using RNA-seq (Zhai et al. 2013; Chen et al. 2018b). A recent study showed that nine genes (Hd3a, TAC1, Ghd8, Sd-1, NAL1, Hd1,
GW6a, IPA1 and DEP1) have a major impact on heter-osis in diploid hybrid rice (Huang et al. 2016). In our study,DEP1, which is related to rice panicle and located in SKPNB (spikelet number, AQBK037), was found to be up-regulated in grains (three days after flowering) of F1
hybrid compared to maternal line and also up-regulated in leaf of hybrid than parents during meiosis stage.
GW6a, which involved in grain-weight and located in TSDWT (1000-seed weight, AQEB012), revealed much higher expression in anthers of hybrid than parents dur-ing meiosis. The semi-dwarf gene (Sd-1), which is in-volved in biosynthesis of gibberellin and located in GRYLD (grain yield, AQQ005), exhibited higher levels of expressions in leaf sheath (three day after flowering) of hybrid than parents. Hd3a, which is related to rice flowering and regional adaptation, and located in FGRNB (filled grain number, AQCF008), was up-regulated in leaf (before flowering) of hybrid com-pared to parents. These results showed that these candi-date genes in QTL regions may contribute to heterosis in autotetraploid hybrid rice.
Saccharides metabolism and starch synthase related genes play an important role in heterosis
Carbohydrate metabolism plays an essential role in the plant growth and development. RNA-seq analysis showed that processes of carbohydrate metabolism are related to heterosis in rice (Wei et al. 2009; Zhai et al. 2013). In addition, our research group reported that abnormal dis-tribution of saccharides and saccharides-related genes may influence pollen fertility and cause decrease in the yield of autotetraploid rice (Chen et al.2018a). Here, the DEGFPU was significantly enriched in the carbohydrate
al. 2010). Here, the invertase (OsINV3and OsINV4) and sucrose synthase (OsSUS3andOsSUS4) were found to be up-regulated in the grains of hybrid compared to parents. After sucrose degradation, the resulting hexoses undergo phosphorylation by hexokinase for starch synthesis. Sub-sequently, hexokinase plays important role in hexose sig-naling and sensing (Cho et al.2009; Kim et al.2016). The hexokinase gene (OsHXK6) was up-regulated in grains (three after days flowering) of the hybrid compared to its parents. The starch synthase, starch debranching and starch branching enzyme have a great influence on the starch generation and metabolism (Zeeman et al. 2010). The starch branching enzyme (OsBEIIb) and two starch synthase (OsSSIIIa and wx) genes were up-regulated in the grains of hybrid compared to parents. In addition, we detected differences between maternal and paternal rice lines in the promoter regions of OsSUS3, OsBEIIb and
OsSSIIIaby re-sequencing. Consequently, the genetic ef-fects of OsSUS3, OsBEIIband OsSSIIIamay cause allelic heterozygosity in promoter regions of hybrid.
Sucrose and monosaccharide transporters are import-ant proteins for the translocation of saccharides from source to sink organs (Ruan et al. 2010). OsSUT1 pri-marily play a role in the transport pathway (Scofield et al. 2007). In our study, sucrose transporter (OsSUT1) displayed much higher expression patterns in the grain (three after days flowering) of hybrid than parents.
OsBT1, which encodes putatively ADP-glucose trans-porter and localizes in the amyloplast envelope mem-brane, plays a crucial role in starch synthesis (Cakir et al. 2016; Li et al. 2017a). We found that OsBT1 was up-regulated in the grain (three after days flowering) of hybrid compared to parents. Transcriptome profiling showed high expression levels of saccharides metabolism and starch synthase related genes in the hybrid, which might be an indication of enhanced source for sink tis-sues and resulted in high yield of hybrid.
In our previous studies, we found that the double neu-tral genes can overcome the hybrid sterility in autotetra-ploid rice (Wu et al. 2017), and detected specific differentially expressed genes associated with fertility and heterosis in neo-tetraploid rice by RNA-seq (Guo et al. 2017). Here, an autotetraploid rice line (T449), har-boring Sa-n and Sb-n double neutral genes for pollen sterility loci, was used to generate the hybrids by cross-ing with neo-tetraploid rice, and investigated the heter-osis and fertility by cytological and RNA-seq methods. We further want to understand the role of double neu-tral genes in heterosis and fertility of neo-tetraploid rice. Therefore, we observed chromosome behavior and gene expression patterns during important growth stages. The results showed that seed setting of F1 hybrid improved
with the increase in number of bivalents, and many important genes, including meiosis-related and
meiosis-specific genes and saccharides metabolism and starch synthase related genes, exhibited heterosis specific expression patterns in polyploid rice during different de-velopment stages.
Conclusions
In this study, we observed the chromosome behavior and configuration in hybrid and its parents, and found higher frequency of bivalent and normal chromosome behavior in hybrid than parents, which promoted high fertility (heterosis) in the hybrid harboring double neu-tral genes. Furthermore, we systematically investigated the global transcriptome of hybrid and its parents by RNA-seq. We obtained a large number of DEGFPU, and
detected substantial candidate genes, including meiosis-related and meiosis-specific genes, saccharides metabolism and starch synthase related genes, which were up-regulated in hybrid having improved fertility and yield. Our results provided new resource for poly-ploid rice breeding and exploring of these candidate genes will provide valuable information for revealing molecular mechanisms of heterosis in polyploidy rice.
Methods Rice material
An autotetraploid rice line, DN18-4x (T449), harboring
Sa-n and Sb-n double neutral genes for pollen sterility loci, was used to generate the hybrids by crossing with five neo-tetraploid rice lines, including Huaduo 1 (H1), Huaduo 2 (H2), Huaduo 3 (H3), Huaduo 4 (H4) and Huaduo 8 (H8). All the materials were planted at the ex-perimental farm of South China Agricultural University (SCAU) under natural conditions, and management practices followed the recommendations for the area.
Investigation of agronomic traits and data analysis
Agronomic traits, including plant height, effective num-ber of panicles per plant, grain length and width, 1000-grain weight, filled grains per plant, total grains per plant, grain yield per plant and seed setting, were in-vestigated. The standard for investigating these agro-nomic traits was according to the protocols of People’s Republic of China for the registration of a new plant var-iety DUS (Distinctness, Uniformity and Stability) test guidelines of rice (Guidelines for the DUS test in China, 2012) (Guo and Liu 2014; Guo et al. 2017). The mid-parent heterosis (MPH) and high-parent heterosis (HPH) were estimated by the following formula: MPH = (F1−MP)/MP × 100%, and HPH = (F1−HP)/HP ×
100%, where F1 related to the performance of hybrid,
Cytological observation
The chromosome configuration and behaviors were ob-served according to Wu et al. (2014). The inflorescences of F1and its parents lines were collected from the shoots
of rice plants with 0 to 4 cm between their flag leaf cush-ion and the second to last leaf cushcush-ion, and fixed in Carnoy’s solution (ethanol: acetic acid = 3:1) for 24 h, and the samples were stored in 70% ethanol at 4 °C after washing two times. The anther was removed from the floret and placed in a small drop of 1% acetocarmine on a glass slide. The glass slide was covered with a slide cover after 2–3 min, and observed under a microscope (Motic BA200).
The pollen fertility was observed according to Shahid et al. (2013b). The normal and abnormal pollens were observed by staining with 1% I2-KI under a microscope
(Motic BA200). The whole mount eosin B confocal laser scanning microscopy (WE-CLSM) was used to investi-gate the embryo sac fertility in F1and its parents
accord-ing to Li et al. (2017b) with minor modifications. The ovary was dissected from the floret, and was hydrated in 70%, 50%, 30%, 10% ethanol and distilled water for 30 min each. Then, the samples were dehydrated in 10%, 30%, 50%, 70%, 90% and 100% ethanol for 30 min after eosin B staining for 12 h. Finally, the samples were shifted into a mixture solution (ethanol and methyl cylate = 1:1) for 2 h, and then keep in pure methyl sali-cylate and observed under a laser scanning confocal microscope (Leica SPE).
RNA-seq experiments and data analysis
All samples were collected during meiosis, pre-flowering, and three days after flowering. The meiosis stage is a cru-cial event for the sexual reproduction of eukaryotes to form haploid spores and gametes (Luo et al. 2014). The pre-flowering stage is an important stage for pollen and embryo sac fertility. The carbohydrates are synthesized and transported into the grains in large quantity during grain filling stage (Itoh et al. 2005). The nutrients pro-duced by leaves are transported to other organs through the leaf sheath, so the leaf sheath has an important role in the transportation of energy. Flag leaf is one of the most important photosynthetic organs in rice and has an im-portant impact on crop yield and quality. In addition, pollen and embryo sac have a significant impact on rice fertility and yield (Shahid et al.2013b; Wu et al.2015; Li et al.2017b). Hence, we collected the nine tissues during these development stages from hybrid and its parents in three biological replicates, including anthers (P1) and flag leaves (L1) at meiosis stage, and flag leaves (L2), leaf sheath (Z2), anther (P2) and embryo sac (E2) at pre-flowering stage, and flag leaves (L3), leaf sheath (Z3) and grains (P3) at three days after flowering (Additional file4: Figure S2).
All tissues of hybrid and its parents were harvested in three biological replicates and immediately kept at−80 ° C for RNA extraction. The total RNA was extracted according to the manual instructions of the TRIzol Re-agent (Life technologies, California, USA). The library was prepared according to the vendor’s recommended protocol. The RNA-seq was performed on the Illumina HiSeq 4000 sequencing platform (LC Sceiences, USA). Using the Illumina paired-end RNA-seq approach, we sequenced the transcriptome that generated millions of paired-end reads. Low quality reads, including reads containing sequencing adaptors, reads containing se-quencing primer and nucleotides with quality score lower than 20, were removed. The mapped reads from each sample were assembled using StringTie, and all transcriptome samples were mixed to reconstruct a comprehensive transcriptome by perl scripts. After the generation of transcriptome, the StringTie and Ballgown were used to evaluate the gene expression levels. String-Tie was used to perform expression level for mRNAs by calculating FPKM (fragments per kilobase of transcript per million fragments mapped reads), and false discovery rate (FDR) was used to determine the threshold of the
P-value in multiple tests.
The Venny software was used to identify the overlapped differentially expressed genes in different samples (http:// bioinfogp.cnb.csic.es/tools/venny/index.html). Hierarch-ical analysis was carried out for all genes using Cluster 3.0 software after normalization. Transcription factor analysis was done according to transcription factor data (Jin et al. 2017). Gene Ontology (GO) enrichment analysis was employed for functional categorization by using AgriGO tool (http://systemsbiology.cau.edu.cn/agriGOv2/).
Expression patterns of differentially expressed genes (DEGs)
The expression patterns of DEGs were defined according to Liu et al. (2018). We defined the gene expression in F1as EF1, and genes expression of both parental lines as
ET449 and EH1.We defined the average value of both parental lines as MPV (mid-parental value). If the F1was
significantly (FDR≤0.05 and fold change ≥2) different from MPV, we defined these genes as non-additive genes (NAGs), if there was non-significant difference between F1and MPV, these genes were defined as additive genes.
Classification of DEGFPwas performed according to the
EF1 > ET449, then expression patterns of these genes were considered as between two parents (BBP); if EF1 = ET449 < EH1, or EF1 = EH1 < ET449, then expression patterns of these genes were considered as close to lower parent (CLP); if EF1 < ET449 = EH1, or EF1 < ET449 < EH1, or EF1 < EH1 < ET449, these genes were considered as lower than both parents (LBP).
Real-time qRT-PCR analysis
A total of 12 DEGs were randomly selected for valid-ation of RNA-Seq data by qRT-PCR. The gene-specific primers were designed using Primer Premier 5.0 soft-ware, and checked in the NCBI (National Center for Biotechnology Information) for specific primers (Add-itional file27: Table S19). Total RNA was taken from se-quenced samples, and the first-strand cDNA was synthesized using the Transcriptor cDNA Synth. Kit 1 (Roche) according to the manufacturer’s instructions. The qRT-PCR reaction procedure was 30 s at 95 °C, with 40 cycles of 95 °C denaturation for 10 s and 60 °C anneal-ing and extension for 30 s, and performed on the Light-cycler480 system (Roche). The genes relative expression levels were calculated using the 2-ΔΔCtmethod (Livak & Schmittgen 2001). All qRT-PCR reactions were per-formed in triplicate.
Mapping DEGFPUto rice QTLs and weighted gene co-expression network analysis (WGCNA)
Rice QTL data with physical positions on the MSU Rice Genome Annotation Project Release 6.1 were acquired from Gramene (Youens-Clark et al.2011). The DEGFPU
were mapped onto 1019 yield related QTLs and 26 yield-related traits using gene coordinates from the MSU Rice Genome Annotation Project. The gene co-expression networks were used WGCNA package in R (Langfelder & Horvath2008). To reduce noise, genes with total FPKM < 5 in 81 samples were removed. The modules were obtained using the automatic network construction with default settings.
Whole-genome re-sequencing analysis
The young leaves of T449 and H1 were collected and genomic DNA was extracted using a modified CTAB method (Cota-Sanchez et al. 2006). The process of genomic re-sequencing was performed on the Illu-mina Hiseq 2500 platform (Biomarker Technologies, Beijing, China). The procedure was performed accord-ing to the standard Illumina protocol (Bai et al. 2013). The generated FASTQ file quality was evalu-ated using FastQC ( http://www.bioinformatics.babra-ham.ac.uk/projects/fastqc/). The three filter conditions (reads with sequencing adapter, reads with more than 10% N content, reads with more than 50% low quality bases (< 10) were used to remove low-quality reads,
and then the high quality reads were mapped onto the Nipponbare reference genome using BWA soft-ware. The GATK software was used to identify SNPs and InDels, and the SnpEff software was used to an-notate the SNPs and InDels based on the Nipponbare reference genome.
Additional files
Additional file 1:Table S1.Heterosis analysis of hybrids generated by the crossing of T449 and neo-tetraploid rice lines. (DOCX 17 kb)
Additional file 2:Table S2.Embryo sac fertility of hybrid and parents. (DOCX 15 kb)
Additional file 3:Figure S1.Chromosome behavior of hybrid. (PPTX 504 kb)
Additional file 4:Figure S2.Collection of plant tissues for RNA-Seq dur-ing different development stages. (PPTX 79 kb)
Additional file 5:Table S3.Frequency of cells exhibiting abnormal chromosome behavior in pollen mother cells (PMC) during meiosis. (XLSX 11 kb)
Additional file 6:Table S4.Quality of RNA sequencing data and information of reads aligned to the Nipponbare reference genome. (XLSX 17 kb)
Additional file 7:Table S5.Correlation analysis between all tissues. (XLSX 96 kb)
Additional file 8:Figure S3.The principal component analysis (PCA) in the hybrid and its parents. (PPTX 199 kb)
Additional file 9:Figure S4.Hierarchical clustering analysis of all gene models based on expression data. (PPTX 557 kb)
Additional file 10:Figure S5.Comparison of the log2 (FC) of 12 selected transcripts using RNA-Seq and qRT-PCR. (PPTX 90 kb)
Additional file 11:Figure S6.The number of DEGFPUbelonging to
different transcription factor families detected in the hybrid and its parents. (PPTX 222 kb)
Additional file 12:Table S6.Gene ontology (GO) enrichment analysis for DEGFPUin nine tissues. (XLSX 39 kb)
Additional file 13:Table S7.Gene ontology (GO) enrichment analysis for NAGs in nine tissues. (XLSX 49 kb)
Additional file 14:Figure S7.Distribution of DEGFPUmapped in yield
and yield-related QTLs. (PPTX 1011 kb)
Additional file 15;Figure S8.Distribution of DEGFPUon yield-related
QTLs. (PPTX 241 kb)
Additional file 16:Table S8.Gene IDs of common up-regulated genes between F1vs T449 and H1 vs T449 in anther at meiosis stage. (XLSX 14
kb)
Additional file 17:Table S9.GO analysis of common up-regulated genes between F1vs T449 and H1 vs T449 in anther at meiosis stage.
(DOCX 17 kb)
Additional file 18:Table S10.Meiosis related and stage-specific genes detected in anther during meiosis. (XLSX 11 kb)
Additional file 19:Table S11.Up-regulated DEGs-sp in F1compared to
T449 were found to be overlapped with the down-regulated genes in T449 compared to E249 (diploid). (XLSX 11 kb)
Additional file 20:Table S12.List of WGCNA module genes. (XLSX 465 kb)
Additional file 21:Table S13.Gene ontology (GO) enrichment analysis of WGCNA module genes. (XLSX 76 kb)
Additional file 23:Table S15.Effect type annotation and distribution of SNPs and InDels in different genomic regions. (DOCX 18 kb)
Additional file 24:Table S16. Gene IDs of DEGFPUcombined with
variations between parents lines in nine tissues. (XLSX 153 kb)
Additional file 25:Table S17.Gene ontology (GO) enrichment analysis for DEGFPUcombined with gene variations between parental lines in the
nine tissues. (XLSX 33 kb)
Additional file 26:Table S18.The DEGFPUinvolved in saccharide
transporter and metabolism in the hybrid compared to parents. (XLSX 13 kb)
Additional file 27:Table S19.List of primers used for qRT-PCR. (DOCX 16 kb)
Acknowledgements
The authors thank Ms. Shuhong Yu and other lab members for assistance.
Funding
This work was supported by the National Natural Science Foundation of China (NSFC) to MQ Shahid (31850410472), the Guangzhou Science and Technology Key Program to XD Liu (201707020015) and the Natural Science Foundation of Guangdong Province of China to MQ Shahid
(2017A030313142).
Availability of data and materials
The RNA-seq and Re-sequencing data are available from the NCBI under the accession number PRJNA526133.
All data supporting the conclusions described here are provided in tables, figures, and additional files.
Authors’contributions
XDL and MSQ conceived and designed the experiments. LC, MQS and XDL wrote the paper. CL, YY, MQS, JWW, ZXC and WL performed the experiment and analyzed the data. All authors read and approved the final version of manuscript.
Ethics approval and consent to participate
Not applicable
Consent for publication
Not applicable
Competing interests
The authors declare that there are no conflicts of interest.
Publisher’s Note
Springer Nature remains neutral with regard to jurisdictional claims in published maps and institutional affiliations.
Author details
1State Key Laboratory for Conservation and Utilization of Subtropical
Agro-Bioresources, South China Agricultural University, Guangzhou 510642, China.2Guangdong Provincial Key Laboratory of Plant Molecular Breeding, South China Agricultural University, Guangzhou 510642, China.3College of Agriculture, South China Agricultural University, Guangzhou 510642, China.
Received: 11 January 2019 Accepted: 23 April 2019
References
Adamowski EDV, Pagliarini MS, Do Valle CB (2008) Meiotic behaviour in three interspecific three-way hybrids betweenBrachiaria ruziziensisandB. brizantha (Poaceae: Paniceae). J Genet 87:33–38
Albertin W, Balliau T, Brabant P, Chevre A, Eber F, Malosse C, Thiellement H (2006) Numerous and rapid nonstochastic modifications of gene products in newly synthesizedBrassica napusallotetraploids. Genet 173:1101–1113
Bai H, Cao Y, Quan J, Dong L, Li Z, Zhu Y, Zhu L, Dong Z, Li D (2013) Identifying the genome-wide sequence variations and developing new molecular
markers for genetics research by re-sequencing a landrace cultivar of foxtail millet. PLoS One 8:9
Cai DT, Yuan LP, Lu XG (2001) A new strategy of rice breeding in the 21st century II. Searching a new pathway of rice breeding by utilization of double heterosis of wide cross and polyploidization. Acta Agron Sin 27:110–116 Cakir B, Shiraishi S, Tuncel A, Matsusaka H, Satoh R, Singh S, Crofts N, Hosaka Y,
Fujita N, Hwang SK, Satoh H, Okita TW (2016) Analysis of the rice ADP-glucose transporter (OsBT1) indicates the presence of regulatory processes in the amyloplast stroma that control ADP-glucose flux into starch. Plant Physiol 170:1271–1283
Chen L, Bian J, Shi S, Yu J, Khanzada H, Wassan GM, Zhu C, Luo X, Tong S, Yang X, Peng X, Yong S, Yu Q, He X, Fu J, Chen X, Hu L, Ouyang L, He H (2018b) Genetic analysis for the grain number heterosis of a super-hybrid rice WFYT025 combination using RNA-Seq. Rice 11:37
Chen L, Shahid MQ, Wu J, Chen Z, Wang L, Liu X (2018a) Cytological and transcriptome analyses reveal abrupt gene expression for meiosis and saccharide metabolisms that associated with pollen abortion in autotetraploid rice. Mol Gen Genomics 293:1407
Cheng S, Zhuang J, Fan Y, Du J, Cao L (2007) Progress in research and development on hybrid rice: a super-domesticate in China. Ann Bot 100:959–966
Cho J, Ryoo N, Eom J, Lee D, Kim H, Jeong S, Lee Y, Kwon Y, Cho M, Bhoo SH, Hahn T, Park Y, Hwang I, Sheen J, Jeon J (2009) Role of the rice hexokinases OsHXK5andOsHXK6as glucose sensors. Plant Physiol 149:745–759 Cota-Sanchez JH, Remarchuk K, Ubayasena K (2006) Ready-to-use DNA extracted
with a CTAB method adapted for herbarium specimens and mucilaginous plant tissue. Plant Mol Biol Rep 24:161–167
Deveshwar P, Bovill WD, Sharma R, Able JA, Kapoor S (2011) Analysis of anther transcriptomes to identify genes contributing to meiosis and male gametophyte development in rice. BMC Plant Biol 11:78
Flagel L, Udall J, Nettleton D, Wendel J (2008) Duplicate gene expression in allopolyploidGossypiumreveals two temporally distinct phases of expression evolution. BMC Biol 6:16
Fu C, Wang F, Liu W, Liu D, Li J, Zhu M, Liao Y, Liu Z, Huang H, Zeng X, Ma X (2017) Transcriptomic analysis reveals new insights into high-temperature-dependent glume-unclosing in an elite rice male sterile line. Front Plant Sci 8:112 Fujita M, Horiuchi Y, Ueda Y, Mizuta Y, Kubo T, Yano K, Yamaki S, Tsuda K, Nagata
T, Niihama M, Kato H, Kikuchi S, Hamada K, Mochizuki T, Ishimizu T, Iwai H, Tsutsumi N, Kurata N (2010) Rice expression atlas in reproductive development. Plant Cell Physiol 51:2060–2081
Goncharov NP, Bannikova SV, Kawahara T (2007) Wheat artificial amphiploids involving theTriticum timopheeviigenome: their studies, preservation and reproduction. Genet Resour Crop Evol 54:1507–1516
Guo H, Liu X (2014) The research on autotetraploid rice. South China University of Technology Press, China, Guangzhou, pp 90–92
Guo H, Mendrikahy JN, Xie L, Deng J, Lu Z, Wu J, Li X, Shahid MQ, Liu X (2017) Transcriptome analysis of neo-tetraploid rice reveals specific differential gene expressions associated with fertility and heterosis. Sci Rep 7:40139 Guo H, Shahid MQ, Zhao J, Li Y, Wang L, Liu X (2016) Agronomic traits and
cytogenetic evaluation of newly developed autotetraploid rice line. Pak J Agr Sci 53:291–301
He J, Shahid MQ, Chen Z, Chen X, Liu X, Lu Y (2011a) Abnormal PMC microtubule distribution pattern and chromosome behavior resulted in low pollen fertility of an intersubspecific autotetraploid rice hybrid. Plant Syst Evol 291:257–265 He J, Shahid MQ, Li Y, Guo H, Cheng X, Liu X, Lu Y (2011b) Allelic interaction of
F1pollen sterility loci and abnormal chromosome behaviour caused pollen
sterility in intersubspecific autotetraploid rice hybrids. J Exp Bot 62:4433–4445 Hu J, Chen G, Zhang H, Qian Q, Ding Y (2016) Comparative transcript profiling of
alloplasmic male-sterile lines revealed altered gene expression related to pollen development in rice (Oryza sativaL.). BMC Plant biol 16:175 Huang X, Yang S, Gong J, Zhao Q, Feng Q, Zhan Q, Zhao Y, Li W, Cheng B, Xia J,
Chen N, Huang T, Zhang L, Fan D, Chen J, Zhou C, Lu Y, Weng Q, Han B (2016) Genomic architecture of heterosis for yield traits in rice. Nature 537: 629–633
Itoh J, Nonomura K, Ikeda K, Yamaki S, Inukai Y, Yamagishi H, Kitano H, Nagato Y (2005) Rice plant development: from zygote to spikelet. Plant Cell Physiol 46:23–47 Jin J, Tian F, Yang D, Meng Y, Kong L, Luo J, Gao G (2017) PlantTFDB 4.0: toward
a central hub for transcription factors and regulatory interactions in plants. Nucleic Acids Res 45:D1040–D1045