ORIGINAL ARTICLE DOI 10.1007/s10086-005-0741-8
Ragnar Jonsson
Increasing the competitiveness of wood in material substitution: a method
for assessing and prioritizing customer needs
Received: April 6, 2005 / Accepted: June 13, 2005 / Published online: February 5, 2006
R. Jonsson (*)
School of Technology and Design, Växjö University, SE-351 95 Växjö, Sweden
Tel. +46-470-70 81 48; Fax +46-470-76 85 40 e-mail: [email protected]
Abstract To increase the competitiveness of wood as a
building material requires knowledge of which customer needs require attention in terms of quality improvement and/or product development to best satisfy customers. Hence, information as to the impact on customer satisfac-tion of the fulfillment of different customer needs, as well as the performance of wood and substitutes in providing for these needs, is needed. This article suggests the use of cus-tomer satisfaction modeling (CSM) for assessing cuscus-tomer needs. The methodology is evaluated in the context of floorcovering. The results suggest that CSM is well suited for extracting the information necessary for prioritizing cus-tomer needs: importance/impact and performance data for attributes as well as for customer benefits. The study indi-cates the necessity of considering substitute materials not only for performance comparisons; substitutes may also re-veal otherwise latent customer needs. Practical, functional, benefits exert the greatest impact on customer satisfaction for wooden flooring as well as its closest substitutes, lami-nate and carpet. Hygiene and a low cost over the life cycle are apparently the customer benefits that require attention from wooden flooring manufacturers, because importance is high and performance relatively low.
Key words Wood · Building material · Customer
satisfac-tion · Floorcovering
Introduction
The end consumer, in the sense of the household, plays an essential role in the wood supply chain as the ultimate user and payer. The market for repair and remodeling is growing in importance.1
In contrast to the construction of new houses,
where the influence of architects and structural engineers in material selection is dominant,2
household assessments are generally more crucial in repair and cemodeling, thus further highlighting the importance of the end consumer.
A number of empirical studies have focused on the atti-tudes of architects and/or building contractors toward wood and substitute materials.1–3
The general attitude of end con-sumers toward wood as a building material has also been investigated,3
as well as the visual impressions and attitudes
toward wood.4
Still, little is known about end consumer choice of building material for specific purposes, referred to
as substitute competition by Ahlmark.5 An exploratory
study of substitute competition established important pre-dictors of application material preferences: where (in what usage context), why (salient evaluative criteria), and by whom (household characteristics) different floorcovering materials are used.6
However, besides this product position-ing, a comprehensive picture of the competitive situation of wood requires information regarding the impact on cus-tomer satisfaction of the fulfillment of different cuscus-tomer requirements or needs, as well as the performance of wood and relative substitutes, in providing for these needs. This information is necessary to determine which customer needs require attention in quality improvement and/or product development to best satisfy customers.
In this article, a methodology for measuring and priori-tizing customer needs is suggested. The influence and in-volvement of the end consumer seems to increase as one moves from the construction sector toward the design sec-tor, i.e., in the visible parts of the building.3
Floorcovering is a material application with a pronounced design profile, and the household typically makes the choice of floorcovering material. Thus, the methodology is evaluated in the context of floorcovering.
Theoretical frame of reference and implementation
high and product performance is low. Performance com-parisons should be between competitors, in this instance substitute materials. Consideration of substitute materials could also identify latent customer needs.7
The consump-tion context prescribes benefits that the alternatives in ques-tion must meet.8
Hence, the usage context, i.e., the situation in which a product will be used, is instrumental in defining the alternatives to be actively considered, because it acts as an environmental constraint defining consumers’ needs or goals, thus limiting the nature of means (products) that can achieve those goals, i.e., supply the desired benefits.9
Conse-quently, substitutes are material alternatives sharing the same usage context. Investigations of importance weights and performance as to customer needs thus need to relate to a specific building application and usage context, in this instance floorcovering and the type of room considered for reflooring. Thus, prior to measuring and prioritizing cus-tomer needs, it is necessary to establish where (in what usage context) and why (salient evaluative criteria) the ap-plication materials under study are used.
In across-category consideration, several product cat-egories are effective substitutes.7
A number of studies have demonstrated that across-category choices differ from brand-level choices. Research results indicate that compari-sons occur at more abstract levels when the alternatives
are less (physically) comparable (e.g., see Corfman,10
Johnson11
). Thus, there is more than one way to create a given benefit.12
This is imperative to acknowledge when it comes to comparing different building application materi-als, with alternatives differing as to physical characteristics. The comparison level has another dimension, related to the customer category investigated. Applications of the quality improvement method “quality function deployment” (QFD), although referring to customer input, the “voice of the customer,” as customer needs, are generally based on rather concrete product attributes.13
This level of customer input is perhaps justified for industrial customers, but is less so in the case of end consumers, the primary drivers of customer satisfaction, i.e., the overall evaluation of the
pur-chase and consumption experience,14
in this instance is de-termined by the benefits.15
Furthermore, firms focusing on root needs, i.e., benefits or consequences, can develop to-tally new markets.16
In all, when assessing customer needs in an end-consumer context, the paradigm of the means–end theory should apply: the attributes of a product provide customers with certain benefits or consequences, which, in turn, satisfy customer needs. Products perceived as substitutable are presumed to deliver similar benefits.12
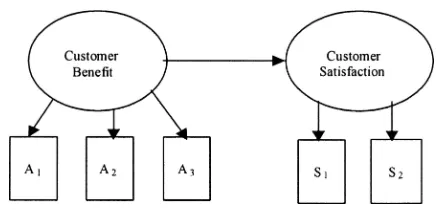
Hence, the approach for measuring and prioritizing customer needs should allow analysis on the benefit – as well as the attribute – level. The quality improvement method “customer satisfaction model-ing” (CSM), in linking inherently abstract or latent vari-ables (LVs) such as customer benefits and satisfaction with concrete measures or manifest variables (MVs), meets this demand.17
The aim of CSM is to provide information on how to increase customer satisfaction effectively. In CSM, meaning is ascribed to the LVs, benefits, and satisfaction in two ways. The first is through the MVs, i.e., the LVs are
measured indirectly using multiple concrete proxies:15
cus-tomer ratings on attributes (A1, A2 and A3 in Fig. 1) and,
e.g., customer ratings of overall satisfaction and satisfaction relative to expectations (S1 and S2 in Fig. 1). Furthermore,
through the relation between benefits and satisfaction as stipulated by substantiated theory,18 i.e., as a benefit im-proves, satisfaction should improve.
Materials and methods
Phase 1. Where and why
The data as to where (in what usage context) and why (salient evaluative criteria) different floorcovering materi-als are used emanates from an exploratory study of the
Dutch floorcovering market presented in Jonsson.6
The de-scription of the methodology in this respect is somewhat abridged here.
Data
Respondents were selected so as to comply with Ajzen and Fishbein’s19
“theory of reasoned action,” which is based on an individual’s intentions being more reliable determinants of behavior than attitudes, and with the requirement of phenomenology that questions should generate descrip-tions of lived experience (e.g., see Thompson et al.20
). For the purpose at hand it was prudent to select households that were actively engaged in reflooring of their homes or had refloored in the near past. Consequently, customers at out-lets for different types of floorcovering in the Netherlands were interviewed.
Evaluative criteria were obtained through open-ended interview questions concerning reasons for choosing the material(s) in question (planned refloorings and/or refloorings undertaken the last 5 years): “What made you choose this particular type of floorcovering material(s)?”/ “What makes you choose this type of floorcovering material(s)?” The motive for using this idiographic ap-proach was that little is known about the phenomenon a priori.21,22
The aspect of usage context of importance in this instance is the type of room(s) considered for reflooring. Again, open-ended interview questions were used. The in-terviews included a probing question to clarify what type of wooden flooring was intended, which was used whenever a
respondent answered “wood” when asked what material he, or she, had used/were planning to use. No specimens were presented, because explanation of floorcovering material preferences in general was the scope of the study. Present-ing specimens would bias the investigation in favor of visual impressions and attitudes.6
Data analysis
Statistical processing of data from open-ended interview questions necessitates interpretative analysis to derive vari-ables. Criteria applied (18 variables) and types of room considered for reflooring (11 variables) were retrieved di-rectly from respondents (so-called in vivo categories). The variables were binary (1 for presence, 0 for absence of the variables in question). Extracting decisive predictors of material preferences in this instance calls for statistical methods of analysis capable of handling binary variables as well as collinear data resulting from contextual influences. Multivariate projection methods cope with many variables and few observations as well as highly collinear variables.23
Furthermore, multivariate projection methods are able to handle binary variables. Partial least square discriminant analysis (PLS-DA) is a multivariate method of analysis that explicitly takes into account the class membership of obser-vations, i.e., the preferred materials in this instance, in the problem formulation. By studying PLS-DA regression coef-ficients it is possible to determine why and where specific floorcovering materials are used. Hence, PLS-DA was con-ducted in order to extract the most decisive causal condi-tions for material preferences.
Phase 2. Attributes and benefits: importance and performance
Data
Respondents for this second phase of interviews were
se-lected mianly for theoretical reasons24
: questions should generate descriptions of lived experience.20 For the purpose at hand, it is prudent to select respondents with experience of the floorcovering materials in question: only those cus-tomers who had installed the floorcoverings in question in the last 5 years were interviewed. Interviews took place at outlets for different types of floorcovering in the Nether-lands. The total number of interviews was 100: 27 wood users (15 solid and 12 engineered wood users respectively), 47 laminated flooring (laminate) users, and 26 textile floor-ing (carpet) users.
Respondents were asked to rate the performance of the floorcoverings in question on attributes (using a 1 to 7 Likert-type scale, from 1= not at all to 7= to a high degree), and assess their satisfaction using ratings of overall satisfac-tion and satisfacsatisfac-tion relative to expectasatisfac-tions (again using a 1 to 7 Likert-type scale, from 1= not at all to 7= highly satisfied). For respondents with experience of wooden flooring, the questionnaire included a question as to the type of wooden flooring: solid or engineered wood.
Data analysis
CSM makes a distinction between observable and latent variables. Benefits, being LVs, need to be assigned MVs to
acquire meaning.15 The approach suggested here is
deduc-tive in that it takes benefits as the starting point and pro-poses or implies observable measures, i.e., attributes.17
In contrast, when attributes are cited as evaluative criteria the benefits, which these attributes reflect, need to be derived. Factor analysis is useful in this instance. By looking at what variables have large loadings for a particular factor, as-sumptions regarding the relation of MVs and LVs can be evaluated. Principal components analysis (PCA), in coping with many variables and few observations as well as col-linear variables,23
is a favorable method of factor extraction in this instance.
The relationships illustrated in Fig. 1 are estimated statistically in CSM. There are two common methods for estimating this type of model: partial least squares (PLS) and covariance structure models like linear structural relationships (LISREL).25 PLS is especially well suited to satisfaction modeling, because, being prediction oriented,
it attempts to explain the ultimate dependent variable.18
Furthermore, PLS copes with small samples, and does not impose distributional assumptions on the data,26 which is an attractive feature with satisfaction data being typically skewed.27
PLS estimation renders possible the simultaneous evaluation of the measurement and structural portions of
the model.17 The LVs are easily measured as weighted
lin-ear aggregates of their respective MVs.15
Hence, CSM, us-ing PLS, is conducted to extract the information necessary for prioritizing benefits and attributes: importance and per-formance data.
Performance information is provided for each level in the model. Performance information for the LVs, i.e., satis-faction and benefits, are calculated as weighted indices of their respective MV ratings.17 Being directly observable, performance information for the attributes is provided by respective survey ratings. Importance is estimated as the impact of a given set of variables on variables at the next level in the customer satisfaction model.17 Variation in per-formance on attributes across respondents allows estima-tion of the impact that an increase in a satisfacestima-tion driver has on customer satisfaction.15
Importance information is provided at benefit level through the path coefficients, which, as in regression analysis, are interpreted as impact scores, and at attribute level using MV loadings and weights.17
Loadings are the correlation of the individual
MVs to the LV indices of which they are a part.17 The
weights, i.e., the values given to a collection of MVs when calculating an LV index, are the loadings after scaling to make the variance of LVs equal to one.18
Attribute weights provide a more meaningful and diagnostic basis for priority setting than loadings.17
to measure a particular LV have relatively uniform weights. The theoretical or LV relationships are judged using two criteria: whether the estimated impact scores are significant and in the predicted directions, and the amount of variation explained in the endogenous construct (see Fornell and Cha18
for a detailed description of the PLS methodology). The reasons voiced for choosing a specific floorcovering material extracted in phase 1 are typically those benefits and attributes salient for the floorcovering alternative in question. However, one should not automatically assume that other customer needs, cited as a reason for choosing substitutes, are of no importance for those using wood. Rather, by considering these latent needs new mar-ket opportunities may develop. Hence, in acquiring impor-tance and performance information, customer needs cited for choosing substitutes (floorcoverings frequently used in the same type of room(s) in this instance) ought to be included.
Results
Where and why
There was no discernible difference in consumer assess-ment between the different types of wooden flooring in the phase 1 interviews; therefore, these responses were treated as one class: wood. Furthermore, as respondents were un-able to specify the kind of printed wood overlay in instances of laminated flooring preference (in all instances where laminate was the preferred floorcovering, it was of the printed wood overlay type), laminated flooring constitutes one class: laminate. No distinction was made between planned and undertaken refloorings. This is justified by the concern to attain as many instances of the phenomenon as possible. Besides, nothing in the results seems to indicate
any systematic difference between the two categories.6
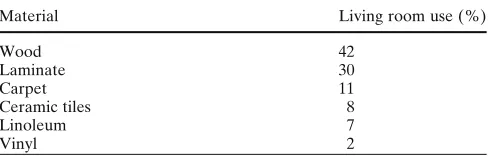
Wood has a comparative advantage as a floorcovering in living rooms.6
Other floorcovering materials frequently used in living rooms are textile flooring (henceforth carpet) and laminate (see Table 1). Hence, carpet and laminate are apparently the main substitutes for wood.
Table 2 displays what was found to be decisive (salient) evaluative criteria for wood, laminate, and carpet prefer-ences, respectively, in Jonsson.6
The evaluative criteria include benefits/consequences: Esthetics, Hygiene, DIY (suitable for do-it-yourself), as well as more concrete at-tributes: Good (favorable) price, Warmth, Softness,
Sound-absorbing, Natural material, Wood feeling.
The relation of attributes and benefits
The closest competitors of wooden flooring are apparently laminate and carpet. The materials analyzed were thus wooden flooring, laminate, and carpet. When the aim is to disclose which customer needs are the prime drivers of satisfaction, this rather aggregated level of analysis as to the types of floorcovering is justified.
The interview transcripts as to evaluative criteria in the phase 1 interviews suggest two aspects (MVs) of Hygiene:
Easy cleaning and Not getting filthy easily. Hence, these
MVs are assumed to reflect the benefit Hygiene. The benefit
DIY is linked to perceived ease of installation, and is
as-sumed to be reflected in the attributes (MVs) Pieces fit
together easily and Clear installation instructions. Esthetic
considerations voiced in connection with wood and lami-nate refer to the “wood properties”; the MV suggested a priori in this instance is Authentic wood appearance. For carpet, the attribute reflecting Esthetics is assumed to be
Nice color and pattern. As for the attributes cited as
evalu-ative criteria, Good price (initial cost) and Durable (an aspect of recurring costs) can be seen as providing a benefit suitably termed Low life cycle cost (henceforth LLCC).
Durable was found to be a salient criterion for ceramic tiles
preference only,6
but is of such (potential) importance as to merit inclusion in the analysis here. Sound-absorbing is hy-pothesized to reflect the benefit Nice atmosphere, whereas
Softness, Warmth, and Wood feeling, all being tactile
phe-nomena, are assumed to provide the benefit Nice underfoot.
Natural material could reflect either of Nice underfoot, Nice atmosphere, or Esthetics.
The initial PCA conducted on the data from respondents with experience of wooden flooring (solid and engineered flooring, 27 observations in all) included the attributes
Warmth, Wood feeling, Sound-absorbing, Natural material, Authentic wood appearance, Good price, Durable, Easy cleaning, and Not getting filthy easily, as well as the average
of overall satisfaction and satisfaction relative to expecta-tions, termed Satisfaction average. Pieces fit together easily and Clear installation instructions had to be excluded in this instance, as there were only six respondents who had installed the wooden flooring themselves (only those who had installed the floorcovering in question themselves were asked to rate it on these two attributes). Furthermore,
Softness, being closely connected with the intrinsic nature of Table 1. Where: living room use for each material
Material Living room use (%)
Wood 42
Laminate 30
Carpet 11
Ceramic tiles 8
Linoleum 7
Vinyl 2
Table 2. Why: salient evaluative criteria
Laminate Carpet Wood
Esthetics Warmth Esthetics
Good price Softness Natural material
DIY Esthetics Wood feeling
Hygiene Sound-absorbing
carpet, was not included. In the initial PCA, with five com-ponents (corresponding to the number of assumed ben-efits), each of the MVs associated with only one factor, i.e., had a single high loading, except Authentic wood
appear-ance which did not load significantly on any of the
compo-nents extracted (The two highest loadings for this variable were 0.52 and 0.57 respectively. A loading of at least 0.7 is required for accounting for at least 50% of the variable’s total variance). Due to this circumstance, and the fact that
Authentic wood appearance had the lowest communality, it
was deleted from the final PCA (see Hair et al.28
for a detailed account of how to interpret component matrices and respecify factor models). The final PCA was conse-quently conducted with four components, accounting for 83% of the variance.
Judging by the pattern of component loadings in Table 3, attributes Good price and Durable, having high loadings on the first component, plausibly constitute good reflections of
LLCC. These attributes are also the ones most strongly
associated with Satisfaction average. Easy cleaning and Not
getting filthy easily indeed reflect the benefit Hygiene,
be-cause they both show high loadings on the second
compo-nent. MVs Sound-absorbing and Natural material, both ex-hibiting high loadings on the third component, apparently reflect the same benefit, termed Nice atmosphere. Warmth and Wood feeling finally, loading high on the fourth compo-nent, are apparently proper reflections of the benefit Nice
underfoot in this instance (Wood feeling is a borderline case
with regard to significance).
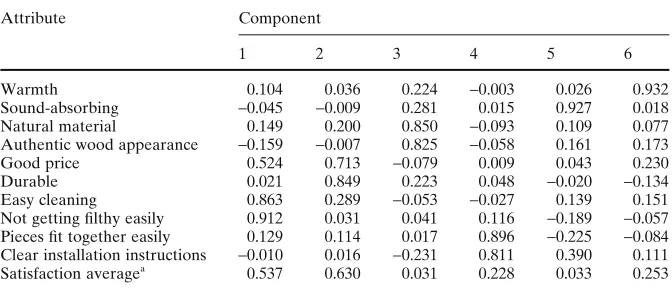
The PCA conducted on the data from respondents with experience of laminated flooring (47 observations in all) included the following attributes: Warmth,
Sound-absorbing, Natural material, Authentic wood appearance, Good price, Durable, Easy cleaning, Not getting filthy easily, Pieces fit together easily, Clear installation instructions.
Unfortunately, the attribute Wood feeling was inadvert-ently overlooked in translating the questionnaire for lami-nate users. The six extracted components (corresponding to the number of assumed benefits) account for 85% of the variance.
The pattern from the PCA as to wooden flooring users is partly repeated in Table 4. Hence, Easy cleaning and Not
getting filthy easily, exhibiting high loadings on the first
com-ponent, once again seem to reflect the benefit Hygiene well, and Good price and Durable, with high loadings on the second component, plausibly constitute good reflections of
LLCC. However, in the case of laminate users, Natural material is apparently associated with Authentic wood ap-pearance, thus reflecting the benefit Esthetics in this
in-stance. Pieces fit together easily and Clear installation
instructions, both loading high on the fourth component,
apparently reflect the benefit DIY well. Benefits Nice
atmosphere and Nice underfoot are reflected in one
at-tribute each in this instance: Sound-absorbing and Warmth, respectively.
The attributes included in the PCA conducted on the data from respondents with experience of carpet were:
Warmth, Softness, Sound-absorbing, Good price, Durable, Easy cleaning, Not getting filthy easily, Nice color and pat-tern. Pieces fit together easily and Clear installation instruc-tions were not included due to the limited number of
observations (13 respondents who had installed the
carpet-Table 3. Principal component loadings: wood
Attribute Component
1 2 3 4
Warmth -0.001 0.294 -0.141 0.844
Wood feeling -0.325 -0.414 0.197 0.655
Sound-absorbing -0.159 -0.205 0.872 0.095 Natural material 0.040 -0.103 0.919 -0.107
Good price 0.859 0.146 -0.080 -0.186
Durable 0.869 0.032 -0.121 -0.148
Easy cleaning 0.149 0.919 -0.085 0.035
Not getting filthy easily 0.158 0.826 -0.269 0.085 Satisfaction averagea 0.735 0.386 0.127 0.327 The number of observations for all variables included is 27
aThe mean value of the ratings of overall satisfaction and satisfaction relative to expectations
Table 4. Principal component loadings: laminate
Attribute Component
1 2 3 4 5 6
Warmth 0.104 0.036 0.224 -0.003 0.026 0.932
Sound-absorbing -0.045 -0.009 0.281 0.015 0.927 0.018
Natural material 0.149 0.200 0.850 -0.093 0.109 0.077
Authentic wood appearance -0.159 -0.007 0.825 -0.058 0.161 0.173
Good price 0.524 0.713 -0.079 0.009 0.043 0.230
Durable 0.021 0.849 0.223 0.048 -0.020 -0.134
Easy cleaning 0.863 0.289 -0.053 -0.027 0.139 0.151
Not getting filthy easily 0.912 0.031 0.041 0.116 -0.189 -0.057 Pieces fit together easily 0.129 0.114 0.017 0.896 -0.225 -0.084 Clear installation instructions -0.010 0.016 -0.231 0.811 0.390 0.111
Satisfaction averagea 0.537 0.630 0.031 0.228 0.033 0.253
ing themselves out of 26 observations in all). The five ex-tracted components (corresponding to the number of as-sumed benefits) account for 92% of the variance.
In conformity with the results for wood and laminate,
Easy cleaning and Not getting filthy easily apparently reflect Hygiene well, judging by the pattern of component loadings
in Table 5. Warmth and Softness, having high loadings on the second component, plausibly constitute good reflections of Nice underfoot. Again, LLCC is well reflected in Good
Price and Durable. The benefits Esthetics and Nice atmo-sphere are reflected in one attribute each in this instance: Nice color and pattern and Sound-absorbing, respectively.
Attributes and benefits: importance and performance data
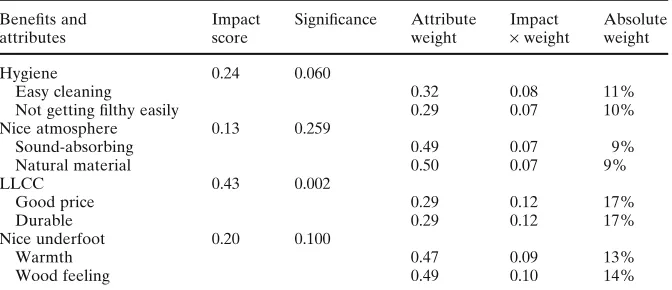
PLS was conducted to estimate the impact of benefits on satisfaction, the weight of each benefit’s attributes, their product (i.e., the overall importance of each attribute), and the absolute weight (i.e., the importance in relation to the other attributes).
Table 6 presents PLS estimates of benefit and attribute importance for wooden flooring users. The impact scores are, except for Nice atmosphere, significant on at least the
10% level. LLCC is apparently the most crucial benefit for customer satisfaction in this instance, followed by Hygiene and Nice underfoot; the latter two benefits roughly of equal importance. The model explains 51% of the variation in satisfaction.
Table 7 reports PLS estimates for laminate users. Again,
LLCC has the greatest impact on satisfaction. Hygiene is
the second most important benefit, followed by DIY.
Es-thetics, Nice Atmosphere, and Nice underfoot all seem to
have a negligible impact on satisfaction for laminate users. The model explains 59% of the variation in satisfaction.
PLS estimates for carpet users are presented in Table 8.
Hygiene and Nice underfoot, roughly of equal importance,
are the benefits that impact most on satisfaction in this instance, followed by LLCC. Nice atmosphere, and, particu-larly, Esthetics are less important benefits for carpet users. The model explains 66% of the variation in satisfaction.
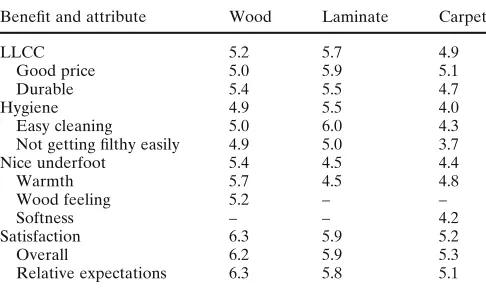
Priority setting should consider both the performance and importance/impact information, according to the logic: improve the areas that are important to customers and in
which the product performance is poor.15
Table 9 displays performance levels for wood, laminate, and carpet on: satis-faction, what apparently are the most important benefits, and their respective manifest variables (MVs).
Table 5. Principal component loadings: carpet
Attribute Component
1 2 3 4 5
Softness 0.023 0.879 0.083 -0.002 0.250
Warmth -0.316 0.787 0.049 0.337 0.156
Sound-absorbing -0.024 0.372 0.071 0.139 0.901
Nice color and pattern -0.038 0.159 0.127 0.961 0.117
Good price -0.212 0.118 0.856 0.247 0.235
Durable 0.522 0.072 0.760 -0.088 -0.192
Easy cleaning 0.854 -0.387 -0.167 0.138 -0.127
Not getting filthy easily 0.907 0.017 0.085 -0.230 0.010
Satisfaction averagea 0.619 0.570 0.279 0.158 0.217
The number of observations for all variables included is 26
aThe mean value of the ratings of overall satisfaction and satisfaction relative to expectations
Table 6. Benefit and attribute importance: wood
Benefits and Impact Significance Attribute Impact Absolute
attributes score weight ¥ weight weight
Hygiene 0.24 0.060
Easy cleaning 0.32 0.08 11%
Not getting filthy easily 0.29 0.07 10%
Nice atmosphere 0.13 0.259
Sound-absorbing 0.49 0.07 9%
Natural material 0.50 0.07 9%
LLCC 0.43 0.002
Good price 0.29 0.12 17%
Durable 0.29 0.12 17%
Nice underfoot 0.20 0.100
Warmth 0.47 0.09 13%
Wood feeling 0.49 0.10 14%
The latent variables, i.e., the benefit and satisfaction indices, were scaled to unit variance and centered
Wood users are apparently, on average, quite satisfied. The tactile qualities of wooden flooring (Nice underfoot) are rated highly. The surprising circumstance that carpet does not perform better on tactile qualities is probably a reflection of the generally bad image of this floorcovering, manifested in a relatively low rating in satisfaction. Wooden flooring fares less well, especially compared to laminate, on
LLCC and Hygiene. As for LLCC, it is primarily the price
of wooden flooring that is perceived as less favorable. For
Hygiene, the attribute Easy cleaning is responsible for the
low performance of wood compared to laminate. In this connection it should be mentioned that discriminant analy-sis revealed some differences in evaluations between solid and engineered wood users. Hence, the mean values of the ratings are significantly higher (at the 5% level) for engi-neered wood on the attributes Good price, Durable, and
Not getting filthy easily, as well as for satisfaction relative to Table 7. Benefit and attribute importance: laminate
Benefits Impact Significance Attribute Impact Absolute
and attributes score weight ¥ weight weight
Hygiene 0.24 0.036
Easy cleaning 0.46 0.11 13%
Not getting filthy easily 0.45 0.11 13%
DIY 0.17 0.100
Pieces fit together easily 0.53 0.09 10%
Clear installation instructions 0.50 0.08 10%
LLCC 0.38 0.001
Good price 0.37 0.14 17%
Durable 0.47 0.18 21%
Esthetics 0.07 0.511
Natural material 0.30 0.02 3%
Authentic wood appearance 0.32 0.02 3%
Nice atmosphere 0.07 0.471
Sound-absorbing 0.65 0.05 6%
Nice underfoot 0.07 0.486
Warmth 0.65 0.05 5%
The latent variables, i.e., the benefit and satisfaction indices, were scaled to unit variance and centered
Table 8. Benefit and attribute importance: carpet
Benefits Impact Significance Attribute Impact Absolute
and attributes score weight ¥ weight weight
Hygiene 0.35 0.001
Easy cleaning 0.39 0.14 17%
Not getting filthy easily 0.41 0.15 18%
Nice underfoot 0.32 0.008
Softness 0.49 0.16 19%
Warmth 0.43 0.14 17%
LLCC 0.18 0.054
Good price 0.45 0.08 10%
Durable 0.42 0.08 9%
Esthetics 0.03 0.750
Nice color and pattern 0.66 0.02 2%
Nice atmosphere 0.12 0.256
Sound-absorbing 0.65 0.08 9%
The latent variables, i.e., the benefit and satisfaction indices, were scaled to unit variance and centered
Table 9. Benefit and satisfaction performance
Benefit and attribute Wood Laminate Carpet
LLCC 5.2 5.7 4.9
Good price 5.0 5.9 5.1
Durable 5.4 5.5 4.7
Hygiene 4.9 5.5 4.0
Easy cleaning 5.0 6.0 4.3
Not getting filthy easily 4.9 5.0 3.7
Nice underfoot 5.4 4.5 4.4
Warmth 5.7 4.5 4.8
Wood feeling 5.2 – –
Softness – – 4.2
Satisfaction 6.3 5.9 5.2
Overall 6.2 5.9 5.3
Relative expectations 6.3 5.8 5.1
expectations. Caution is warranted in interpreting the latter results, however, due to small sample size (15 solid and 12 engineered wood users).
Discussion
Methodology
A comprehensive picture of the competitive situation of wood as a building material is needed for successful quality improvement and product development. Substitutes are those material alternatives sharing the same usage context. Thus, it is necessary to establish why and where the building application materials under study are used. The methodol-ogy used in Jonsson,6
combining qualitative data gathering and multivariate analysis (PLS-DA), is well adapted for extracting salient evaluative criteria and establishing in what usage contexts building application materials are used. Comparisons occur at more abstract levels the less physi-cally comparable the alternatives. This is imperative to acknowledge when it comes to material substitution, with alternatives differing as to physical characteristics. Cus-tomer satisfaction can be expressed as a function of current quality and past satisfaction,29
or, as expressed by Bergman and Klefsjö:30
“The quality of a product (article or service) is its ability to satisfy the needs and expectations of the customer.” From the customer’s perspective, the primary drivers of customer satisfaction are the benefits that a prod-uct or service provides.15
Hence, firms focusing on root needs, i.e., benefits or consequences, can develop totally new markets.16
In all, assessing customer needs in material substitution in an end-consumer context should allow analysis on the rather abstract level of customer benefits.
The results of this study suggest that CSM using PLS is well suited for extracting the information necessary for pri-oritizing customer needs: importance and performance data for attributes as well as customer benefits. Furthermore, the circumstance that importance is equivalent with impact in CSM allows parsimonious analysis, as there is no need for separate surveys to acquire importance and performance information.
Managerial implications
CSM, with its external focus on customers, constitutes a useful complement to quality function deployment (QFD). Importance and performance data extracted by CSM make the prioritizing of customer benefits and attributes possible, thus providing valuable input to QFD, where customer requirements, moving downstream through successively lower levels of abstraction, are systematically translated into measurable product and process parameters (for a
comprehensive account of QFD, e.g., see Akao31
).
The results of this study indicate that practical, func-tional, benefits exert the greatest impact on customer satis-faction for wooden flooring as well as its closest substitutes laminate and carpet. This is noteworthy, because the salient
evaluative criteria for choosing wooden flooring found in Jonsson6
were of a nonfunctional nature. This circumstance highlights the necessity of considering substitutes when as-sessing customer needs to identify latent needs.7
Customer benefits Low life cycle cost (LLCC) and Hygiene are appar-ently the most important to improve for wooden flooring manufacturers, because importance is high and perfor-mance relatively low. As for LLCC, it has been shown that the life cycle cost of wooden floorings is significantly higher than for other types of floorcovering, and that recurring costs are much higher than the initial cost.32
These circum-stances, and the fact that it might be undesirable to lower the price, imply that manufacturers of wooden flooring should prioritize durability. For Hygiene, the attribute Easy
cleaning is apparently the one that requires attention for
quality improvement and/or product development.
References
1. Eastin IL, Shook SR, Fleishman SJ (2001) Material substitution in the US residential construction industry, 1994 versus 1998. Forest Prod J 51:30–37
2. Wagner ER, Hansen EN (2004) A method for identifying and assessing key customer group needs. Ind Market Manag 33:643– 655
3. Anon (1998) Wood as a building material. A qualitative study-Denmark. Job no. 980901. Research International Norway, Oslo 4. Broman NO (1996) Two methods for measuring people’s
prefer-ences for Scots pine wood surfaces: a comparative multivariate analysis. Mokuzai Gakkaishi 42:130–139
5. Ahlmark D (1977) Substitute and competition – a study of pro-duct differentiation based on material properties (Swedish). Research report 6069. Ekonomiska forskningsinstitutet vid Handelshögskolan i Stockholm, EFI, Stockholm
6. Jonsson R (2005) The end-consumers choice of floorcovering in the Netherlands and the UK: a comparative pilot study of substi-tute competition. J Wood Sci 51:154–160
7. Shocker AD, Bayus BL, Kim N (2004) Product complements and substitutes in the real world: the relevance of “other products.” J Marketing 68:28–40
8. Graonic MD, Shocker AD (1993) On the transferability of features/level preferences across competing products serving the same purposes. Adv Consum Res 20:389–394
9. Warlop L, Ratneshwar S (1993) The role of usage context in con-sumer choice: a problem solving perspective. Adv Consum Res 20:377–382
10. Corfman KP (1991) Comparability and comparison levels used in choices among consumer products. J Marketing Res 28:368–374 11. Johnson MD (1988) Comparability and hierarchical processing in
multialternative choice. J Consum Res 15:303–314
12. Ratneshwar S, Shocker AD (1991) Substitution in use and the role of usage context in product category structures. J Marketing Res 28:281–295
13. Herrmann A, Gustafsson A, Elg M (1997) An integrative frame-work for product development and satisfaction measurement. In: Gustafsson A, Bergman B, Ekdahl F (eds) Proceedings of the 3rd Annual International QFD Symposium, vol 2. Linköping University, Linköping, pp 143–158
14. Johnson MD, Fornell C (1991) A framework for comparing cus-tomer satisfaction across individuals and product categories. J Econ Psychol 12:267–286
15. Gustafsson A, Johnson MD (1997) Bridging the quality – satisfac-tion gap. Qual Manag J 4:27–43
16. Johnson MD (1998) Customer orientation and market action. Prentice Hall, Upper Saddle River, pp 183
Annual International QFD Symposium, vol 2. Linköping Univer-sity, Linköping, pp 21–34
18. Fornell C, Cha J (1994) Partial least squares. In: Bagozzi RP (ed) Advanced methods of marketing research. Blackwell, Cambridge, pp 52–78
19. Ajzen I, Fishbein M (1980) Understanding attitudes and predicting social behavior. Prentice-Hall, Englewood Cliffs, pp 278 20. Thompson CJ, Locander WB, Pollio HR (1989) Putting consumer
experience back into consumer research: the philosophy and method of existential-phenomenology. J Consum Res 16:133–146 21. Eisenhardt K (1989) Building theories for case study research.
Acad Manage Rev 14:532–550
22. Yin K (1984) Case study research. Sage, Beverly Hills, pp. 160 23. Wold S, Esbensen K, Geladi P (1987) Principal component analysis
– a tutorial. Chemometr Intell Lab 2:37–52
24. Glaser BG, Strauss AL (1967) The discovery of grounded theory. Aldine De Gruyter, New York, pp 271
25. Fornell C (1987) A second generation of multivariate analysis: classification of methods and implications for marketing research. In: Houston MJ (ed) Review of marketing. American Marketing Association, Chicago, pp 407–450
26. Wold H (1982) Systems under indirect observation using PLS. In: Fornell C (ed) A second generation of multivariate analysis: meth-ods. Praeger, New York, pp 325–347
27. Gustafsson A, Johnson MD (2002) Measuring and managing the satisfaction–loyalty–performance links at Volvo. J Target Meas Anal Market 10:249–258
28. Hair JF, Anderson RE, Tatham RL, Black WC (1998) Multivariate data analysis. Prentice-Hall, Upper Saddle River, pp 730 29. Anderson JC, Fornell C, Lehman DR (1994) Customer
satisfac-tion, market share, and profitability – findings from Sweden. J Marketing 58:53–66
30. Bergman B, Klefsjö B (1994) Quality from customer needs to customer satisfaction. McGraw-Hill, New York, pp 478
31. Akao Y (1992) Quality function deployment: integrating customer requirements into product design. Productivity, Cambridge, pp 369 32. Moussatche H, Languell J (2001) Flooring materials – life cycle
costing for educational facilities. J Facil 19:333–343