O R I G I N A L P A P E R
Open Access
Influence of drivers
’
visual and cognitive
attention on their perception of changes in
the traffic environment
Tina Cvahte Ojster
š
ek
*and Darja Topol
š
ek
Abstract
Drivers are met with numerous elements requiring their attention while driving. The present research focuses on selected visual and cognitive distractions that the driver is faced with, and on their influence on detecting and perceiving changes in the traffic environment. Driver self evaluation data was used to define which elements attract most visual and cognitive distraction. A constructed conceptual model was subjected to analysis using Exploratory factor analysis (EFA), Confirmatory factor analysis (CFA), and Structural Equation Modelling (SEM). Main findings show that thinking about personal problems, chores and errands as well as roadside advertisements on the cognitive side, and looking at advertisements and the natural environment on the visual side, present the most negative impacts on drivers’perception of crucial changes in the traffic environment. On the other hand, drivers that visually focus on traffic signals and pedestrians and think about driving speed, driving rules, and other traffic participants, tend to notice crucial changes in the traffic environment more often.
Keywords:Driver attention, Driver distraction, Cognitive attention, Visual attention, Traffic environment, Traffic safety
1 Introduction
Most adults carry out transport related activities daily. The driving itself often becomes routine, even in un-known traffic environments, which can present a signifi-cant cause for traffic accidents. In 2016, road injuries were the eighth top cause of deaths, killing 1.35 million
people worldwide [43]. The occurrence of traffic
acci-dents is influenced by many factors, which are generally divided into factors on the side of the driver, vehicle, and the environment. Because the driver is the most changing factor out of these, as it reflects the character-istics of each individual, research in this area is ex-tremely important.
While driving, certain events or activities can distract the driver. The distraction can be minimal and have no effect on the driver’s attention and driving performance, or it may be so extensive that the driver is no longer able to give the needed attention to the task of driving and consequently suffers from diminished driving
perform-ance [46]. Olson et al. [31] define a distraction as
occurring in the event of inattention, which causes a delay in recognizing information that is needed to safely perform a driving task. Lansdown, Stephens, and Walker
[22] emphasize that there is no common definition of
driver distraction currently valid, but they assess that the most appropriate definition would be that of Hedlund,
Simpson, and Mayhew [15], who define distraction as an
occurrence involving a diversion of attention of the driver due to the fact that the driver temporarily focuses on something (an object, person, task or event) that is not related to his driving, which consequently reduces his awareness, ability of decision making, and perform-ance, which leads to a higher risk of the need for cor-rective actions, near-crashes and crashes. Reasons for driving distraction can be connected to any cognitive process, such as daydreaming, mind wandering, solving mathematical problems or various decision making, and to the use of information systems in the vehicle (radio, navigation, phones…), all of which can influence the driver’s attention to the driving process [1]. Drivers are generally flexible and can adapt their behaviour connected to
© The Author(s). 2019Open AccessThis article is distributed under the terms of the Creative Commons Attribution 4.0 International License (http://creativecommons.org/licenses/by/4.0/), which permits unrestricted use, distribution, and reproduction in any medium, provided you give appropriate credit to the original author(s) and the source, provide a link to the Creative Commons license, and indicate if changes were made.
* Correspondence:[email protected]
driving in a way that allows them to also fulfil an increased demand for activities not related to their driving [46].
Driver distraction reduces driver performance and pre-sents an important factor in the occurrence of traffic acci-dents. Researches such as Treat et al. [40] and Wierwille et al. [42] found that driver factors (including driver er-rors) are the most common cause of traffic accidents /
crashes. Moreover, Castro [4] reasons that over 90% of
traffic accidents are the consequence of human error, and over 90% of those accidents are caused by visual informa-tion acquisiinforma-tion problems. Dingus et al. [8] and Singh [36] also confirm that drivers can be attributed with causing 90% or more critical situations in traffic.
The National Highway Traffic Safety Administration (NHTSA) divides driver distraction into four categories: visual (e.g. looking away from the roadway), auditory (e.g. responding to a ringing mobile phone), biomechan-ical (e.g. manually adjusting the radio volume), and cog-nitive (e.g. mind wandering) (Ranney, Garrott, and
Goodman [33]). In their own assessment of recent trips,
drivers reported lack of concentration (71.8%), adjust-ments of vehicle equipment (68.7%), looking at outside people, objects or events (57.8%), and talking to other people in the car (39.8%) as the most common distract-ing activities [27].
The tasks and activities carried out by the driver in the vehicle while driving are growing in scale and are conse-quently getting more distracting. In-vehicle activities that are not driving related and the resulting distractions have a proven negative impact on driving performance [16], increased number of driver errors [45], incidence of critical situations and traffic accidents [8], and severity
of traffic accidents’ outcome [30]. Probably the most
common distracting factor, which is also most frequently explored in research, is the use of mobile phones. The use of these devices lowers driving precision [35], causes up to 50% slower responses to threats in comparison to
driving without a mobile phone [3], and causes a
reduc-tion in performance [12]. The distracting effects are
present even when using hands-free systems [11]. The
driver is also largely influenced by activities, related to in-vehicle entertainment systems, such as changing the
radio volume and alike [38, 44]. The use of navigation
systems while driving has different effects on the effi-ciency of driving, which is connected to the manner of controlling the device, which can be manually operated or voice controlled. Tijerina et al. [39] found that devices which are manually operated take more attention from the driver, needing longer to operate them and taking their eyes off the road more often, in comparison to de-vices, operated by voice.
In addition to in-vehicle distraction, elements of the road-side can also present an important part of driver distraction. Even though observation of the traffic environment and
roadside is an important activity during driving, some ele-ments outside of the vehicle draw the drivers’attention and consequently present an important distraction. Roadside el-ements such as landscape heritage objects [2], roadside
bill-boards and posters [28], and electronic billboards Dukic
et al. [9], are found to be important distractors to the driver. Even though these elements present a potential distraction, their presence does not influence how drivers estimate the driving demand or riskiness of a certain road segment [6].
Another important distraction is mind wandering, being deep in thought or daydreaming. Mind wandering is a common occurrence that, according to Killingsworth and
Gilbert [19], and Song and Wang [37], takes up 30–50%
of the time an individual is awake. This activity is often
encountered in traffic as well, since drivers often “zone
out”during driving, which consequently reduces their
at-tentiveness for the traffic environment and can cause dan-gerous situations by reducing the driver’s ability to
process information from the environment [10] as well as
by narrowing the visual scanning field of drivers [24]. The same research concludes that half of drivers attest to ex-periencing some mind wandering before causing a traffic accident. Qu et al. [32] studied the frequency and correla-tions of driver mind wandering and found that during times of wandering minds, drivers do not show many defi-cits in controlling the vehicle but tend to focus their visual attention narrowly on the road, therefore mind wandering can mean a reduced ability to monitor the environment. The authors also found that mind wandering is positively correlated to dangerous and risky driving, aggressive driv-ing, negative cognitive/emotional driving styles, driving under the influence of alcohol and to a larger number of self-reported traffic accidents.
The above mentioned distractions are therefore crucial in the area of traffic safety from the driver perspective.
Almahasneh et al. [1] find that the two most often noted
distractions, visual distraction (“eyes-off-road”) and cogni-tive distraction (“mind-off-road”), are important negacogni-tive influencing factors for driving performance, such as lane variation, steering control, response to hazards, and visual perception efficiency, and that both distractions can even occur at the same time and are co-dependent. Charlton and Starkey [5] researched the effects of familiarity and automaticity on inattention blindness and detecting changes in the driving environment in a simulated envir-onment. They found that many drivers drive without awareness and that driving in a familiar environment in-creases sensitivity to changes in road features associated with vehicle guidance and brings an improved perform-ance on tasks not directly connected to driving.
Martens and Brouwer [26] used driving simulation to
sound and speech task, presenting an external distrac-tion. Researchers found that both internal and external distractions affected driving speed, number of lane changes, decreases in speed, and glances. Moreover, sub-jective evaluation from the drivers confirmed that they were less attentive to driving. Neyens and Boyle [29] ex-amined cognitive, cell phone, in-vehicle, and passenger-related distractions in relation to traffic accidents of teenage drivers and found that cognitive distractions more often resulted in rear-end crashes and angular col-lisions compared to fixed-object colcol-lisions. Similar out-comes in relation to physical and cognitive driver distractions and their influence on driving performance were found in other studies (e. g [14, 18].; Liu, Fu, and Lan [25]). Considering these results, it can be determined that driving distractions are an important subject for driv-ing safety and therefore need to be examined further.
The present research will focus on the two major groups of distractions (visual and cognitive) and define whether
the distracting factors influence drivers’ perception of
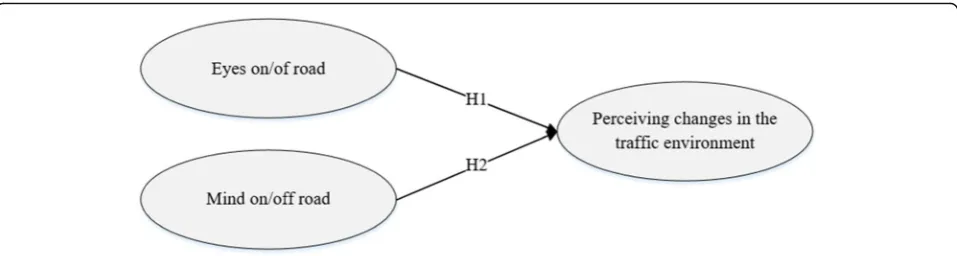
changes in the traffic environment. Previous research points to the importance of researching various driver dis-tractions, which is the root of the present research as well, since it connects the influence of various distractions to the traffic environment. These changes are related to new advertisements, new or changed traffic signalization, changes of traffic regimes, and road work. Based on the above, two main hypotheses were formed:
H1. Visual attention to internal and external elements (eyes on or off the road) is connected to perceiving changes in the traffic environment.
H2. Cognitive attention to internal and external elements (mind on or off the road) is connected to perceiving changes in the traffic environment.
2 Materials and methods
In order to explore the connection between distractions and perceiving changes in the traffic environment, such as changes related to traffic signalization, changes in the traffic regime, and road work, a survey was conducted among Slovenian drivers of passenger cars. The objective is to determine the impact of each of the selected dis-tractions, as described by the following measurements of distraction and perception of changes in the traffic environment:
(a) driver attention during driving (5 = I am very attentive to, 1 = I am not attentive to at all): car stereo (ATTEN_1), advertisements (ATTEN_2), natural environment (ATTEN_3), traffic signals (ATTEN_4), phone (ATTEN_5), driving speed (ATTEN_6), traffic lights (ATTEN_7), other
vehicles and drivers (ATTEN_8), pedestrians (ATTEN_9);
(b) cognitive processes, i. e. thinking while driving (5 = I always think about, 1 = I never think about): personal problems (THINK_1), driving speed (THINK_2), driving rules (THINK_3), roadside advertisements (THINK_4), chores and errands (THINK_5), other traffic participants (THINK_6); (c) the level of perception of changes in the traffic
environment (5 = I always perceive changes, 1 = I never perceive changes): new roadside
advertisements (TRAFF_CH_1), changes in traffic signs (TRAFF_CH_2), changes in traffic regimes (TRAFF_CH_3), road work (TRAFF_CH_4).
A construct or conceptual model encompassing three abstract variables and their proposed relationships was designed. These variables are not directly observable and should therefore be measured by other variables. The detailed structure of the conceptual model is pre-sented in Fig.1.
2.1 Questionnaire
In order to investigate the impact of driver distractions on their perception of changes in the traffic environment, a questionnaire was prepared to measure the levels of driver behaviour for elements of traffic and non-traffic environ-ment and for mind wandering. The impact of these driving distractions on detecting changes in the traffic environ-ment, changes in traffic signs, changes in the traffic regime, and road work, was measured. The respondents were instructed to think of their most often taken driving route (e.g. their daily commute to work) and to respond to the questionnaire with that route in mind, so the collected in-formation presents the respondents’estimate of their over-all driving experience. For a total of 19 variables, the respondents gave their level of attention or perceived changes on a 5 point Likert scale. The questionnaire also included control variables, namely age, average yearly amount of driven kilometres as a driver, amount of years having a driving licence for a car, and how many days a week the respondent drives a car.
A questionnaire like this is inevitably based on drivers’ retrospective and subjective assessment of their driving experience, which is one of the main limitations of this re-search. Nonetheless, such questionnaires are one of the most often used tools in researching driving behaviour and perception, the most known example being the
Driv-ing behaviour questionnaire [34]. For the DBQ, Lajunen
and Summala [21] found that drivers’ self-evaluation is
attention allocation via eye tracking with their self-evaluation (subjective) of visual attention allocation found that both sets of evaluation are conform to one another (see [41]), which gives additional validity to the method used in this research.
The research was performed among Slovenian drivers who completed the questionnaire online or via a printed version, both were completely anonymous. The question-naire was disseminated on the researchers’institution’s so-cial media accounts (online) and in the institution’s public space (printed version). Incomplete questionnaires were excluded, and the end sample consisted of 213 filled out questionnaires. Out of these, 38.4% respondents were male and mean respondent age was 25.32 years (min = 18 years, max = 60 years, SD = 6.06). The average number of years the respondents have had their driving license for a car is a little less than 7 years (M = 6.88, min = 1, max = 41, SD = 5.71) and they drive a car on 5 days in a week (M = 4.81, min = 0, max = 7, SD = 2.19). Most respondents’ annual mileage is under 5000 km (29.9%) and from 5000 to 10,000 km (27.1%), and about a quarter drive more than 15,000 km yearly (23.8%).
2.2 Model
The used conceptual model was subjected to analysis using Exploratory factor analysis (EFA), Confirmatory factor analysis (CFA), and Structural Equation Modelling (SEM).
One type of latent variables which are explicitly mod-elled in SEM or are a by-product of analysis using ex-ploratory analysis techniques are so called factors. An EFA requirement is the non-correlation of uniqueness. In SEM, the term latent variables is commonly used to imply factors. The modelling in SEM is more mathemat-ically oriented and allows for a broader spectre of models to be evaluated than with using EFA. Confirma-tory factor analysis (CFA) or restricted factor analysis is a SEM application focused solely on relations between latent variables and their indicators, where the necessary restrictions cause CFA to be confirmatory and subjected
to statistical testing. Using appropriate restrictions, spe-cification, and testing of an array of factor models is per-mitted by CFA [17].
Based on EFA, the number and nature of the under-lying factors (latent variables - constructs) that are responsible for the variability in the data were identified. Based on these factors, CFA was performed in order to test whether the measures of a latent construct (factor) are consistent with the researcher’s understanding of the nature of that construct. After CFA, SEM was con-ducted. SEM is a statistical model that seeks to explain the relationships among multiple variables.
SPSS 22 software was used for EFA and AMOS 22 for CFA and SEM.
3 Results
Research results will focus on three main areas, repre-sented by EFA, CFA, and SEM.
CFA, where the main objective is to investigate whether the data fit the hypothesized measurement model. The structure of the model of factors was derived from EFA, which was used as a baseline when conducting the CFA analysis. CFA validated the model structure against the existing measurement theory. CFA will in essence define whether there is a connection among the set of mea-sured variables and their constructs, which means we will test whether certain variables precisely define a spe-cific latent variable.
SEM will be performed based on EFA and CFA. Struc-tural equation modelling is a class of statistical models which aim to explain the relationships among multiple vari-ables. SEM will enable evaluation of relationships between measureable and latent variables and relationships among latent variables. During the process of SEM modelling, con-trol constructs are included with one element (factors age, average yearly amount of driven kilometres as a driver, amount of years having a driving licence for a car, and how many days a week the respondent drives a car).
3.1 Exploratory factor analysis
A normality test must be performed in order to success-fully perform EFA, since it is the basis for choosing a method for estimating the factor loadings and the vari-ances. Normality was studied by observing the skewness and kurtosis of the data. Both skewness and kurtosis were
inside desired limits as recommended by Kline [20], Lei
and Lomax [23], and Curran, West, and Finch [7].
Concerning normality in data distribution, Maximum likelihood method (Promax rotation) was used for esti-mating (ML). Its main advantage is the calculation of a wide range of indexes for the model’s goodness of fit. For determining reliability, Bartlett’s test of sphericity (BTS) and the Kaiser-Meyer-Olkin (KMO) test were
per-formed. The BTS test was highly significant at χ2 = 842,
466 with df = 91 and p< 0.001, while the value of KMO
was 0.774 > 0.5. We can determine based on these tests that the factor analysis is reliable.
The size of factor loadings normally reflects the con-vergent validity with high correlations between variables within a single factor. Because sample size affects suffi-cient or significant loadings, the required loadings are higher when the sample size is smaller. In our sample size of 213 completed questionnaires, a factor loading of
at least 4.40 is recommended [13], which was achieved.
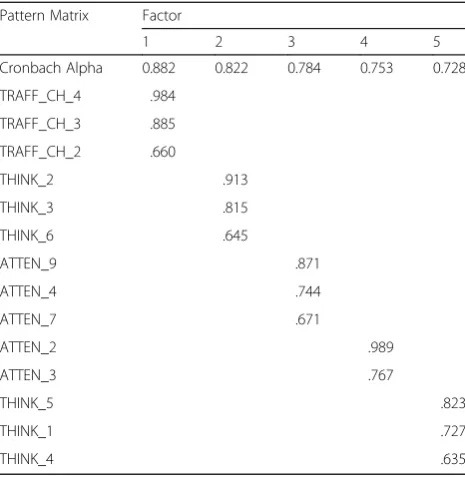
Table 1 shows the EFA results, which include
Cron-bach’s alphas. CronCron-bach’s alpha is a measure used for the determination of the reliability of internal consistency of the factors that EFA extracted. Generally speaking, this represents an evaluation of the degree of consistency be-tween multiple measurements of a certain variable, mean-ing that a “reliable” set of variables will be consistently loaded onto the same factor.
Table 1 shows the EFA results, which include
Cron-bach’s alphas. According to Hair et al. [13], the generally agreed minimal lower limit for Cronbach’s alpha is 0.70.
EFA results show that variables, connected to perceiv-ing changes in the traffic environment, are significantly loaded on the corresponding factor 1, which can be
called “Perceived changes” (TRAFF_CH_2, 3, 4) due to
included variables. Variables named THINK_x are de-rived from the question on what drivers think about while driving. For variables of Driving speed (THINK_2), Driving rules (THINK_3), and Other traffic participants
(THINK_6), the corresponding factor is called
“Mind-on-road” since it shows that the driver’s cognitive
pro-cesses are concerned with their driving. Other variables from this question about Personal problems (THINK_1), Roadside advertisements (THINK_4), and Chores and errands (THINK_5) are significantly loaded on the
cor-responding factor 5, which can be called
“Mind-off-road”. Variables about driver attention during driving for Traffic signals (ATTEN_4), Traffic lights (ATTEN_7), and Pedestrians (ATTEN_9) are significantly loaded on
the corresponding factor 3, named“Eyes-on-road”.
Vari-ables Advertisements (ATTEN_2) and Natural environ-ment (ATTEN_3) are connected to factor 4, so called “Eyes-off-road”.
3.2 Confirmatory factor analysis
To test the consistency of latent construct measures (factors) with understanding of the nature of the con-struct as set in the research, confirmatory factor analysis is used. Loading factors, derived from EFA, are assigned Table 1Achieved results of the rotated factor pattern matrix (exploratory factor analysis)
Pattern Matrix Factor
1 2 3 4 5
Cronbach Alpha 0.882 0.822 0.784 0.753 0.728
TRAFF_CH_4 .984
TRAFF_CH_3 .885
TRAFF_CH_2 .660
THINK_2 .913
THINK_3 .815
THINK_6 .645
ATTEN_9 .871
ATTEN_4 .744
ATTEN_7 .671
ATTEN_2 .989
ATTEN_3 .767
THINK_5 .823
THINK_1 .727
to confirmatory factor analysis. Maximum likelihood method was used in CFA due to multivariate normality. Based on various author recommendations, different model fits were tested in CFA, which were above the recommended values. Additionally, Composite (con-struct) Reliability (CR) and Average Variance Extracted (AVE) were tested. Composite reliability reached over the limit of 0.50 (from 0. 562 to 0.648) and AVE values surpassed 0.70 (from 0.751 to 0.885).
3.3 Structural equation model
Since it is a combination of confirmatory factor analysis and regression analysis or simultaneous equations models, structural equation modelling is being more and more used in modelling various relationships between unmeasurable factors.
As in CFA, maximum likelihood estimation method was used in SEM. Certain additional factors are also im-portant for this research, such as the influence of control variables on the driver’s perception of changes in the traffic environment. These were driver age, how many days in a week the participant is involved in traffic, and how many kilometres they drive in a year.
After the finished estimation, GOF indexes were calcu-lated. As in CFA, these indices provided evidence of a good model fit, since their achieved values wereχ2 = 130.239,χ2/ df = 1.240, GFI = 0.922, NFI = 0.932, TLI = 0.963, CFI = 0.971, RMSEA = 0.037, SRMR = 0.0636, IFI = 0.972.
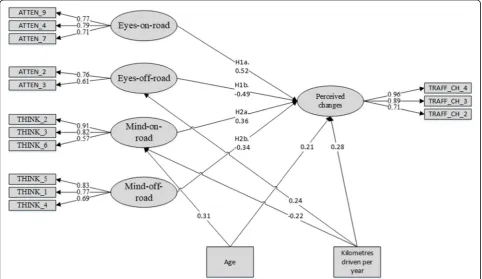
Figure2 shows a graphical representation of the
stan-dardized SEM model with the estimated path
coeffi-cients significant at p≤0.10 level among the variables;
insignificant paths are not shown in Fig.2 (amount of
years having a driving licence for a car, and how many days a week the respondent drives a car). The SEM model is represented by the path diagram, and it in-cludes the measurement part of the model (influences of measurable variables onto latent variables, e.g. the
con-nections between Eyes-on-road and ATTEN_9,
ATTEN_4 in ATTEN_7) and the structural part of the model (influences or connection among latent variables, e.g. the influence of Eyes-on-road to Perceived changes). The paths that are significant have the corresponding standardized weights marked.
3.3.1 Relationship between measured and latent variables
The EFA and CFA revealed five latent variables: Per-ceived changes, Mind-on-road, Mind-off-road, Eyes-on-road, and Eyes-off-road.
The latent variable “Perceived changes” was
con-structed, based on EFA and CFA, with 3 measured vari-ables which covered a wide range of traffic sign changes and changes in traffic regimes as well as road work. From the path coefficient, it is obvious that drivers most often perceived road work, which can be explained by the fact that it is the most visually obvious change among the observed. This also suggests that perceiving
road work is more important for drivers than other
changes. The latent variable“Eyes-on-road” is presented
by 3 measured variables, which covered different traffic concerned elements. The SEM revealed that the largest
coefficient refers to “Traffic signals” (ATTEN_4), and to
“Pedestrians” (ATTEN_9), which means that drivers are most attentive to traffic signalization and pedestrians, who are the most vulnerable group of traffic
partici-pants. Factor “Eyes-off-road” includes only two
mea-sured variables representing Advertisements (ATTEN_2) and Natural environment (ATTEN_3). These variables can have a significant effect on the level of traffic safety, since they attract driver attention and steer it away from
the traffic environment. The latent variable “Mind-on
road” was constructed by 3 measured variables, which
covered a range of different cognitive or thinking pro-cesses concerned with the traffic environment. From the
path coefficient, it is obvious that variable “Driving
speed” (THINK_2) had the largest coefficients in
con-structing “Mind-on road”. “Mind-off-road” is the last
constructed latent variable and is represented by 3 mea-sured variables, which covered a wide range of cognitive processes concerned with mind wandering elements,
such as “Personal problems” (THINK_1), “Roadside
ad-vertisements” (THINK_4) and “Chores and errands”
(THINK_5). From the path coefficient, it is obvious that thinking about chores and errands (THINK_5) had the largest coefficients in constructing“Mind-off-road”.
3.3.2 Relationship among latent variables
The SEM results also identified six significant relations among the 5 latent variables that were consistent with the
hypotheses. First positive relation is between
“Eyes-on-road” and“Perceived changes”. This indicates that drivers
who are more attentive to what is happening in the traffic environment and pay more attention to it are more likely to notice and perceive changes within the traffic
environ-ment. The path coefficient between “Eyes-off-road” and
“Perceived changes” is negative, meaning that drivers who more often observe elements outside of the immediate traf-fic environment perceive less changes in the traftraf-fic environ-ment itself. In the case of a positive relation between “Mind-on-road” and“Perceived changes”and the negative
relation between“Mind-off-road”in“Perceived changes”it
can be found that drivers who more often think about their personal problems or other non-traffic related issues are less likely to perceive changes in the traffic environment.
Additionally, the influence of some control variables (age, number of yearly driven kilometres, amount of years having a driving licence for a car, and how many days a week the respondent drives a car) on the latent variables was also studied. The variables pointing to the amount of years having a driving licence for a car and how many days a week the respondent drives a car did
not give significant results (estimated path coefficients is
not significant at p≤0.05, p value was not under 0.05
but over 0.205) and were consequently excluded from the SEM model results. SEM results show that as the drivers age, they become more attentive to the traffic en-vironment and also think more about its elements, which can be confirmed with a positive value of the path
coefficient among the control variable“Age”and
“Mind-on-road”. Older drivers also more perceive changes in the traffic environment more often, as shown by the
positive path coefficient value among “Age” and
“Per-ceived changes”. The other control variable, number of kilometres a driver drives in their car per year, gave sig-nificant results in three cases: the path coefficients with “Mind-on-road” (−0.22), with“Eyes-off-road”(0.24) and with “Perceived changes” (0.28). From these results, it can be stated that drivers who drive larger distances per year are less attentive to the traffic environment, think about it less, and more frequently focus on elements outside of the relevant traffic environment. At the same time, these drivers more frequently notice and perceive various changes in the traffic environment, which can suggest that their experience, especially in a certain en-vironment they know and are accustomed to, gives them the advantage of better detection of untypical situations.
4 Discussion
Inevitably, drivers do not always focus on the road and the traffic situation at hand. Distractions that occur ei-ther internally or externally (i.e. are cognitive or visual) have a great effect on their perception of the traffic en-vironment and consequently on their driving safety. The present research set out to determine what cognitive and visual elements affect a driver’s attention to the traf-fic environment as presented by their perception of changes in said environment.
Results of the constructed model showed that both vis-ual and cognitive attention are connected to perceiving changes in the traffic environment, therefore confirming the set hypotheses. Out of the nine potential visual ele-ments, advertisements and the natural environment repre-sent the visual elements that most distract the driver to take his eyes away from the relevant traffic environment, and out of six cognitive elements, thinking about chores and errands, personal problems, and roadside advertise-ments pose the greatest threats for mind wandering dur-ing drivdur-ing. It is interestdur-ing to note however that out of the given elements of the traffic and roadside environ-ment, new roadside advertisements were not a significant part of perceived changes.
focused on the road less. However, as in rising age, these drivers notice more changes in the traffic environment. This could be explained with the role of experience in the act of driving, since drivers come to expect a normal state of the traffic environment and can therefore put more focus outside of it, but also tend to notice anything out of the ordinary sooner and can react to changes more appropriately.
An important limitation of the present research, even though the model showed great reliability, is that it is based on self-evaluation of general driving experience ra-ther than on external objective evaluation. Therefore, the authors propose that in the future, similar research should be performed with some form of objective meas-uring of visual and cognitive distractions while at the
same time measuring drivers’ perception of changes in
their traffic environment in real time.
5 Conclusion
Overall, the importance of the results of the present re-search lies mainly in knowing what aspects traffic safety ini-tiatives should focus on most and what elements potentially pose the largest threats to driver attention. Policy makers and practitioners should develop focused programs aimed at educating drivers on the plethora of elements that influ-ence their driving capabilities and focus, and encourage mindful driving with a sufficient visual and cognitive focus on the driving tasks and traffic environment.
Acknowledgements
Not applicable.
Authors’contributions
TCO and DT cooperated equally on the manuscript preparation and both read and approved the final manuscript. TCO managed the survey application and DT managed the modelling and analysis.
Funding
Part of this research is based on a survey, performed in the frame of the project“Po kreativni poti do praktičnega znanja (Practical knowledge through creative pathways)”, co-funded by the European Social Fund and conducted within the framework of the Operational Programme for Human Resources Development, development priority 1: Promoting entrepreneur-ship and adaptability, priority axis 1.3: Scholarentrepreneur-ship schemes.
Availability of data and materials
The datasets used and/or analysed during the current study are available from the corresponding author on reasonable request.
Competing interests
The authors declare that they have no competing interests.
Received: 2 August 2019 Accepted: 23 October 2019
References
1. Almahasneh, H., Chooi, W. T., Kamel, N., & Malik, A. S. (2014). Deep in thought while driving: An EEG study on drivers’cognitive distraction.
Transport Res F: Traffic Psychol Behav, 26, 218–226.https://doi.org/10.1016/j. trf.2014.08.001.
2. Antonson, H., Ahlström, C., Mårdh, S., Blomqvist, G., & Wiklund, M. (2014). Landscape heritage objects’effect on driving: A combined driving simulator
and questionnaire study.Accid Anal Prev, 62, 168–177.https://doi.org/10. 1016/j.aap.2013.09.021.
3. Burns, P. C., Parkes, A., Burton, S., Smith, R. K., & Burch, D. (2002).How dangerous is driving with a mobile phone? Benchmarking the impairment to alcohol (no. TRL547). Berks: Transport Research Laboratoryhttps://trl.co.uk/ sites/default/files/TRL547.pdf.
4. Castro, C. (2008). Visual demands and driving. In C. Castro (Ed.),Human factors of visual and cognitive performance in driving(pp. 2–26). Boca Raton: CRC Press. 5. Charlton, S. G., & Starkey, N. J. (2013). Driving on familiar roads: Automaticity and inattention blindness.Transport Res F: Traffic Psychol Behav, 19, 121–133.
https://doi.org/10.1016/j.trf.2013.03.008.
6. Charlton, S. G., & Starkey, N. J. (2017). Drivers’mental representations of familiar rural roads.J Environ Psychol, 50, 1–8.https://doi.org/10.1016/j.jenvp.2017.01.003. 7. Curran, P. J., West, S. G., & Finch, J. F. (1996). The robustness of test statistics
to nonnormality and specification error in confirmatory factor analysis.
Psychol Methods, 1, 16–29.https://doi.org/10.1037/1082-989X.1.1.16. 8. Dingus, T. A., Guo, F., Lee, S., Antin, J. F., Perez, M., Buchanan-King, M., &
Hankey, J. (2016). Driver crash risk factors and prevalence evaluation using naturalistic driving data.Proc Natl Acad Sci, 113(10), 2636–2641.https://doi. org/10.1073/pnas.1513271113.
9. Dukic, T., Ahlstrom, C., Patten, C., Kettwich, C., & Kircher, K. (2013). Effects of Electronic Billboards on Driver Distraction. Traffic Injury Prevention, 14(5), 469–76.https://doi.org/10.1080/15389588.2012.731546.
10. Galéra, C., Orriols, L., M’Bailara, K., Laborey, M., Contrand, B., Ribéreau-Gayon, R., Masson, F., Bakiri, S., Gabaude, C., Fort, A., Maury, B., Lemercier, C., Cours, M., Bouvard, M. P., & Lagarde, E. (2012). Mind wandering and driving: Responsibility case-control study.BMJ, 345.https://doi.org/10.1136/bmj.e8105.
11. Garrison, T. M., & Williams, C. C. (2013). Impact of relevance and distraction on driving performance and visual attention in a simulated driving environment.
Appl Cogn Psychol, 27(3), 396–405.https://doi.org/10.1002/acp.2917. 12. Haigney, D. E., Taylor, R. G., & Westerman, S. J. (2000). Concurrent mobile
(cellular) phone use and driving performance: Task demand characteristics and compensatory processes.Transport Res F: Traffic Psychol Behav, 3(3), 113–121.https://doi.org/10.1016/S1369-8478(00)00020-6.
13. Hair, J. F., Black, W. C., Babin, B. J., & Anderson, R. E. (2010).Multivariate Data Analysis. New Jersey: Prentice Hall.
14. Harbluk, J. L., Noy, Y. I., Trbovich, P. L., & Eizenman, M. (2007). An on-road assessment of cognitive distraction: Impacts on drivers’visual behavior and braking performance.
Accid Anal Prev, 39(2), 372–379.https://doi.org/10.1016/j.aap.2006.08.013.
15. Hedlund, J., Simpson, H., & Mayhew, D. (2006). Summary of Proceedings and Recommendations. Presented at the international conference on distracted driving. Ottawa: The Traffic Injury Research Foundation, The Canadian Automobile Association.
16. Horberry, T., Anderson, J., Regan, M. A., Triggs, T. J., & Brown, J. (2006). Driver distraction: The effects of concurrent in-vehicle tasks, road environment complexity and age on driving performance.Accid Anal Prev, 38(1), 185–191.
https://doi.org/10.1016/j.aap.2005.09.007.
17. Hoyle, R. H. (2012).Handbook of structural equation modeling. New York: The Guilford Press.
18. Kaber, D. B., Liang, Y., Zhang, Y., Rogers, M. L., & Gangakhedkar, S. (2012). Driver performance effects of simultaneous visual and cognitive distraction and adaptation behavior.Transportation research part F: traffic psychology and behavior, 15(5), 491–501.https://doi.org/10.1016/j.trf.2012.05.004. 19. Killingsworth, M. A., & Gilbert, D. T. (2010). A wandering mind is an unhappy
mind.Science, 330(6006), 932–932.https://doi.org/10.1126/science.1192439. 20. Kline, R. B. (2011).Principles and practice of structural equation modeling. New
York: The Guilford Press.
21. Lajunen, T., & Summala, H. (2003). Can we trust self-reports of driving?
Effects of impression management on driver behaviour questionnaire responses Transportation research part F: traffic psychology and behaviour, 6, 97–107.
https://doi.org/10.1016/S1369-8478(03)00008-1.
22. Lansdown, T. C., Stephens, A. N., & Walker, G. H. (2015). Multiple driver distractions: A systemic transport problem.Accid Anal Prev, 74, 360–367.
https://doi.org/10.1016/j.aap.2014.07.006.
23. Lei, M., & Lomax, R. G. (2005). The effect of varying degrees of nonnormality in structural equation modeling.Struct Equ Model Multidiscip J, 12(1), 1–27.
https://doi.org/10.1207/s15328007sem1201_1.
25. Liu, Z. F., Fu, R., & Lan, Z. (2016). The Comparison between Visual Distraction and Cognitive Distraction. In COTA International Conference of
Transportation Professionals 2016 (pp. 1525–1535).https://doi.org/10.1061/ 9780784479896.139.
26. Martens, M. H., & Brouwer, R. F. T. (2013). Measuring being lost in thought: An exploratory driving simulator study.Transport Res F: Traffic Psychol Behav, 20, 17–28.https://doi.org/10.1016/j.trf.2013.04.002.
27. McEvoy, S. P., Stevenson, M. R., & Woodward, M. (2006). The impact of driver distraction on road safety: Results from a representative survey in two Australian states.Injury Prevention, 12(4), 242–247.https://doi.org/10.1136/ip. 2006.012336.
28. Missokefalou, E., & Eliou, N. (2012). Recording and evaluation procedure of drivers’distraction: The case of Thessaloniki ring road.Procedia Soc Behav Sci, 48, 3159–3169.https://doi.org/10.1016/j.sbspro.2012.06.1282. 29. Neyens, D. M., & Boyle, L. N. (2007). The effect of distractions on the crash
types of teenage drivers.Accid Anal Prev, 39(1), 206–212.https://doi.org/10. 1016/j.aap.2006.07.004.
30. Neyens, D. M., & Boyle, L. N. (2008). The influence of driver distraction on the severity of injuries sustained by teenage drivers and their passengers.
Accid Anal Prev, 40(1), 254–259.https://doi.org/10.1016/j.aap.2007.06.005. 31. Olson, R. L., Hanowski, R. J., Hickman, J. S., & Bocanegra, J. (2009).Driver
distraction in commercial vehicle operations. No. FMCSA-RRT-09-042. Blacksburg, VA: Federal Motor Carrier Safety Administration.
32. Qu, W., Ge, Y., Xiong, Y., Carciofo, R., Zhao, W., & Zhang, K. (2015). The relationship between mind wandering and dangerous driving behavior among Chinese drivers.Saf Sci, 78, 41–48.https://doi.org/10.1016/j.ssci.2015.04.016. 33. Ranney, T. A., Garrott, W. R., & Goodman, M. J. (2001). NHTSA driver
distraction research: Past, present, and future. No. 2001-06-0177. SAE technical paper, 2001.
34. Reason, J. T., Manstead, A. S. R., Stradling, S. G., Baxter, J. S., & Campbell, K. (1990). Errors and violations on the road: A real distinction?Ergonomics, 33, 1315–1332.
35. Reed, M. P., & Green, P. A. (1999). Comparison of driving performance on-road and in a low-cost simulator using a concurrent telephone dialling task.
Ergonomics, 42(8), 1015–1037.https://doi.org/10.1080/001401399185117. 36. Singh, S. (2015).Critical Reasons for Crashes Investigated in the National
Motor Vehicle Crash Causation Survey. No. DOT HS 812 115 traffic safety facts crash•stats. Washington, DC: National Highway Traffic Safety Administration. 37. Song, X., & Wang, X. (2012). Mind wandering in Chinese daily lives–an
experience sampling study.PLoS One, 7(9), e44423.https://doi.org/10.1371/ journal.pone.0044423.
38. Stutts, J. C., Reinfurt, D. W., Staplin, L., & Rodgman, E. A. (2001).The role of driver distraction in traffic crashes. Washington D. C: AAA Foundation for Traffic Safety.
39. Tijerina, L., Johnston, S., Parmer, E., Winterbottom, M. D., & Goodman, M. (2000).Driver distraction with wireless telecommunications and route guidance systems. No. HS-809 069. East liberty, OH: Department of Transportation, National Highway Traffic Safety Administration.
40. Treat, J. R., Tumbas, N. S., McDonald, S. T., Shinar, D., Hume, R. D., Mayer, R. E. , Stansifer, R. L., & Castellan, N. J. (1979).Tri-level study of the causes of traffic accidents: final report. No. DOT HS 805 099. Bloomington, IN: Institute for Research in Public Safety.
41. Werneke, J., & Vollrath, M. (2012). What does the driver look at? The influence of intersection characteristics on attention allocation and driving behaviour.Accident Analysis & Prevention, 45, 610–619.https://doi.org/10. 1016/j.aap.2011.09.048.
42. Wierwille, W. W., Hanowski, R. J., Hankey, J. M., Kieliszewski, C. A., Lee, S. E., Medina, A., & Dingus, T. A. (2002).Identification of driver errors: overview and recommendations. No. FHWA-RD-02-003. United States: Federal Highway Administration.
43. World Health Organization. (2018).Global status report on road safety 2018. Geneva: World Health Organization.
44. Young, K. L., Mitsopoulos-Rubens, E., Rudin-Brown, C. M., & Lenné, M. G. (2012). The effects of using a portable music player on simulated driving performance and task-sharing strategies.Appl Ergon, 43(4), 738–746.https:// doi.org/10.1016/j.apergo.2011.11.007.
45. Young, K. L., Salmon, P. M., & Cornelissen, M. (2013). Distraction-induced driving error: An on-road examination of the errors made by distracted and undistracted drivers.Accid Anal Prev, 58, 218–225.https://doi.org/10.1016/j. aap.2012.06.001.
46. Young, K., & Regan, M. (2007). Driver distraction: A review of the literature. In I. J. Faulks, M. Regan, M. Stevenson, J. Brown, A. Porter, & J. D. Irwin (Eds.),Distracted driving(pp. 379–405). Australasian College of Road Safety: Sydney, NSW. Publisher’s Note