O R I G I N A L P A P E R
Open Access
Intelligent personalized ADAS warnings
Maria C. Panou
Abstract
Purpose:Advanced Driver Assistance Systems (ADAS) have been among the key innovations in the automotive market for over a decade, since they promote traffic safety. This tendency is strengthened even more lately, with the introduction of the autonomous vehicles. A plethora of ADAS exist in the market today, using common
warning thresholds for all drivers. However, since we are not all driving the same way, by offering common systems for all the drivers, neither the acceptance nor the effectiveness levels of ADAS are optimal. This manuscript
attempts to optimize the Collision Avoidance System (CAS) warning, through intelligent personalized algorithms.
Methods:Starting with the identification of the dynamic parameters for driving behaviour modeling on the longitudinal road axis, the personalization parameters for ADAS are derived that form the basis for the algorithms developed. Also, based on literature studies, the safety boundaries for warning provision by the CAS are set and implemented in the algorithms.
Results:Specific personalized algorithms for the longitudinal road axis behaviour are developed, based on Time to Collision and Time Headway. The proposed algorithms based on Time Headway were assessed on-road with 10 drivers and were positively evaluated by the majority of the participants, with a varying degree of reliability and usability.
Conclusions:Based on the results obtained, it can be concluded that with the proposed algorithms, the initial hypothesis of the paper is verified, i.e. personalised warnings would get a greater acceptance by the drivers, of course without braking the safety limits. Further improvements of the algorithm could be achieved, possibly through a better determination of the car following event, since its definition includes a few assumptions.
Keywords:ADAS, Intelligent personalised algorithms, Collision avoidance system, Time to collision, Time headway, Reaction time
1 Introduction
Traffic safety is the key issue when designing Advanced Driver Assistance Systems (ADAS). Such systems are de-veloped by the vehicle manufacturers to operate the same with all drivers, neglecting the personal driving characteristics, driving style or performance of each driver. However, since we are not all driving the same way, neither their acceptance rate nor their effectiveness level are supported by offering common systems to all the drivers. For example, although a collision avoidance system may be useful for a driver, it could be proven irri-tating or distracting for another and even increase his/ her workload level while driving, thus reducing the traf-fic safety. Also, an important issue to be considered with
ADAS is the behavioural adaptation that compensates the additional safety aspects. Thus, intelligent systems that adapt their functionality according to the individual needs of each driver may constitute an advantageous so-lution, both from the driver and the road safety perspectives.
Intelligent warning algorithms are presented in this paper that promote the personalization of the function-ality of the Collision Avoidance System (CAS). These al-gorithms are based on dynamic parameters that play a key role in the determination of the personal driving style of each driver. The parameters selected are the re-action time and time headway, or alternatively the time to collision, for reasons explained below.
Correspondence:[email protected]
Centre for Research and Technology Hellas–Hellenic Institute of Transport, Egialias 52, Athens, Greece
2 Personalisation parameters for ADAS–The need
To arrive to a totally personalized driver support system, such a system would need to know certain driver attri-butes, preferences as well as the context of use. These parameters are clustered into the following three cat-egories [1]:
Static: These parameters need to be determined
once by the driver and don’t change while the system is activated. Examples of such parameters are the driving experience, the language the driver speaks, any disabilities he/she might have, etc.
Semi-dynamic: These are the parameters that need
to be defined at the start of a new trip, unless they remain the same with the previous trip. Main parameters in this category are the destination, the reason for travelling (e.g. emergency, commuter to work), etc.
Dynamic: Such parameters are calculated
automatically by the system, based on which it adapts its output accordingly. They may be continuously altered and updated when the system is activated. There are 7 dynamic parameters for driving behaviour modeling on the longitudinal road axis that the proposed system uses. Six of them are automatically calculated by the car itself or from sensors; only the reaction time is measured through an algorithm.
Parameter 1: Speed (m/s)
Parameter 2: Time instant of driver’s braking (s)
Parameter 3: Time instant of frontal vehicle braking (s)
Parameter 4: Global Position System (GPS)Time (s)
Parameter 5: Time to Collision (TTC)
Parameter 6: Time headway (T_headway)
Parameter 7: Reaction time
Section 3 below presents the personalization algo-rithms for two of the most critical dynamic parameters, namely TTC and T_headway. Below, the need for using personalized thresholds for the ADAS operation is ex-plained, for parameters 5, 6 and 7.
2.1 Time to collision
This parameter is defined as the time until the collision of a vehicle to the leading one, given that the speed of both vehicles remains the same as the one they have on the given time instant. This time is infinite if the leading vehicle travels with a higher speed than its preceding one.
Groeger et al. summarized the mental factors that affect the distance perception, according to literature, as follows [2]: (a) drivers with smaller reaction time tend to
underestimate more the required TTC; (b) the familiar-ity of the observer with a distant object, so as the most familiar objects are perceived to be placed further than where they actually are, in relation with the unfamiliar objects. A computer-based experiment described by Cavallo et al. showed that the underestimation of TTC is at the level of 20–30% [3]. The characteristics of the road also affect the TTC, since with a richer driving scene the participants perceived the collision earlier in time. High speed cause generally higher TTC values, thus indicating that a collision becomes perceivable later in time. In a study by Van der Horst, where drivers had to brake in order to stop in time at a stopped vehicle, the TTC was found to increase slightly (and linearly) at the moment that the braking pedal was pressed [4].
An experiment based on a driving simulator that was realized within a research project, namely ADVISORS, aimed at evaluating the effects of different activation cri-teria (different TTC thresholds) for a frontal collision warning system [5]. As time activation criteria, 4 s and 6 s were used alternatively for TTC, according to the de-celeration rate accepted by the driver. For a warning be-fore dangerous turns the majority of the drivers preferred to get a premature warning (that requires braking with a deceleration of 2 m/s2). On the contrary, for warnings in relation to a leading vehicle, the criterion TTC < 6 s. and a maximum acceptable deceleration of 4 m/s2 were favored. Summarizing, most drivers pre-ferred to be warned rather earlier, however there were big variations in the preferences among drivers, suggest-ing the need for personalization of the warnsuggest-ing system.
2.2 Time headway
Time Headway is defined as the time until the collision of a vehicle to the leading one, given that its velocity re-mains the same as in the specific time instant and the second one decelerates with infinite deceleration (i.e. it remains at its current position the given time instant).
In a driving simulator experiment that took place within IN-ARTE project, with 32 drivers on a driving simulator, it was found that by comparing driving with/ without the CAS, the Time Headway of the “average” drivers was increased more with the CAS than that of the elderly drivers [6].
In addition, at the IN-ARTE driving simulator experi-ment that was described above, it was found that the collision warning functionality of CAS, avoided all the possible collisions, whereas with this functionality deac-tivated, 14 collisions were observed. Furthermore, the measured Time Headways were less without the CAS functionality in rural roads and motorways, in contrary with the system on, where the Time Headways were sig-nificantly bigger. These results are depicted in Table 1
below:
Dingus et al. found the Time Headway increased by 0.5 s. when the warning by the CAS was provided with an adequate interface [8]. Moreover, it was proven that acoustical warnings were less effective in relation to the optical ones for Time Headway increase.
2.3 Reaction time
The reaction time is the sum of the time needed for mental processing and the time needed to act as decided [9]. This time differs a lot among people, due to personal behaviour, capabilities, age, etc. thus, significant varia-tions are observed among drivers, ranging from 0.6 s for a professional driver to 0.8–1 s. for a “mean”driver, and up to 1.5–2 s. for some elderly drivers. Bigger reaction times are recorded in drowsy drivers.
Moreover, it has been observed that the user’s accept-ance of warnings provided by advaccept-anced driver assistaccept-ance systems (ADAS) is related to the provision time. Thus, if the driver is warned late by an ADAS, in order to brake quickly, due to its critical distance from the vehicle ahead, an accident might occur, while if the warning comes earlier than it should, the driver will receive a big number of warnings. This might cause driver’s irritation and rejection of the system. As an example, at the IN-ARTE tests, the system that was tested used the thresholds by the manufacturers, which led to a great
number of warnings (1 warning per minute for highways and 2 warnings in urban roads). Thus, the warning thresholds based on the reaction time were proposed to be modified, mainly for those drivers that were receiving too many warnings.
3 Proposed algorithms based on time headway or time to collision
Many frontal collision avoidance systems use as activa-tion criterion just the Time Headway (T_headway) or the Time to Collision (TTC). Both values are calculated by the vehicle electronic system, using the data (speed and distance to the leading vehicle) measured by the ve-hicle sensors. When TTC or T_headway becomes less than a predefined value (TTClimitor T_headwaylimit), the system warns the driver. Furthermore, there are systems that use different TTC warning thresholds for different types of warnings/actions (e.g. TTClimit≤4 s. for a sim-ple optical warning; TTClimit≤2.5 s. for acoustical warn-ing; TTClimit≤1.5 s. for automatic vehicle braking, etc. [9]. However, adopting a common TTClimit or T_head-waylimit for all drivers is erroneous and may be proven disturbing (for drivers used to drive nearer to the leading vehicle) and even dangerous (for a very slow driver).
The personalized TTClimit or T_headwaylimit is de-fined as the mean value of the minimum TTC or T_Headway values for each car following event and is noted as mean(minTTC) and mean(minT_Headway)
respectively.
3.1 Algorithm for TTClimit
Considering as car following event each case when TTC≤4 s. [10], the nearest position of the vehicle to the frontal one can be determined per case (each car follow-ing event i starts when TTC≤4 s. and ends when TTC > 4 s.). The minimum TTC that has been measured is de-noted as (minTTC)i. The overall mean(minTTC) is the mean of each(minTTC)i wherei= 1, …, Ν. For the ini-tιal calculation of(meanTTC)i at least 10 car following events have to be collected (Ν= 10). The calculation for-mula for themean(minTTC)is:
mean minTTCð Þ ¼
XN
i¼1
minTTC
ð Þi
N ð1Þ
According to literature, the mean value of a safe TTC for a car following situation is 1.5 to 2 s [11].
Threshold A: It determines the maximum value of the personalized TTC for a meaningful warning (above TTC = 4 s. there is no car following event).
Table 1Time Headways of drivers on a simulator with/without the CAS activated, in different overtaking scenarios [6]
Driving scenario With CAS on With CAS off
Time Headways in motorways (sec.)
Overtaking a convoy of low-speed cars and car following on the left lane
4.18 4.00
Overtaking a low-speed vehicle 4.18 3.86
Time Headways in rural roads (sec.)
Overtaking a low-speed vehicle that brakes 2.34 1.90
Overtaking a stopped vehicle 3.36a 1.90a
2.57b 1.92b
Overtaking a stopped vehicle and meeting another one
2.24 1.31
Overtaking a low-speed vehicle 2.31 1.74
a
middle-aged drivers
b
If mean minTTCð Þ≥4;then
TTClimit¼4 ð
2aÞ
Threshold B: It determines the personalized value of TTC.
If 4>mean minTTCð Þ≥1:5; then
TTClimit ¼mean minTTCð Þ ð2bÞ
Threshold C: It determines the minimum value of the personalized TTC in order to keep a safety level.
If mean minTTCð Þ<1:5; then
TTClimit ¼1:5 ð2cÞ
The formulas presented above signify that the least possible TTC that can be acceptable (i.e. that it is con-sidered safe) by the system is 1.5 s., even if the mean minimum TTC of the driver is less. Also, the maximum TTC for providing a warning is 4 s., even if the mean minimum TTC is higher.
3.2 Algorithm for T_headwaylimit
The personalized threshold mean(minT_Headway) can be calculated, where the car following event is deter-mined for T_headway≤2 s. [10]. Similarly to TTC, for the initιal calculation of (meanT_headway)i at least 10 car following events are collected (Ν= 10). The calcula-tion formula for themean(minT_headway)is:
mean minT headwayð Þ ¼
XN
i¼1
min T headway
ð Þi
N
ð3Þ
Threshold A: It determines the maximum value of the personalized T_headway for a meaningful warning.
If mean minT headwayð Þ≥2; then
T headwaylimit¼2 ð
4aÞ
The minimum value of a safe T_headway for car fol-lowing situation, according to literature, is 0.7–1 s. [11].
Thereshold B: It determines the personalized value of T_headway.
If 2>mean min T headwayð Þ≥0:7; then
T headwaylimit ¼mean minT headwayð Þ ð
4bÞ
Threshold C: It determines the minimum value of the personalized T_headway in order to keep a safety level.
If mean minT headwayð Þ<0:7; then T headwaylimit ¼0:7
ð4cÞ
Similarly to TTC, the least possible T_headway that is considered safe by the system is 0.7 s., even if the mean minimum T_headway of the driver is less. Also, the
maximum T_headway is 2 s., even if the mean minimum T_headway of the driver is bigger (above T_headway = 2 s. there is no car following situation).
4 Algorithm evaluation
The T_headway algorithms presented above (4a)-(4c) were evaluated with 10 drivers in real driving conditions. A research vehicle was used for this purpose, which is a Lancia Thesis 2.4 20 V Emblema, equipped with cameras and sensors for the recording and calculation of the re-quired parameters. The systems relevant to the specific experiment are listed below:
– The Electronic Control Unit, which is one of the main components of the vehicle. It reads data from the standard in vehicle CAN network and the vehicle sensors and actuators and processes it, as requested.
– Obstacles detection radar across the longitudinal axis that sends information on the leading vehicle (distance, relevant speed/acceleration) to the Electronic Control Unit.
– GPS.
The reason that TTC algorithms were not imple-mented in the vehicle is that T_headway is a more stable measurement than TTC, as the later depends upon the behaviour of the leading vehicle. More specifically, TTC calculation depends on the relevant speed of the ego ve-hicle and the leading veve-hicle, while T_headway takes into account only the ego vehicle speed and the distance be-tween the vehicles, both of which are provided directly by the vehicle and its sensors (radar and ego vehicle CAN bus). The frontal vehicle speed however is a dis-tance derivative, thus introduces errors.
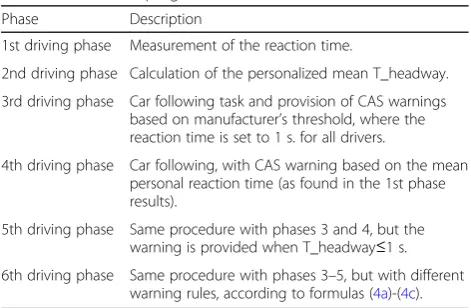
The evaluation programme is composed of 6 testing phases. The target of each testing phase is described in the following table (Table2):
Table 2Evaluation program
Phase Description
1st driving phase Measurement of the reaction time.
2nd driving phase Calculation of the personalized mean T_headway.
3rd driving phase Car following task and provision of CAS warnings based on manufacturer’s threshold, where the reaction time is set to 1 s. for all drivers.
4th driving phase Car following, with CAS warning based on the mean personal reaction time (as found in the 1st phase results).
5th driving phase Same procedure with phases 3 and 4, but the warning is provided when T_headway≤1 s.
During the 1st driving phase, specific trials were real-ized aiming to measure the personal reaction time of each participant, using the Lancia Thesis vehicle. Details on the measurements follow in paragraph 4.1.
The aim of the 2nd driving phase was to calculate the personal T_headway of each driver. As in phase 1, the participants were asked to follow the leading vehicle.
The test participants were first introduced the CAS warnings at the 3rd phase of the testing procedure, where an acoustical warning was generated based on the predefined thresholds by the manufacturer, using the re-action time of 1 s. The calculation formula that is used by the OEM is the following [12]:
Sw¼VeRTþVe2=2De−Vl2=2Dl ð5Þ
Sw = Warning distance (m) Ve = Vehicle speed (m/s)
RT = Reaction time (1 s default value by the OEM) De = Vehicle deceleration (m/s2)
Vl = Leading vehicle speed (m/s) Dl = Leading vehicle deceleration (m/s2)
The driving duration was 30 min and according to the scenario the driver of the Lancia Thesis should follow the leading vehicle (also participating at the trials). The drivers were asked to perform at least 3 car following manouevres. It was clarified that they drive with the sup-port of the CAS, which responds the same to all drivers, i.e. it is not adapted to the driving style of each driver.
The driving procedure during the 4th driving phase is the same as above. Warnings are given using the calcula-tion formula (5), but the default reaction time of 1 s used by the OEM is replaced by the actually measured personal RT of each driver (at the1st driving phase).
At the next driving phase (5th), the system warnings are given when T_headway≤1 s. which is the threshold used by another car manufacturer.
At the final driving phase, warnings are extracted based on formula 6 and the parametermean(minT_headway) is calculated from the 2nd phase.
After the end of the on-road test, the participants filled a questionnaire for each driving phase, focusing on the timing that the warnings were provided, in order to in-vestigate their opinion and preferences.
4.1 Personal reaction time measurements
The reaction time measurements were performed with both an optical and acoustical stimulus. The optical stimulus was placed on the central mirror. The drivers had to break immediately after a red LED was ON, while a second LED, of orange colour could also be activated (placed next to the red one), in which they should not react. In this way, the familiarisation of the driver to the stimulus was avoided, or at least reduced. The acoustical stimulus was provided to the driver by means of a simu-lated rumble strips noise, after which the driver had to break as quickly as possible. Both types of stimuli were provided randomly. On average, there were 10 optical and 10 acoustical stimuli provided to each driver. The reaction time is the time taken for each driver from the in-stant that the stimulus was activated (event triggering) until he/she started braking the car. Looking at the personal re-action times calculated (as listed in Tables 3and 4), there are significant variations among drivers and this is a further justification of the importance of the proposed personalized algorithms for ADAS warnings. Full details and results of the 1st phase reaction time tests can be found in [13].
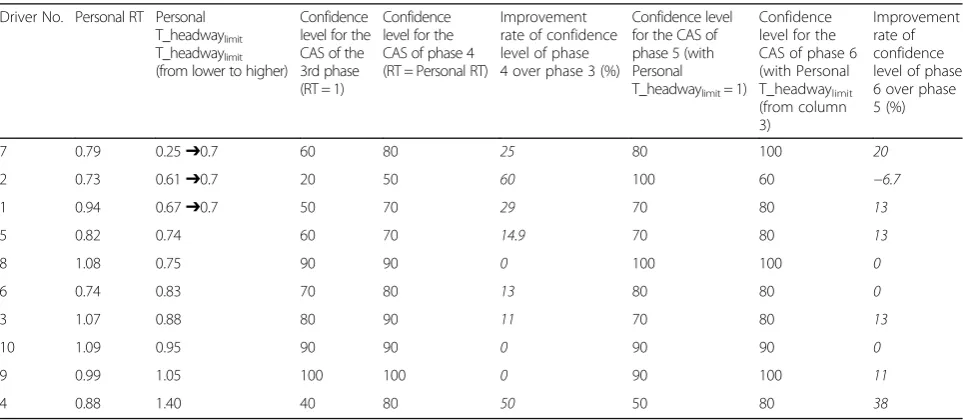
Table 3Comparative results of the total confidence level per user and driving phase with the CAS
DriverΝο. Personal RT Personal T_headwaylimit T_headwaylimit (from lower to higher)
Confidence level for the CAS of the 3rd phase (RT = 1)
Confidence level for the CAS of phase 4 (RT = Personal RT)
Improvement rate of confidence level of phase 4 over phase 3 (%)
Confidence level for the CAS of phase 5 (with Personal T_headwaylimit= 1)
Confidence level for the CAS of phase 6 (with Personal T_headwaylimit (from column 3) Improvement rate of confidence level of phase 6 over phase 5 (%)
7 0.79 0.25➔0.7 60 80 25 80 100 20
2 0.73 0.61➔0.7 20 50 60 100 60 −6.7
1 0.94 0.67➔0.7 50 70 29 70 80 13
5 0.82 0.74 60 70 14.9 70 80 13
8 1.08 0.75 90 90 0 100 100 0
6 0.74 0.83 70 80 13 80 80 0
3 1.07 0.88 80 90 11 70 80 13
10 1.09 0.95 90 90 0 90 90 0
9 0.99 1.05 100 100 0 90 100 11
5 Results
The test participants were questioned if the distance from the leading vehicle will be positively affected (i.e. towards road safety enhancement), using the CAS of each driving phase. The results per driving phase are depicted in Fig.1below.
The overall results image shows that nearly all drivers believe that the distance they keep from the leading ve-hicle will indeed change. The system of the 4th driving phase has clearly a higher preference over that of the 3rd, as well as the system of the 6th over the 5th driving phase. The most positively scored system is that of the 4th driving phase.
The drivers were questioned if they felt safe and if they trust the system so as to use it on a daily basis.
Figure2presents the results for the four driving phases. The responses related to the 3rd driving phase refer to the actual system of that phase, whereas the responses of the rest three driving phases refer to the comparison of each system with that of the 3rd phase. The most positively rated systems are those of the 4th and 6th driving phases (since they have the lowest mean scor-ing, i.e. representing the replies closer to ‘Definitely yes’).
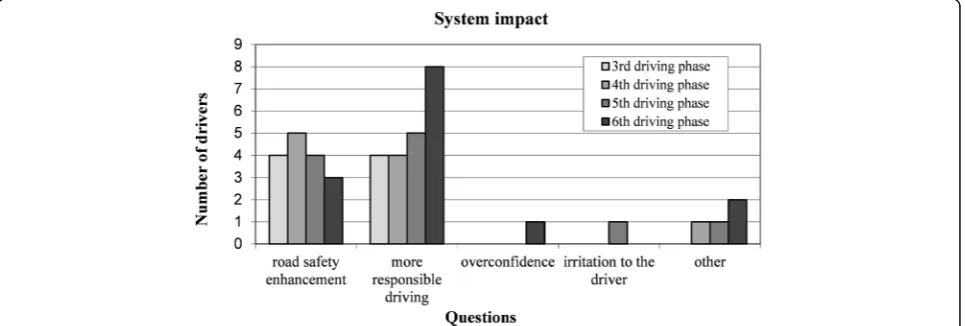
The participants’ opinions on the system impacts are presented in Fig.3, based on pre-defined choices or free comments (multiple-choices were possible). Nearly half of the participants seem to agree that the CAS will sup-port a more responsible driving, followed by an increase in road safety.
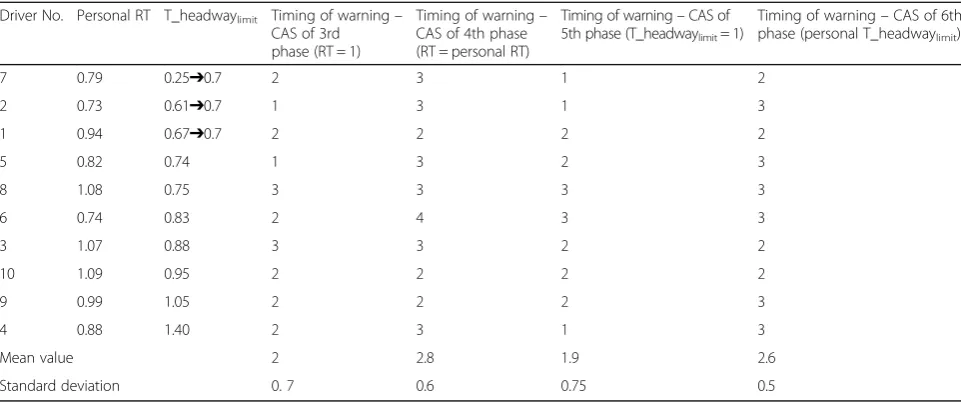
Table 4Comparative results on the timing of the warnings given by the CAS per system/phase
Driver Nο. Personal RT T_headwaylimit Timing of warning– CAS of 3rd phase (RT = 1)
Timing of warning– CAS of 4th phase (RT = personal RT)
Timing of warning–CAS of 5th phase (T_headwaylimit= 1)
Timing of warning–CAS of 6th phase (personal T_headwaylimit)
7 0.79 0.25➔0.7 2 3 1 2
2 0.73 0.61➔0.7 1 3 1 3
1 0.94 0.67➔0.7 2 2 2 2
5 0.82 0.74 1 3 2 3
8 1.08 0.75 3 3 3 3
6 0.74 0.83 2 4 3 3
3 1.07 0.88 3 3 2 2
10 1.09 0.95 2 2 2 2
9 0.99 1.05 2 2 2 3
4 0.88 1.40 2 3 1 3
Mean value 2 2.8 1.9 2.6
Standard deviation 0. 7 0.6 0.75 0.5
Ranking scale is from 1: much earlier, to 5: much later
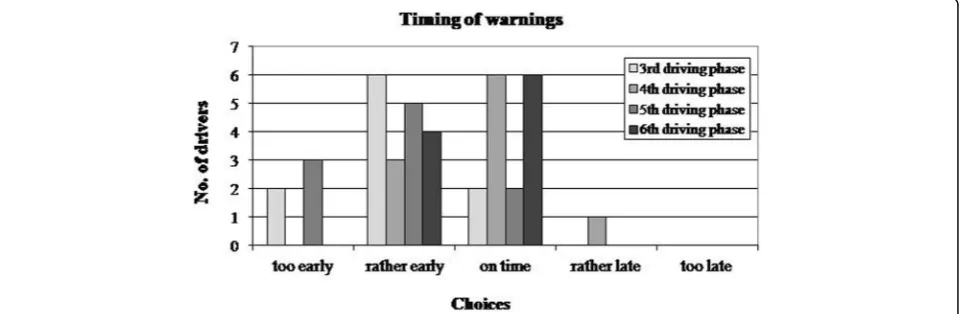
The drivers were asked if the warnings they received were more reasonable, comparing the system of the 3rd driving phase to the systems of phases 4–6. A positive feedback was received for the systems of phases 4 and 6, whereas a neutral result was given by the majority of the participants for the comparison between the systems of the 5th and 3rd phases (Figs.4,5 and6); the later signi-fies the correct judgment of the drivers since the two non-personalized systems received a similar scoring.
Regarding the timing of the warnings, 6 out 10 users stated that the warnings from the personalized systems of the 4th and 6th driving phases arrived at the right time, while fewer users thought that they were provided earlier. For the systems of the 3rd and 5th phases, simi-lar results were obtained, indicating that the warning ar-rived‘rather early’or‘too early’.
The confidence levels of the users for the systems of each driving phase are presented in the following figure (mean values).
The highest scorings belong to the systems of the 6th and 4th driving phases. For the 6th phase, the standard deviation is small (9.5), meaning that the individual users scores are not far from the mean value (ranging from 80 to 100%). Also, the standard deviation for the 4th phase is small (9.5). However, although the percentage of the 3rd phase is quite high, the standard deviation is big (25), thus there is a significant variation in the opinions of the users.
6 Discussion
Summarizing the above results for the different CAS al-gorithms that were tested by the participants, there is a clear preference on the personalized systems of phases 4 and 6, over those of phases 3 and 5. Variations in the re-plies of the drivers are due to the different perception, preference and driving style (i.e. personal T_headway) of each driver. The following table (Table 3) presents the users opinions on the confidence level for each system/ Fig. 2Comparative results of the mean scoring regarding the safety that the drivers feel and the trust they have on the CAS for the four
driving phases
phase, in comparison to their personal T_headwaylimit. Data is presented following the ordering of the lowest T_headwaylimitfirst.
The drivers with an extreme T_headwaylimit (grey cells), i.e. those that drive either too close or too far away from the leading vehicle, have a higher preference (higher improvement rates of the user’s confidence level over the system) for a personalized system (with only ex-ception driver no. 2 in terms of his T_headwaylimit) than the drivers that drive near to the average value (T_head-way = 1 s.), thus near to the current default value of the warning limit. This observation was expected. The ar-rows that appear in the first three ar-rows indicate that the warning threshold for T_headwaylimitwas changed to 0,7 by the algorithm, because the personalized values of the three drivers were below the safety threshold.
However, since out of 10 persons of a random sample, at least 4 can be considered to deviate significantly from the
‘average driver’regarding their behavior on the longitudinal
road axis, such personalized systems seem to have a big ap-plication range. It is also worth noting that 6 drivers with RT near the average of 1 s. (drivers no. 3, 5, 6, 8, 9, and 10) for the specific trial have a T_headwaylimitnear to 1 s. (this is considered as an average value by the manufacturers). However, this observation cannot be generalized, due to the limited sample size.
The users’ opinion on the timing of the warnings, in relation to their T_headwaylimit, is presented in Table4. The mean values of the ranking (in a 5-scale ranking) per driving phase indicate that the warnings from the CAS systems of phases 3 and 5 were given rather early. For the personalized systems of the phases 4 and 6, the mean values are very near to 3, meaning that the warn-ings were found to be given at the appropriate time.
7 Conclusion
The personalization of driver warnings from an in-vehicle CAS (for the longitudinal road axis) has been achieved in Fig. 4Results for the users’opinion on the warnings comparing the system of the 3rd driving phase to those of the phases 4–6
two ways: using the mean RT and the mean(minT_head-way). It can be clearly observed that both personalized al-gorithms have a higher preference rate over the relevant non-personalized ones. Comparing the two personalized algorithms, they achieved similar reliability scorings (80% for the algorithm based on the mean RT and 84% for the one that uses themean(minT_headway)).
From a practical point of view, the personalization using the reaction time is difficult to implement, as it needs the calculation of the RT of each driver using an optical and acoustical stimuli, i.e. a prior trial with each driver is needed in order to adjust the system thresholds accordingly. If further research for a reliable and auto-mated measurement way for the dynamic RT could be achieved (thus being able to safely and reliably repro-duce real driving scenarios on the road with imminent braking events, without the knowledge of the driving participants) the personalization would be highly signifi-cant. Such an achievement could furthermore be used for the simultaneous personalization of various ADAS warnings where the driver’s reaction time is needed.
The personalization based on the mean(minT_head-way)is easy and exact, since the T_headway (on the con-trary to the TTC) is determined from the vehicle and sensors data (as recorded in the vehicle CAN bus), i.e. its speed and distance to the leading vehicle (calculated from the frontal radar of the CAS), without needing an approxi-mate calculation of the deceleration of the leading vehicle. Therefore, the T_headway based personalization is pos-sible and can be achieved automatically and reliably in every vehicle with a CAS, without needing the interfer-ence of the driver or other person. Further improve-ments of the algorithm could be achieved, possibly through a better determination of the car following event, since its definition includes a few assumptions
about the T_headway (or TTC) starting and ending time instants.
However, the results obtained allow us to conclude that for both algorithms the initial hypothesis of the paper is verified, being the fact that personalized warn-ings would get a greater acceptance by the drivers, of course without braking the safety limits. Future efforts and developments of ADAS should take into account the personalization issues discussed in this paper, as road safety will be greatly enhanced by offering such systems adapted to personal human factors, i.e. the driving style and individual needs of each driver. With the introduc-tion of the autonomous vehicles in research and the markets, such intelligent personalized algorithms may be extended to hand-over strategies between driver and ve-hicle at SAE automation level 3, to be optimally follow-ing the particular driver characteristics and abilities.
Abbreviations
ADAS:Advanced driver assistance systems; CAS: Collision avoidance system; GPS: Global positioning system; RT: Reaction time; T_headway : Time headway; TTC: Time to collision
Acknowledgements
This research has been supported partially by the Hellenic Institute of Transport (of the Centre for Research and Technology Hellas) that provided its equipped research vehicle Lancia Thesis for the realization of the on-road algorithms assessment.
Funding
The study presented is part of a PhD study, thus there was no direct external funding.
Availability of data and materials
The data that support the findings of this study are available from the corresponding author, upon reasonable request.
Authors’contributions
Competing interests
The author declares that she has no competing interests.
Publisher’s Note
Springer Nature remains neutral with regard to jurisdictional claims in published maps and institutional affiliations.
Received: 4 May 2018 Accepted: 25 September 2018
References
1. Panou M (2008) PhD dissertation‘advanced personalized travelers’warning and information system. Aristotle University of Thessaloniki
2. Groeger JA, Carsten OMJ, Jamson BE (1999) Speed and distance estimation under simulated conditions. In: Gale et al (eds) Vision in Vehicle VII. Elsevier 3. Cavallo V, Mestre D, Berthelon C (1997) Time-to-collision judgments: visual
and spatio-temporal factors. In: Rothengatter/Vaya (ed) Traffic and Transport Psychology, pp 97–111
4. Van der Horst (1991) Time-to-collision as a cue for decision-making in braking. In: Gale et al (eds) Vision in vehicles III, pp 19–26
5. Bekiaris E. et al. (2001) ADVISORS Deliverable 3/8.1v4 Compendium of existing Insurance schemes and Laws, risk analysis of ADA systems and expected driver behavioural changes. User awareness enhancement, dissemination report and market Analysis and ADAS marketing strategy. 6. Martens & van Winsum 1999ΤΝΟInternal Deliverable 7.1,“Activation
criteria and warning strategies: driving simulator results”.
7. Ben-Yaacov A, Maltz M, Shinar D (2002) Effects of an in-vehicle collision avoidance warning system on short- and long-term driving performance. Human Factors Ergonomics Society 44(2):335–342
8. DingusΤΑ, McGehee DV, Manakkal N, Jahns SK, Carney C, Hankey JM (1997) Human factors field evaluation of automotive headway maintenance/ collision warning devices. Hum Factors Medline MID: 9302889 39(2):216–229 9. Bekiaris E, Portouli E (1999) IN-ARTE Deliverable 4.1“Emergency detection
and handling strategies”
10. Brookhuis KA, De Waard D, Fairclough SH (2000) Defining criteria for driver impairment. Paper presented at the 4th International Conference on Fatigue and Transportation; coping with the 24 hour society, Fremantle, pp 19–22 11. Lerner ND, Kotwal BM, Loyns RD, Gardner-Bonneau DJ (1996) Preliminary
Human Factors Guidelines for Crash Avoidance Warning Devices (NHTSA DOT HS 808 342). COMSIS, Silver Spring
12. Lee SE, Knipling RR, DeHart MC, Perez MA, Holbrook GT, Brown SB, Stone SR, Olson RL (2004) Vehicle-based countermeasures for signal and stop sign violation. NHTSA, DOT HS 809 716, pp 98–111
![Table 1 Time Headways of drivers on a simulator with/withoutthe CAS activated, in different overtaking scenarios [6]](https://thumb-us.123doks.com/thumbv2/123dok_us/878097.1585280/3.595.57.290.556.715/headways-drivers-simulator-withoutthe-activated-different-overtaking-scenarios.webp)