doi:10.1155/2008/743103
Research Article
Optimal Features Subset Selection and Classification for
Iris Recognition
Kaushik Roy and Prabir Bhattacharya
Concordia Institute for Information Systems Engineering, Concordia University, Montreal, Quebec, Canada H3G 1M8
Correspondence should be addressed to Kaushik Roy,kaush [email protected]
Received 1 August 2007; Revised 19 November 2007; Accepted 11 March 2008
Recommended by Kenneth M. Lam
The selection of the optimal features subset and the classification have become an important issue in the field of iris recognition. We propose a feature selection scheme based on the multiobjectives genetic algorithm (MOGA) to improve the recognition accuracy and asymmetrical support vector machine for the classification of iris patterns. We also suggest a segmentation scheme based on the collarette area localization. The deterministic feature sequence is extracted from the iris images using the 1D log-Gabor wavelet technique, and the extracted feature sequence is used to train the support vector machine (SVM). The MOGA is applied to optimize the features sequence and to increase the overall performance based on the matching accuracy of the SVM. The parameters of SVM are optimized to improve the overall generalization performance, and the traditional SVM is modified to an asymmetrical SVM to treat the false accept and false reject cases differently and to handle the unbalanced data of a specific class with respect to the other classes. Our experimental results indicate that the performance of SVM as a classifier is better than the performance of the classifiers based on the feedforward neural network, thek-nearest neighbor, and the Hamming and the Mahalanobis distances. The proposed technique is computationally effective with recognition rates of 99.81% and 96.43% on CASIA and ICE datasets, respectively.
Copyright © 2008 K. Roy and P. Bhattacharya. This is an open access article distributed under the Creative Commons Attribution License, which permits unrestricted use, distribution, and reproduction in any medium, provided the original work is properly cited.
1. INTRODUCTION
There has been a rapid increase in the need of accurate and reliable personal identification infrastructure in recent years, and biometrics has become an important technology for the security. Iris recognition has been considered as one of the most reliable biometrics technologies in recent years [1, 2]. The human iris is the most important biometric feature candidate, which can be used for differentiating the individuals. For systems based on high quality imaging, a human iris has an extraordinary amount of unique details as illustrated inFigure 1. Features extracted from the human iris can be used to identify individuals, even among geneti-cally identical twins [3]. Iris-based recognition system can be noninvasive to the users since the iris is an internal organ as well as externally visible, which is of great importance for the real-time applications [4]. Based on the technology developed by Daugman [3,5–7], iris scans have been used in several international airports for the rapid processing of pas-sengers through the immigration which have preregistered their iris images. Iris technology has also been widely used in
several countries for various security purposes and by the United Nations High Commission for Refugees. The National Institute of Standards and Technology (NIST) has conducted a new technology development project for iris recognition, namely, theiris challenge evaluation(ICE) [8].
1.1. Main contributions
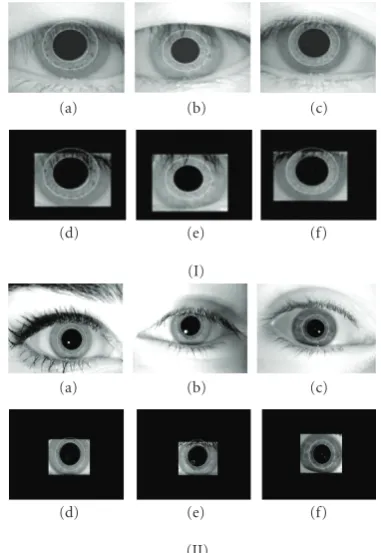
(a) (b) (c)
(d) (e) (f)
Figure 1: Samples of iris images from CASIA [12] and ICE [8] datasets.
The rest of this paper is organized as follows. InSection 2, we provide a brief description of our proposed approach. In Section 3, we describe the related work and some rele-vant background. Descriptions of iris image preprocessing, feature extraction, and encoding are given in Sections 4 and5, respectively. Section 6presents the feature selection strategy, andSection 7describes the classification process of iris patterns. Experimental results, comparisons with other methods, and discussions are reported inSection 8.Section 9 concludes the paper.
2. PROPOSED APPROACH: THE MAIN STEPS
Figure 2illustrates the main steps of our proposed approach. First, the imagepreprocessing step performs the localization of the pupil, detects the iris boundary, and isolates the collarette region, which is regarded as one of the most important areas of the iris complex pattern. The collarette region is less sensitive to the pupil dilation and usually unaffected by the eyelids and the eyelashes [13]. We also detect the eyelids and the eyelashes, which are the main sources of the possible occlusion. In order to achieve the invariance to the translation and the scale, the isolated annular collarette area is transformed to a rectangular block of fixed dimension, and then the normalized image is enhanced. The discriminating features are extracted from the transformed image, and the extracted features are used to train the SVM. The optimal features subsetis selected using MOGA to increase the matching accuracy based on the recognition performance of the SVM. The parameters of the SVM are tuned to improve the overall generaliza-tion performance. The tradigeneraliza-tional SVM is modified to an asymmetrical SVM, and it is applied for the iris pattern classification to treat the cases offalse accept orfalse reject differently. The classification accuracy of the proposed SVM is also compared with the feedforward neural network by using the backpropagation (FFBP), the feedforward neural network by using the Levenberg-Marquardt rule (FFLM), thek-nearest neighbor (k-NN), and the Hamming and the Mahalanobis distances.
3. BACKGROUND
3.1. Related work
The usage of iris patterns for the personal identification began in the late 19th century; however, the major investi-gations on iris recognition were started in the last decade. In [15], the iris signals were projected into a bank of basis vectors derived by the independent component analysis, and the resulting projection coefficients were quantized as features. A prototype was proposed in [16] to develop a 1D representation of the gray-level profiles of the iris. In [17], biometrics based on the concealment of the random kernels and the iris images to synthesize a minimum average correlation energy filter for iris authentication were formulated. In [5–7], the multiscale Gabor filters were used to demodulate the texture phase structure information of the iris. In [13], an iris segmentation method was proposed based on the crossed chord theorem and the collarette area. In [18], iris recognition technology was applied in mobile phones. In [19], correlation filters were utilized to measure the consistency of the iris images from the same eye. An interesting solution to defeat the fake iris attack based on the Purkinje image was depicted in [20]. An iris image was decomposed in [21] into four levels by using the 2D Haar wavelet transform, the fourth-level high-frequency informa-tion was quantized to form an 87-bit code, and a modified competitive learning neural network (LVQ) was adopted for classification. In [22], a modification to the Hough transform was made to improve the iris segmentation, and an eyelid detection technique was used, where each eyelid was modeled as two straight lines. A matching method was implemented in [23], and its performance was evaluated on a large dataset.
Iris image preprocessing Iris image Pupillary
localization
Localization of iris
Collarette area isolation
Eyelids, eyelashes, and noise detection
Normalization
Iris patterns classification
Optimal sequence of features Feature
selection
Feature
vectors Feature extraction
Normalized image
Figure2: Flow diagram of the proposed iris recognition scheme.
that analyzes the average Hamming distance between two codes. In [33], the performance of iris-based identification system was analyzed at the matching score level. A biometric system, which achieves the offline verification of certified and cryptographically secured documents called “EyeCerts” was reported in [34] for the identification of the people.
An iris recognition method was used in [35] based on the 2D wavelet transform for the feature extraction and direct discriminant linear analysis for feature reduction with SVM techniques as iris pattern classifiers. In [36], an iris recognition method was proposed based on the histogram of local binary patterns to represent the iris texture and a graph matching algorithm for structural classification. An elastic iris blob matching algorithm was proposed to overcome the limitations of local feature based classifiers (LFC) in [37], and in order to recognize the various iris images properly, a novel cascading scheme was used to combine the LFC and an iris blob matcher. In [38], the authors described the determination of eye blink states by tracking the iris and the eyelids. An intensity-based iris recognition system was presented in [39], where the system exploited the local intensity changes of the visible iris textures. In [40], the iris characteristics were analyzed by using the analytic image constructed by the original image and its Hilbert transform. The binary emergent frequency functions were sampled to form a feature vector, and the Hamming distance was deployed for matching [41, 42]. In [43], the Hough transform was applied for the iris localization, a Laplacian pyramid was used to represent the distinctive spatial characteristics of the human iris, and a modified normalized correlation was applied for the matching process. In [44], various techniques have been suggested to solve the occlusion problem that happens due to the eyelids and the eyelashes.
In [45], we developed an iris recognition method based on the SVM, where we used the information of the whole iris region for recognition, and a traditional SVM was used as iris pattern classifiers. However, in this paper, we propose a segmentation approach based on the collarette area localization, and the unique iris information between the collarette boundary and pupil boundary is used instead of using the complete information of the iris region for the recognition purpose. The traditional SVM used in [45] is modified in this paper to an asymmetrical SVM [11], and in order to reduce the computational cost, the parameters of SVM are tuned carefully [46]. We also propose a multi-objectives genetic algorithm (MOGA) to minimize the size
of features subset and the recognition error of the matching process. We provide a comparative analysis of some major existing works on iris recognition with our proposed scheme inTable 1.
From the above discussion, we may divide the existing iris recognition approaches roughly into four major categories based on feature extraction scheme, namely, the phase-based methods [5–7,26], the zero-crossing representation methods [16,31], the texture analysis-based methods [21,24,28,32, 43,47–49], and the intensity variation analysis [15,25,50] methods. Our proposed iris recognition scheme falls in the fourth category.
Wavelets are used to decompose the data in the iris region into components that appear at different resolutions. A number of wavelet filters, also called a bank of wavelets, are applied to the 2D iris region, one for each resolution with each wavelet a scaled version of some basis function. The output is then encoded in order to provide a compact and discriminating representation of the iris pattern. A Gabor filter is constructed by modulating a sine/cosine wave with a Gaussian. This allows providing the optimum conjoint localization both in space and frequency, since a sine wave is perfectly localized in frequency, but not localized in space. The decomposition of a signal is accomplished by using a quadrature pair of Gabor filters, with a real part specified by a cosine modulated by a Gaussian, and an imaginary part specified by a sine modulated by a Gaussian [14]. The real and imaginary filters are also known as the even symmetric and odd symmetric components, respectively. The center frequency is specified by the frequency of the sine/cosine wave, and the bandwidth of the filter is specified by the width of the Gaussian. Daugman [6] used a 2D version of Gabor filters in order to encode the iris pattern data. A 2D Gabor filter over the image domain (x,y) is represented as
G(x,y)=e−π[(x−x0)2/α2+(y−y0)2/β2]e−2π[u0(x−x0)+v0(y−y0 )], (1)
where (x0,y0) specifies the position in the image, (α,β) denotes the effective width and length, and (u0,v0) indi-cates the modulation, which has spatial frequency ω0 = (u2
0+v02) 1/2
. The odd symmetric and even symmetric 2D Gabor filters are shown inFigure 3.
Daugman [5] used polar coordinates for the normaliza-tion, and in polar form the filters are given by
Table1: Comparison of existing iris recognition approaches.
Iris recognition approaches Nature of feature Matching process Quality evaluation
Daugman [5] Binary features vector using
2D Gabor filters Hamming distance
Perfect recognition rate and provides a faster iris/pupil detection process
Wildes et al. [43]
Laplacian pyramid to represent the spatial characteristics of iris image
Normalized correlation
Matching process is time consuming. It may be suitable for identification phase not for recognition
Boles and Boashash [16] 1D signature
Two dissimilarity
functions: the learning and the classification
Relatively low recognition rate, high EER, faster matching process, simple 1D feature vector
Ma et al. [49]
1D real-valued feature vector with the length of 384
Nearest feature line Relatively slow featureextraction process
Ma et al. [48]
1D real-valued feature vector with the length of 160
Weighted Euclidean distance
Lower recognition rate and higher EER
Ma et al. [24]
A feature vector of length 1536 using a bank of spatial filters
Nearest center classifier for classification
Higher recognition rate and lower EER, extra cost for feature reduction
Ma et al. [25]
1D integer-valued feature vector with the length of 660
XOR operation Very good recognition rate and lower EER
Lim et al. [21] 1D binary vector of length
87 LVQ neural network
Poor recognition rate and higher EER, relatively complicated classifier
Sanchez-Reillo and Sanchez-Avila [32] 1D signature, Euclidean and Hamming distances
Medium classification rate, simple 1D features
Liu et al. [22] 2D Gabor wavelets Hamming distance
Higher recognition rate on complicated dataset, medium EER
Liu et al. [23] 2D Gabor wavelets Hamming distance
Modified Hough transform is used for localization, relatively lower recognition rate
Proposed approach
Binary feature vector of length 470 and 504 on CASIA and ICE datasets, respectively, using 1D log-Gabor filters
Asymmetrical SVM
Faster feature extraction process, Relatively higher recognition rate with lower EER, extra cost for feature reduction using MOGA but suitable for dataset like ICE
where (α,β) is the same as in (1) and (r0,θ0) specify the center frequency of the filter. The demodulation and phase quantization process can be represented as
h{Re,Im}=sgn{Re,Im}
ρ
∅I(ρ,∅)e
−iω(θ0−∅)e−(r0−ρ)2/α 2
e−(θ0−∅)/β2
,
(3)
whereh{Re,Im}can be regarded as a complex-valued bit, whose
real and imaginary components are dependent on the sign of the 2D integral, and I(ρ,∅) is the raw iris image in a dimensionless polar coordinate system.
Gabor filters-based methods have been widely used as feature extractor in computer vision, especially for texture
x z
y
(a)
x z
y
(b)
Figure3: A quadrature pair of 2D Gabor filters. (a) Real component or even symmetric filter characterized by a cosine modulated by a Gaussian; (b) imaginary component or odd symmetric filter characterized by a sine modulated by a Gaussian [14].
scale. The frequency response of a log-Gabor filters is given as
G(f)=exp
−logf / f0
2
2logσ/ f0
2
, (4)
where f0 is the center frequency, and σ provides the bandwidth of the filter.
3.2. Rubber sheet model for unwrapping
Taking the effect of several deformations and inconsistencies such as the variation of the size of the iris images captured from different persons and even for irises from the same eye, the variation of iris and pupil centers due to the camera position, the camera-to-eye distance, the rotation of the camera, the head tilt, and the rotation of the eye within the eye socket into account, the annular collarette region is required to be transformed into a fixed dimension for further processing. Daugman’s rubber sheet model [6] is used in this paper to unwrap the iris ring into a rectangular block with the texture and with a fixed size. This process maps the detected collarette area from Cartesian coordinates, (x,y), to the normalized polar representation according to
I(x(r,θ),y(r,θ))−→I(r,θ), (5) with
x(r,θ)=(1−r)xp(θ) +rxz(θ), y(r,θ)=(1−r)yp+r yz(θ),
(6)
where I(x,y) is the collarette area, (x,y) are the original Cartesian coordinates, (xp,yp) denote the center coordinates
of the pupil, and (r,θ) are the corresponding normalized polar coordinates. The rubber sheet model considers the pupil dilation and the size inconsistencies to construct a normalized representation of the annular collarette area with the constant dimensions. In this way, the collarette area is modeled as a flexible rubber sheet anchored at the collarette boundary with the pupil center as the reference point.
3.3. Multiobjective optimization using
genetic algorithms
various factors such as the choice of genetic representation and operators, the fitness function, fitness-dependent selec-tion procedure, and the several user-determined parameters like population size, probability of mutation and crossover, and so on.
The feature subset selection presents a multicriterion optimization function, for example, number of features and accuracy of the classification in the context of practical applications such as iris recognition. Genetic algorithms suggest a particularly attractive approach to solve this kind of problems since they are generally quite effective in rapid global search of large, nonlinear, and poorly understood spaces [52]. The multiobjectives optimization problem consists of a number of objectives and is correlated with a number of inequality and equality constraints. The solution to a multiobjective optimization problem is expressed mathematically in terms of nondominated points, that is, a solution is dominant over another only if it has superior performance in all criteria. A solution is treated to be the Pareto optimal if it cannot be dominated by any other solution available in the search space [51]. The conflict between the objectives is regarded as a common problem with the multiobjective. Therefore, the most favorable Pareto optimum is the solution that offers the least objective conflict, since in general none of the feasible solutions allows simultaneous optimal solutions for all objectives [51, 53]. In order to find such solutions, classical methods are used to scalarize the objective vector into one objective, and the simplest of all classical techniques is the weighted sum method [52]. In this method, the objectives are aggregated into a single and parameterized objective through a linear combination of the objectives. However, the scaling of each objective function is used to setup an appropriate weight vector. It is likely that different objectives take different orders of magnitude. When the objectives are weighted to form a composite objective function, it is required to scale them appropriately so that each has more or less the same order or magnitude. Therefore, the solution found through this strategy largely depends on the underlying weight vector. In order to overcome such complexities, the Pareto-based evolutionary optimization has been used as an alternative to the classical techniques such as weighted sum method, where the Pareto dominance has been used to determine the reproduction probability of each individual. Basically, it consists of assigning rank 1 to the nondominated individuals and removing them from contention, then finding a new set of nondominated individuals, ranked 2, and so forth [52]. In this paper, our problem consists of optimizing two objectives: minimization of the number of features, and the error rate of the classifier. Therefore, we are concerned with the multiobjectives genetic algorithms (MOGA).
4. IRIS IMAGE PREPROCESSING
First, we outline our approach, and then we describe further details in the following subsections. The iris is surrounded by the various nonrelevant regions such as the pupil, the sclera, the eyelids, and also noise caused by the eyelashes, the eyebrows, the reflections, and the surrounding skin [15]. We
need to remove this noise from the iris image to improve the iris recognition accuracy. To do this, we initially localize the pupil and iris region in the eye image. Then, the collarette area is isolated using the parameters obtained from the localized pupil. We also apply the eyelashes, the eyelids, and the noise reduction methods to the localized collarette area. Finally, the deformation of the pupil variation is reduced by unwrapping the collarette area to form a rectangular block of fixed dimension [54].
4.1. Iris/pupil localization
The iris is an annular portion of the eye situated between the pupil (inner boundary) and the sclera (outer boundary). Both the inner boundary and the outer boundary of a typical iris can be taken as approximate circles. However, the two circles are usually not concentric [24,25]. We use the following approach to isolate the iris and pupil boundaries from the digital eye image.
(1) The iris image is projected in the vertical and hori-zontal directions to estimate approximately the center coordinates of the pupil. Generally, the pupil is darker than its surroundings; therefore, the coordinates corresponding to the minima of the two projection profiles are considered as the center coordinate values of the pupil (Xp,Yp).
(2) In order to compute a more accurate estimate of the center coordinate of the pupil, we use a simple intensity thresholding technique to binarize the iris region centered at (Xp,Yp). The centroid of the
resulting binary region is considered as a more accurate estimate of the pupil coordinates. We can also roughly compute the radius,rp, of the pupil from
this binarized region.
(3) Canny edge detection technique is applied to a circular region centered at (Xp,Yp) and with rp +
25. Then, we deploy the circular Hough transform to detect the pupil/iris boundary.
(4) In order to detect the iris/sclera boundary, we repeat step 3 with the neighborhood region replaced by an annulus band of a width R outside the pupil/iris boundary. The edge detector is adjusted to the vertical direction to minimize the influence of the eyelids.
(5) The specular highlight that typically appears in the pupillary region is one source of edge pixels. These can be generally eliminated by removing the Canny edges at the pixels that have a high intensity value. (For the ICE data-set, it is 245).Figure 5shows the localized pupils taken from the input iris images.
4.2. Collarette boundary localization
Collarette boundary
Collarette area
(a)
Collarette area is occluded by the eyelashes and the
upper eyelid
(b)
Figure4: (a) Circle around the pupil indicates the collarette region. (b) Collarette area is occluded by the eyelashes and the upper eyelid.
(a) (b) (c)
(d) (e) (f)
Figure5: Collarette area localization (a), (b), and (c) from CASIA iris dataset and (d), (e), and (f) from ICE dataset.
complex patterns, seeFigure 4, since it is usually less sensitive to the pupil dilation and less affected by the eyelid and the eyelashes. From the empirical study, it is found that collarette region is generally concentric with the pupil, and the radius of this area is restricted in a certain range [13]. The collarette area is detected using the previously obtained center value of the pupil as shown in Figure 5. Based on the extensive experimentation, we prefer to increase the radius of the pupil up to a certain number of pixels (see Section 8.1 for the experimental validation).
4.3. Eyelids, eyelashes, and noise detection
(i) Eyelids are isolated by first fitting a line to the upper and lower eyelids using the linear Hough transform. A second horizontal line is then drawn, which intersects with the first line at the iris edge that is closest to the pupil [14].
(ii) Separable eyelashes are detected using 1D Gabor filters, since a low output value is produced by the convolution of a separable eyelash with the Gaussian smoothing function. Thus, if a resultant point is smaller than a threshold, it is noted that this point belongs to an eyelash.
(iii) Multiple eyelashes are detected using the variance of intensity, and if the values in a small window are lower than a threshold, the centre of the window is considered as a point in an eyelash as shown in Figure 6.
(I)
(a) (b) (c)
(d) (e) (f)
(II)
(a) (b) (c)
(d) (e) (f)
Figure6: (I) CASIA iris images (a), (b), and (c) with the detected collarette area and the corresponding images (d), (e), and (f) after detection of noise, eyelids, and eyelashes. (II) ICE iris images (a), (b), and (c) with the detected collarette area and the corresponding images (d), (e), and (f) after detection of noise, eyelids, and eyelashes.
4.4. Normalization and enhancement
(I)
θ
r
(a)
(b)
White region denotes noise Black portion represents region of interestof the unwrapped iris image
(II) (a)
(c)
(b)
(d)
Figure7: (I) shows the normalization procedure on ICE dataset; (II) (a), (b) show the normalized images of the isolated collarette regions and (c), (d) indicate the enhanced images on the ICE dataset.
radius is at a particular angle. We build the normalized pattern by backtracking to find the Cartesian coordinates of data points from the radial and angular positions in the normalized pattern [3, 5,6]. The normalization approach produces a 2D array with horizontal dimensions of angular resolution, and vertical dimensions of radial resolution form the circular-shaped collarette area (SeeFigure 7I). In order to prevent non-iris region data from corrupting the normalized representation, the data points, which occur along the pupil border or the iris border are discarded. Figure 7II(a),(b) shows the normalized images after the isolation of the collarette area. Since the normalized iris image has relatively low contrast and may have nonuniform intensity values due to the position of the light sources, a local intensity-based histogram equalization technique, which helps to increase the subsequent recognition accuracy, is applied to enhance the normalized iris image quality.Figure 7II(c),(d) also shows the effect of enhancement on the normalized iris images.
5. FEATURE EXTRACTION AND ENCODING
5.1. Gabor wavelets
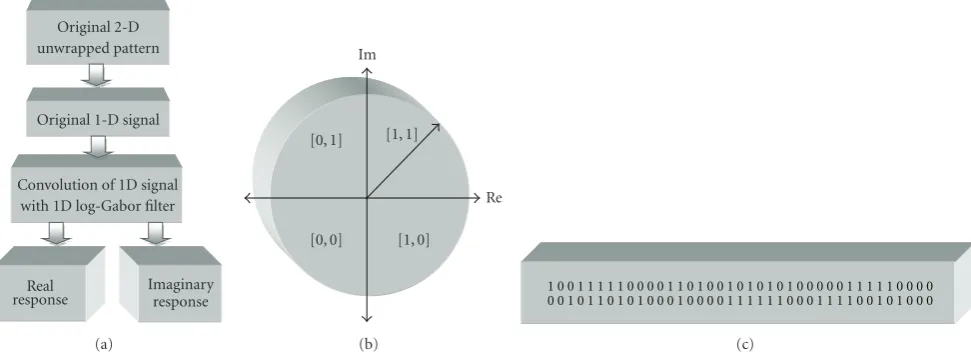
In order to extract the discriminating features form the normalized collarette region, the normalized pattern is convolved with 1D log-Gabor wavelets [14]. First, the 2D
normalized pattern is isolated into a number of 1D signals, and then these 1D signals are convolved with 1D Gabor wavelets. The phasequantization approach proposed in [5] is applied to four levels on the outcome of filtering with each filter producing two bits of data for each phasor. The desirable feature of the phase code is selected to be a grey code, where only a single bit changes while rotating form one phase quadrant to another, unlike a binary code. The encoding process produces a bitwise template containing a number of bits of information, and a corresponding noise mask, which corresponds to the corrupt areas within the collarette pattern and marks bits in the template as corrupt.
Since the phase information will be meaningless at regions, where the amplitude is zero, we mark these regions in the noise mask. The total number of bits in the template will be the double of the product of the angular resolution, the radial resolution, and the number of filters used. The feature extraction process is shown inFigure 8.
6. FEATURE SUBSET SELECTION USING MOGA
Original 2-D unwrapped pattern
Original 1-D signal
Convolution of 1D signal with 1D log-Gabor filter
Real response
Imaginary response (a)
Im
Re [0, 1] [1, 1]
[0, 0] [1, 0]
(b)
1 0 0 1 1 1 1 1 0 0 0 0 1 1 0 1 0 0 1 0 1 0 1 0 1 0 0 0 0 0 1 1 1 1 1 0 0 0 0 0 0 1 0 1 1 0 1 0 1 0 0 0 1 0 0 0 0 1 1 1 1 1 1 0 0 0 1 1 1 1 0 0 1 0 1 0 0 0
(c)
Figure8: Feature extraction and encoding process (a) feature extraction, (b) phase quantization, and (c) generated iris pattern.
1 1 1 1 0 00 1 0 1010 1 0 0 0 01 11 10 0 Feature 1st is selected
for SVM classifier
Feature 15th is not selected for SVM
classifier
Length of chromosome,l=feature dimension Figure9: Binary feature vector ofldimension.
Selection of optimal features using MOGA
Accuracy and number of features
SVM classifier Selected features
Figure10: Feature selection process.
solutions to be manipulated by the GAs, and each individual in the population represents a candidate solution to the feature subset selection problem. Ifmbe the total number of features available to choose to represent from the patterns to be classified (m = 600 in our case for both data-sets), the individual is represented by a binary vector of dimension,m. If a bit is a 1, it means that the corresponding feature is selected, otherwise the feature is not selected (See Figure 9). This is the simplest and most straightforward representation scheme [51]. In this work, we use the roulette wheel selection [51], which is one of the most common and easy to implement selection mechanism. Usually, there is a fitness value associated with each chromosome, for example, in a minimization problem, a lower fitness value means that the chromosome or solution is more optimized to the problem while, a higher value of fitness indicates a less optimized chromosome. Our problem consists of optimizing
two objectives:
(i) minimization of the number of features,
(ii) minimization of the recognition error rate of the classifier (SVM in our case).
Therefore, we deal with the multiobjectives optimization problem. In order to generate the Pareto optimal set, we apply the weighting method proposed in [55], which aggregates the objectives into a single and parameterized objective. Such an aggregation is performed through a linear combination of the objectives
Obj(y)=Obj1(y)×w1+ Obj2(y)×w2, (7) where wi denotes the weights and it is normalized to
wi =1 without losing the generality. Obj1(y) is the error rate produced by the classifier for a given feature subset (represented by the chromosome,y) and Obj2(y) denotes the number of features selected in the chromosome,y. Therefore, the fitness of a chromosome is represented by a single and parameterized objective function Obj(y). The feature subset selection using the MOGA involves the running of a genetic algorithm for several generations. In this paper, we prefer to use the wrapper approach based on the nature of the problem space. Regarding a wrapper approach, in each generation, evaluation of a chromosome (a feature subset) requires training the corresponding SVM and computing its accuracy. This evaluation has to be performed for each of the chromosomes in the population. Only the features in the parameter subset encoded by an individual are used to train the SVM classifier. The performance of the SVM classifier is estimated using a validation dataset and is used to guide the genetic algorithm as shown inFigure 10.
7. MULTICLASS ASYMMETRICAL SUPPORT VECTOR MACHINES AS IRIS PATTERN CLASSIFIERS
promising performance [10]. Support vector classifiers devise a computationally efficient way of learning good separating hyperplane in a high-dimensional feature space. In this work, we apply SVM to classify the iris pattern due to its outstanding generalization performance and promising performance as a multiclass classifier. In an SVM, a few important data points calledsupport vectors(SV) are selected on which a decision boundary is exclusively dependent. One problem persists with the traditional approach of SVM is that it does not separate the cases of false accept and false reject [56]. Therefore, we prefer to apply the asymmetrical SVM in order to treat the cases of false accept and false reject separately and to control the unbalanced data of a specific class with respect to the other classes. We summarize these steps below.
(1) Let us considerNsets of labeled input/output pairs
{xi,yi;i = 1,. . .,N} ∈ X × {+1,−1}, where X is the set of input data in RD and y
i represents the labels. The
SVM approach aims to obtain the largest possible margin of separation. The decision hyperplane can be expressed as
x·w+b=0. (8) (2) If all the training data satisfy the constraints, then
xi·w+b≥+1 for yi=+1, ∀i=1,. . .,N, xi·w+b≤ −1 for yi= −1, ∀i=1,. . .,N,
(9)
and the distance between the two hyperplanes is expressed as
2d=2
w, (10)
where, the distancedis considered as the safety margin of the classifier.
(3) Now, by combining (9) into a single constraint, we get
yi
xi·w+b≥1 ∀i=1,. . .,N. (11) In the training phase, the main goal is to find the SV that maximizes the margin of separation,d. Alternatively, a similar objective can be achieved if we minimizew2. Thus, the goal is to minimizew2subject to the constraint in (11). We can solve it by introducing Lagrange multipliersαi ≥0
and a Lagrangian
L(w,b,α)=1 2w
2−
N
i=1
αi
yi
xi·w+b−1, (12)
whereL(w,b,α) is simultaneously minimized with respect to
wandb, and maximized with respect toαi.
(4) Finally, the decision boundary can be derived as follows:
f(x)=w·x+b=
N
i=1
yiαi
x·xi+b=0. (13)
(5) If the data points are not separable by a linear separating hyperplane, a set of slack or relaxation variables
{ξ = ξ1,. . .,ξN}is introduced with ξi ≥ 0 such that (11)
becomes
yi
xi·w+b
≥1−ξi, ∀i=1,. . .,N. (14)
The slack variables measure the deviation of the data points from the marginal hyperplane. The new objective function to be minimized becomes
1 2w
2+C
i
ξi, subject to yi
xi·w+b≥1−ξi,
(15)
whereCis the user-defined penalty parameter that penalizes any violation of the safety margin for all the training data.
(6) In order to obtain a nonlinear decision boundary, we replace the inner product (x·xi) of (13) with a nonlinear
kernelK(x·xi) and get
f(x)=
N
i=1
yiαiK
x·xi+b. (16)
(7) In order to change the traditional SVM into an asymmetrical SVM, a constant g, which is called an asym-metrical parameter, is used. It is used to adjust the decision hyperplane. Thus (8) becomes
x·w+b+g=0. (17) (8) Therefore, the decision function of (16) changes to
f(x)=
N
i=1
yi∝iK
x,xi
+b+g, (18)
wheng >0, it indicates that the classification hyperplane is closer to positive samples. By changing the value ofg, the value of false accept can be reduced. We also compensate the statistically under-presented data of a class with respect to other classes by controlling the value of the penalty parameter,C.
The three basic kernels used in this paper are
Polynomial kernel:K(x,xi)=(1 +x·xi/σ2)p, p >0, Radial Basis Function (RBF) kernel: K(x,xi) =
exp{−x−xi2/2σ2}, and
Sigmoidal Kernel:K(x,xi)=1/(1 +e−x·xi+b/σ2).
7.1. SVM parameters tuning
as well as to adjust the parameters of the SVM. We briefly discuss the steps below.
After assigning the class label to the training data of the selected classes obtained by the parameter selection algorithm, we divide 70% of the training data of each class depending on the dataset used for training, and the rest of the training data is used for validation. The Fisher least square linear classifier is used with a low computation cost for each class [57]. The performance of this linear classifier is evaluated on the validation set, and the confusion matrix,
CM, is defined as follows:
CM=
⎛ ⎜ ⎜ ⎜ ⎜ ⎝
m11 m12 · · · m1n m21 m22 · · · m2n
..
. ... . .. ...
mn1 mn2 · · · mnn
⎞ ⎟ ⎟ ⎟ ⎟
⎠. (19)
Here, each rowicorresponds to the classwi, and each column j represents the number of classes classified to wj. The
number of misclassified iris patterns is estimated for each class as follows:
erri= n
j=1,j /=i
mi j, (20)
and then we sort the misclassified patterns, erri, i =
1, 2,. . .,n calculated from (20) in decreasing order, and the subscripts i1,i2,. . .,iI are assigned to the topI choices
assuming that I N. Now, we determine the number of classes whose patterns can be classified to the class set
{wi1,wi2,. . .,wiI}based on the following confusion matrix:
V=
I
k=1
wj|mi,j=/ 0
. (21)
From the class set V, we select the training and the cross validation set to tune C and the kernel parameters for the SVM. After a careful selection of C and the kernel parameters, the whole training set with all classes is trained.
8. RESULTS
We conduct the experimentation on two iris datasets, namely, the ICE (iris challenge evaluation) dataset created by the University of Notre Dame, USA [8], and the CASIA (Chinese Academy of Science—Institute of Automation) dataset [12]. The ICE dataset is divided into two categories: the “gallery” images, which are considered as good quality images, and the “probe” images, which represent iris images of varying quality. The iris images are intensity images with a resolution of 640×480. The average diameter of an iris is 228 pixels [8]. The ICE database consists of left and right iris images for experimentation. We consider only the left iris images in our experiments. There are 1528 left iris images corresponding to the 120 subjects in our experiments. The number of iris images for each person ranges from 2–5 in this database. We have also used the CASIA iris image dataset, and each iris class is composed of seven samples taken in two sessions, three in the first session and four
in the second. Sessions were taken with an interval of one month, which is a real world application level simulation. Images are 320 ×280 pixels gray scale taken by a digital optical sensor designed byNLPR[8]. There are 108 classes of irises in a total of 756 iris images. The experimentation is conducted in two stages: performance evaluation of the proposed approach and comparative analysis of our method with the existing approaches in the field of iris recognition. In the first stage of the experimentation, we emphasize on the performance evaluation of the current approach based on the classification and the matching accuracy. We evaluate our proposed method by comparing its recognition accuracy with the other classical classification methods and the match-ing strategies. We show the performance of the proposed genetic process for selecting the optimum features as well as to increase the overall system accuracy. The verification performance of the proposed approach is shown using a receiver operator characteristics(ROCs) curve. We exhibit the effect of false accept rate(FAR) and false reject rate (FRR) on different security requirements by changing the values of asymmetrical parameter for SVM. The FAR measures the probability of accepting an imposter as an authorized subject, and FRR is the probability of rejecting an authorized subject incorrectly. We also measure the performance with equal error rate (EER). During the second stage, we carry out a series of experimentation to provide a comparative analysis of our method with the existing methods in respect of recognition accuracy and computational complexity. We also show the average time consumption of the different parts of the proposed iris recognition system.
8.1. Performance evaluation of the proposed method
We evaluate the success rates for the proposed method on the CASIA and ICE datasets by detecting the pupil boundary and the collarette area. The obtained success rate is 99.86% on CASIA where the proposed algorithm failed to identify the pupil boundary in one case only. The success rate of the correct pupil detection on the ICE dataset is 97.70%. From the experimental results, it is found that a reasonable recognition accuracy is achieved when the collarette area is isolated by increasing the previously detected radius value of the pupil up to a certain number of pixels. A drop of matching error from 3.60% to 3.48% is observed in Figure 11(a)when the number of pixels is increased from 21 to 22. Therefore, we choose to increase the pupil radius up to 23 pixels because a stable matching accuracy of 96.50% is achieved in this case. We would like to mention here that in order to obtain an optimal value of collarette radius, SVM has been used to generate matching accuracy; however, MOGA is not applied in this case. FromFigure 11(b), it is found that if we increase the pixel values up to 26, we obtain the highest matching accuracy of 99.72% since a relatively stable accuracy is achieved in the range of pixels 25–27, and after this range, the matching accuracy reduces drastically.
30 25 20 15
10 5
Number of pixels increased 3.5
4 4.5 5 5.5 6 6.5 7
M
at
ching
er
ro
r
(%)
(a)
30 25
20 15 10 5
Number of pixels increased 0
0.5 1 1.5 2 2.5 3 3.5 4 4.5 5
M
at
ching
er
ro
r
rat
e
(%)
(b)
Figure11: Selection of optimal number of pixels to be increased to obtain the collarette boundary for (a) ICE and (b) CASIA datasets.
class label to a small number of selected candidates. For CASIA data set, 10 candidates are chosen, and the cumulative recognition accuracy at rank 10 is 99.90%. In this work, the selected cardinal number of set found from the experimen-tation by using the algorithm for SVM parameters tuning proposed in [46] is 24. As a result, the sizes of training and validation sets for selecting the optimal parameter for
C and γ are 118 (= 24∗7∗70%) and 50 (= 24∗7∗30%), respectively. The parameterγis set at 0.65 andCat 20 when the highest accuracy on validation set has been achieved with the RBF kernel. The SVM parameters are also tuned for the ICE iris dataset. For the ICE dataset, we apply again the Fisher least square linear classifier, and 20 candidates are chosen [36]. The cumulative recognition accuracy at rank 20 is 98.84%. In this paper, the selected cardinal number of sets found from the experimentation is 32 by using the tuning algorithm for SVM parameter selection. As a result, the sizes of the training and validation sets for selecting the optimal values of theC andσ2, are 112 (= 32∗5∗0.7) and 48 (= 32∗5∗0.3), respectively. The parameter σ2 is set at 0.40, and theCset at 100 when the highest accuracy on the validation set is achieved with the RBF kernel for the ICE iris dataset. In this paper, we consider only those classes of the ICE database that have at least 5 probe images in order to select the optimal parameter values. Table 2 shows the performance of different kernel functions. Since the highest classification accuracy is obtained by RBF kernel, this kernel is used in our system for the iris pattern classification.
In order to evaluate the matching accuracy, only the collarette area is used for recognition purpose instead of using the entire iris information. For each iris pattern of the CASIA data set, three irises taken in the first session are used to build the template and the remaining four irises of the second session for testing. For each person in the ICE database, one iris sample is used randomly from the gallery images to build the template. The remaining irises
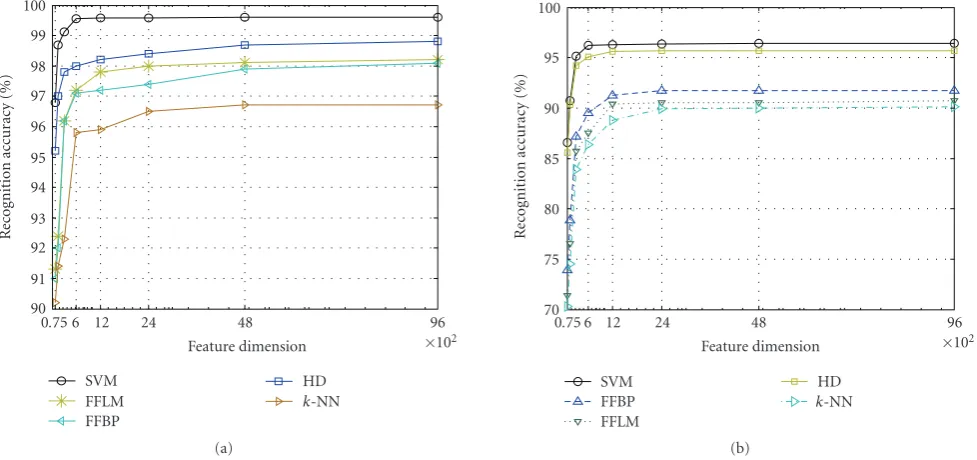
from the probe image set are used for testing. In order to show the effectiveness of SVM as a classifier, we also provide the extracted features as input to the FFBP, the FFLM, and thek-NN for classification, and the accuracy of the classifiers for various numbers of classes among the FFBP, the FFLM, the SVM, and thek-NN (k=3) are shown in Figures12(a), 12(b)for the size of 600 features subset. Several experiments are conducted, and the optimal values of the parameters for FFBP and FFLM are set as found inTable 3.
Later the principal component analysis (PCA) [57] is used to reduce the dimension of the extracted feature vectors and only the 50-bit feature sequence is used to measure the classification performance of the SVM with the Mahalanobis distance classifier (MDC) [57] along with the other classic methods as shown in Figure 13. Dimension reduction is required due to the smaller available sample sizes, which are not suitable for the classification by using the Mahalanobis distance. From Figures12and13, it is observed that that the performance of the SVM as an iris classifier is better than the other classical methods though the classification accuracy is decreased as number of classes is increased.Figure 14shows the comparison of the feature dimension versus recognition accuracy among the hamming distance (HD), the FFBP, the FFLM, thek-NN, and the SVM. In this case, only the RBF kernel is considered due its reasonable classification accuracy for SVM as mentioned earlier. FromFigure 14, we can also see that with the increasing dimensionality of the feature sequence, the recognition rate also increases rapidly for all similarity measures. However, when the dimensionality of the feature sequence is up to 600 or higher, the recognition rate starts to level offat encouraging rates of about 99.62% and 96.21% on CASIA and ICE datasets, respectively.
108 100 90 80 70 60 50 40 30 20 10 5
Number of classes SVM
FFBP
FFLM k-NN 95
95.5 96 96.5 97 97.5 98 98.5 99 99.5 100
Classification
ac
cur
acy
(%)
(a)
120 90 70 50 30
10
Number of classes SVM
FFLM
FFBP k-NN 97
97.5 98 98.5 99 99.5 100
Classification
ac
cur
acy
(%)
(b)
Figure12: Comparison of the classification accuracy among SVM, FFBP, FFLM, andk-NN for 600-bit feature sequence: (a) CASIA dataset (b) ICE dataset.
108 100 90 80 70 60 50 40 30 20 10
Number of classes SVM
MDC FFBP
FFLM k-NN 55
60 65 70 75 80 85
Classification
ac
cur
acy
(%)
(a)
120 100 80
60 40 20 0
Number of classes SVM
FFBP FFLM
MDC k-NN 96
96.5 97 97.5 98 98.5 99 99.5 100
Classification
ac
cur
acy
(%)
(b)
Figure13: Comparison of the classification accuracy of SVM with FFBP, FFLM,k-NN, and MDC for 50-bit feature sequence: (a) CASIA and (b) ICE.
Table2
Kernel type Classification accuracy (%) in ICE dataset Classification accuracy (%) in CASIA dataset
Polynomial 91.1 95.2
RBF 94.3 97.4
Sigmoid 91.2 95.6
Table3
Parameters ICE dataset CASIA dataset
FFBP FFLM FFBP FFLM
No. of nodes in hidden layers 170 310 150 270
×102
96 48
24 12 6 0.75
Feature dimension SVM
FFLM FFBP
HD k-NN 90
91 92 93 94 95 96 97 98 99 100
R
ec
o
gnition
ac
cur
acy
(%)
(a)
×102
96 48
24 12 6 0.75
Feature dimension SVM
FFBP FFLM
HD k-NN 70
75 80 85 90 95 100
R
ec
o
gnition
ac
cur
acy
(%)
(b)
Figure14: Comparison of recognition accuracy of SVM with FFBP, FFLM,k-NN, and HD for different feature dimension: (a) CASIA dataset
and (b) ICE dataset.
150 140 120 100 80 60 40 20
Generation 99.5
95.55 99.6 99.65 99.7 99.75
A
ccur
acy
(%)
(a)
220 200 180 160 140 120 100 80 60 40 20
Generation 94.5
95 95.5 96 96.5 97
A
ccur
acy
(%)
(b)
Figure15: Variation of the recognition rates with generation: (a) CASIA dataset and (b) ICE dataset.
reasonable matching accuracy of 99.70% is achieved at the generation 110 for the CASIA dataset, and an accuracy of 96.42% is achieved at the generation of 150 for the case of ICE dataset. The evolution of the MOGA can be observed in Figure 16. It is noticeable form this figure that the MOGA represents a good convergence since average fitness of the population approaches that of the minimum individual along the generations. We conduct several experimentations, and the arguments of the MOGA are set as follows when the reasonable accuracy is obtained.
The recognition accuracy is compared between the proposed method using the information of collarette area and the previous approach of [45] where the whole iris informationbetween pupil and sclera boundary is considered
150 140 120 100 80 60 40 20 5
Generation Minimum fitness
Average fitness Maximum fitness 0
2 4 6 8 10 12 14 16
Fit
n
ess
values
(%)
(a)
220 200 180 160 140 120 100 80 60 40 20 5
Generation Minimum fitness
Average fitness Maximum fitness 2
4 6 8 10 12 14 16 18 20
Fit
n
ess
values
(%)
(b)
Figure16: Variation of the fitness values with generation: (a) CASIA dataset and (b) ICE dataset.
×102
96 48
24 12 6 0.75
Feature dimension Proposed approach without GA Proposed approach with GA Previous approach without GA Previous approach with GA 95
95.5 96 96.5 97 97.5 98 98.5 99 99.5 100
R
ec
o
gnition
ac
cur
acy
(%)
(a)
×102
96 48
24 12 6 0.75
Feature dimension Proposed approach without GA Proposed approach with GA Previous approach without GA Previous approach with GA 90
91 92 93 94 95 96 97
R
ec
o
gnition
ac
cur
acy
(%)
(b)
Figure17: Comparison of the recognition accuracies between the previous method and the proposed approach on (a) CASIA dataset, (b) ICE dataset.
Table4
Parameters ICE dataset CASIA dataset
Population size 120 (the scale of iris sample) 108 (the scale of iris sample)
Length of chromosome code 600 (selected dimensionality of feature sequence) 600 (selected dimensionality of feature sequence)
Crossover probability 0.61 0.65
Mutation probability 0.005 0.002
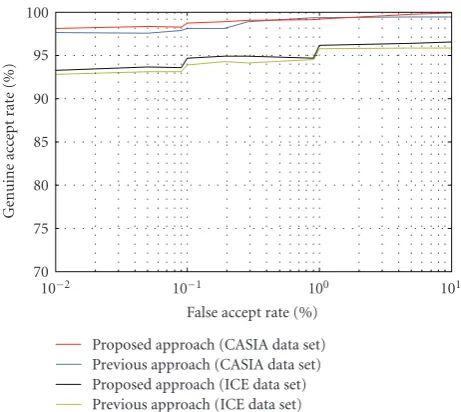
101
100
10−1
10−2
False accept rate (%) Proposed approach (CASIA data set) Previous approach (CASIA data set) Proposed approach (ICE data set) Previous approach (ICE data set) 70
75 80 85 90 95 100
Gen
u
ine
ac
ce
pt
ra
te
(%)
Figure18: ROC curve shows the comparison between GAR and FAR for our previous approach and proposed approach.
100
10−1
Value of asymmetrical parameter,g Proposed approach (ICE data set)
Previous approach (ICE data set) Proposed approach (CASIA data set) Previous approach (CASIA data set) 100
101
M
at
ching
er
ro
r
(%)
Figure 19: Comparison of recognition error between proposed method and our previous method [45] with different values of
asymmetrical parameter,g.
using ROC curve, see Figure 18, which demonstrates how thegenuine acceptance rate(GAR) changes with the variation in FAR for our previous and proposed methods. From the experimentation, we find that the proposed approach reduces the EER form 0.36% to 0.13% on CASIA and from 0.72% to 0.39% on ICE datasets, which represents a good improvement of our proposed method.Figure 19reveals that the proper selection of the asymmetrical parametergleads to a lower recognition error both in the cases of the proposed and in the previous schemes.
8.2. Comparison with existing methods
The methods proposed in (6, 7, 8), (53, 4), (22, 23), (35, 43), and (25, 27, 28) are the well-known existing approaches for the iris recognition. Furthermore, these methods are based on the phase, the texture analysis, and the zero-crossing representation of the iris. Therefore, we decide to compare our algorithm with these methods. We provide the recognition accuracies and time consumption of the proposed iris recognition scheme based on the ICE and CASIA datasets. We would like to point out here that the experimental results reported in Tables 5and 6have been implemented on the machines of different speed, and on the different datasets. Therefore, the results provided in Tables5and6may not be interpreted as a real comparison. However, we would also like to mention that the proposed scheme has been tested on the two data sets where ICE contains complicated iris data of varying image quality on a machine of higher speed. From Table 5, we see that methods reported in [6,25] have better performance than the proposed approach on CASIA dataset, followed by the methods in [16,22–24]. From this table, we can also see that the proposed scheme provides a better accuracy on ICE dataset than the methods proposed in [16,23]. We would like to point out here that the experimentation of [23] is carried out on ICE data set.
Table5: Recognition rates and equal error rates.
Methods Correct recognition rate (%) Equal error rate (%)
Daugman [6] 100∗ 0.08∗
Wildes et al. [43] — 1.76∗
Boles and Boashash [16] 92.64∗ 8.13∗
Ma et al. [24] 99.60 0.29
Ma et al. [25] 100 0.07
Liu et al. [22] 97.08 1.79
Liu et al. [23] 89.64 —
Roy and Bhattacharya [45] 99.56 0.36
Proposed method (ICE dataset) 96.43 0.39
Proposed method (CASIA dataset) 99.81 0.13
∗
These results were published in [25]; by using the bootstrap, authors approximately predict the recognition rates of these methods.
Table6: Computational complexities.
Methods Feature extraction (ms) Matching (ms) Feature extraction + Matching (ms) Others
Daugman [6] 682.5∗ 4.3∗ 686.8∗ —
Wildes et al. [43] 210.0∗ 401.0∗ 611.0∗ Registration
Boles and Boashash [16] 170.3∗ 11.0∗ 181.3∗ —
Ma et al. [24] 260.2 8.7 268.9 Feature reduction
Ma et al. [25] 244.2 6.5 250.7 —
Roy and Bhattacharya [45] 80.3 167.2 247.5 —
Proposed method (ICE dataset) 20.8 150.7 171.5 Feature reduction Proposed method (CASIA dataset) 20.3 130.4 150.7 Feature reduction
∗
These results were published in [25]; by using the bootstrap, authors approximately predict the computational complexities.
shows that our proposed approach significantly reduces the time consumption than our previous method of [45] where the experimentation was performed on CASIA data set. In [45], the Hough transform with Canny edge detection was employed for the segmentation. In this proposed scheme, we employ the Hough transform in a certain range to restrict the exhaustive search thereby reducing the time consumption. In Table 6, where the results of first five rows are taken from [25], we see that our current approach consumes less time than the method in [6,16,24,25, 43,45] if we take into account the feature extraction phase only. The reason is that our method is based on 1D signal analysis, and the other methods mostly deploy the 2D mathematical calculation. However, our approach takes much time for recognition as SVM is used for matching process. We can see from the experimentation that the overall time consumption is less than the other methods reported in Table 6. However, the experimental results reported in [25] for the methods proposed in [6,16,24,43] were achieved in a machine of 128 MB RAM running at 500 MHz speed.
Our current approach requires an extra cost as incurred in [24] for the feature reduction. The traditional feature selection schemes (like the principal component analysis, independent component analysis, singular valued decomposi-tion,etc.) require sufficient number of samples per subjects to select the salient features sequence. However, it is not always realistic to accumulate a large number of samples due
Table7: Time consumption of different parts of iris recognition system.
Methods Iris segmentation (ms) Normalization (ms) Feature extraction (ms) Matching (ms) Total (ms) Proposed approach (ICE dataset) 214580.0 37.7 20.8 150.7 214789.2 Proposed approach (CASIA dataset) 203471.0 16.3 20.3 130.4 203638.0
in this paper with MOGA. Table 7 shows the overall time consumption of the proposed approach on the two datasets.
8.3. Discussions
Based on the above experimentation, we may depict the following points.
(i) The proposed method can be considered as a local variation analysis method from the viewpoint of feature representation strategy as the phase infor-mation characterized by our representation scheme reflects the local shape feature of the collarette region. In general, the methods based on local variation analysis perform well than the other existing feature representation scheme called texture analysis-based method [24]. The main drawback of the latter method is that it does not capture the local fine changes of the iris since the texture usually represents the frequency information of a local region.
(ii) Though the collarette area is insensitive to the pupil dilation and less affected by the eyelids and the eyelashes, there might be few cases where this region is partially occluded since it is closed to pupil. Our proposed method of detecting the collarette area along with the eyelids, the eyelashes (both in the cases of the separable and the multiple eyelashes), and the noise removal techniques successfully overcome this problem, and this also helps to increase the overall matching accuracy.
(iii) We find from the experimental results that the selec-tion of SVM parameters contributes in improving the classification accuracy, especially when the number of classes is higher.
(iv) The tuned SVM with an additional asymmetrical parameter separates the FAR and the FRR accord-ing to different security demands and controls the unbalanced data with respect to other classes by changing the penalty parameter, C. It is found from the experimentation that the penalty for the computation of the asymmetrical SVM parameter is relatively small.
(v) From the experimentation, it seems that the asym-metrical SVM can be used commercially due its outstanding performance as multiclass classifier and also for those cases where the sample proportion is poorly balanced between two classes. Moreover, the proposed SVM is well suited when the number of samples per individual is relatively small as the case for ICE dataset.
(vi) From the experimentation, it is also observed that the feature selection method by using the MOGA increases the recognition accuracy and contributes in reducing the feature dimension. However, MOGA incurs extra cost in order to find the optimal features subset through several iterations. However, the proposed feature subset selection reduces the features set relatively as compared to the other feature reduction strategies reported recently in the existing iris recognition schemes.
(vii) The experimental results exhibit that the proposed algorithm performs reasonably well if we consider the accuracy.
(viii) Although one might think that the proposed method using the collarette area has lesser information avail-able as compared to the other methods using the complete iris information, the proposed method can be used effectively for personal identification since the collarette area contains enough discriminating features.
9. CONCLUSIONS
In this paper, a new iris recognition method is proposed using an efficient iris segmentation approach based on the collarette area localization with the incorporation of the eyelashes and the eyelids detection techniques. The 1D log-Gabor filters are used to extract the discriminating features, and MOGA is applied for the feature subset selection. In order to increase the feasibility of SVM in biometrics applications, it is modified to an asymmetrical SVM. The asymmetrical SVM with the collarette area localization scheme can be applied in wide range of security-related application fields. Experimental results exhibit an encour-aging performance as the accuracy is concerned especially on the ICE data set, which contains relatively nonideal iris data. A comparative analysis among the existing schemes of the iris recognition has been conducted. The performance evaluation and comparisons with other methods indicate that the proposed method is a viable and very efficient method for iris recognition. In future, the SVM boosting strategy can be employed to reduce the computational time of the overall iris recognition system.
ACKNOWLEDGMENTS
REFERENCES
[1] R. P. Wildes, “Iris recognition: an emerging biometrie tech-nology,”Proceedings of the IEEE, vol. 85, no. 9, pp. 1348–1363, 1997.
[2] A. Jain, R. Bolle, and S. Pankanti,Biometrics: Personal Identi-fication in a Networked Society, Kluwer Academic Publishers, Norwell, Mass, USA, 1999.
[3] J. Daugman, “Biometric personal identification system based on iris analysis,” 1994, US patent no. 5291560.
[4] T. Mansfield, G. Kelly, D. Chandler, and J. Kane, “Biometric product testing,”Final Report, National Physical Laboratory, Middlesex, U.K, 2001.
[5] J. G. Daugman, “High confidence visual recognition of per-sons by a test of statistical independence,”IEEE Transactions on Pattern Analysis and Machine Intelligence, vol. 15, no. 11, pp. 1148–1161, 1993.
[6] J. Daugman, “Statistical richness of visual phase information: update on recognizing persons by iris patterns,”International Journal of Computer Vision, vol. 45, no. 1, pp. 25–38, 2001. [7] J. Daugman, “Demodulation by complex-valued wavelets
for stochastic pattern recognition,” International Journal of Wavelets, Multiresolution and Information Processing, vol. 1, no. 1, pp. 1–17, 2003.
[8] http://iris.nist.gov/ICE/.
[9] D. E. Goldberg, Genetic Algorithms in Search, Optimization and Machine Learning, Addison-Wesley, Reading, Mass, USA, 1989.
[10] V. N. Vapnik,Statistical Learning Theory, John Wiley & Sons, New York, NY, USA, 1998.
[11] P. Ding, Z. Chen, Y. Liu, and B. Xu, “Asymmetrical support vector machines and applications in speech processing,” in Proceedings of the IEEE International Conference on Acoustics, Speech and Signal Processing (ICASSP ’02), vol. 1, pp. 73–76, Orlando, Fla, USA, May 2002.
[12] The CASIA dataset, http://www.sinobiometrics.com/english
/Iris%20Databases.asp.
[13] X. He and P. Shi, “An efficient iris segmentation method for recognition,” inProceedings of the 3rd International Conference on Advances in Patten Recognition (ICAPR ’05), vol. 3687 of Lecture Notes in Computer Science, pp. 120–126, Springer, Bath, UK, August 2005.
[14] L. Masek, Recognition of human iris patterns for biometrics identification, B. Eng. thesis, University of Western Australia, Perth, Australia, 2003.
[15] K. Bae, S. Noh, and J. Kim, “Iris feature extraction using independent component analysis,” in Proceedings of the 4th International Conference on Audio- and Video-Based Biometric Person Authentication (AVBPA ’03), vol. 2688, pp. 1059–1060, Guildford, UK, June 2003.
[16] W. W. Boles and B. Boashash, “A human identification technique using images of the iris and wavelet transform,” IEEE Transactions on Signal Processing, vol. 46, no. 4, pp. 1185– 1188, 1998.
[17] S. C. Chong, A. B. J. Teoh, and D. C. L. Ngo, “Iris authentication using privatized advanced correlation filter,” inProceedings of the International Conference on Advances on Biometrics (ICB ’06), vol. 3832 ofLecture Notes in Computer Science, pp. 382–388, Springer, Hong Kong, January 2006. [18] D. S. Jeong, H.-A. Park, K. R. Park, and J. Kim, “Iris
recognition in mobile phone based on adaptive Gabor filter,” inProceedings of the International Conference on Advances on Biometrics (ICB ’06), vol. 3832 ofLecture Notes in Computer Science, pp. 457–463, Springer, Hong Kong, January 2006.
[19] B. V. K. Vijaya Kumar, C. Xie, and J. Thornton, “Iris verification using correlation filters,” inProceedings of the 4th International Conference Audio- and Video-Based Biometric Person Authentication (AVBPA ’03), vol. 2688 ofLecture Notes in Computer Science, pp. 697–705, Guildford, UK, June 2003. [20] E. C. Lee, K. R. Park, and J. Kim, “Fake iris detection by using
purkinje image,” inProceedings of the International Conference on Advances on Biometrics (ICB ’06), vol. 3832 of Lecture Notes in Computer Science, pp. 397–403, Springer, Hong Kong, January 2006.
[21] S. Lim, K. Lee, O. Byeon, and T. Kim, “Efficient iris recog-nition through improvement of feature vector and classifier,” Electronics and Telecommunications Research Institute Journal, vol. 23, no. 2, pp. 61–70, 2001.
[22] X. Liu, K. W. Bowyer, and P. J. Flynn, “Experiments with an improved iris segmentation algorithm,” inProceedings of the 4th IEEE Workshop on Automatic Identification Advanced Technologies (AUTO ID ’05), pp. 118–123, Buffalo, NY, USA, October 2005.
[23] X. Liu, K. W. Bowyer, and P. J. Flynn, “Experimental evalua-tion of iris recognievalua-tion,” inProceedings of the IEEE Computer Society Conference on Computer Vision and Pattern Recognition (CVPR ’05), vol. 3, pp. 158–165, San Diego, Calif, USA, June 2005.
[24] L. Ma, T. Tan, Y. Wang, and D. Zhang, “Personal identification based on iris texture analysis,”IEEE Transactions on Pattern Analysis and Machine Intelligence, vol. 25, no. 12, pp. 1519– 1533, 2003.
[25] L. Ma, T. Tan, Y. Wang, and D. Zhang, “Efficient iris recogni-tion by characterizing key local variarecogni-tions,”IEEE Transactions on Image Processing, vol. 13, no. 6, pp. 739–750, 2004. [26] K. Miyazawa, K. Ito, T. Aoki, K. Kobayashi, and H. Nakajima,
“A phase-based iris recognition algorithm,” inProceedings of the International Conference on Advances on Biometrics (ICB ’06), vol. 3832 ofLecture Notes in Computer Science, pp. 356– 365, Springer, Hong Kong, January 2006.
[27] T. Moriyama, T. Kanade, J. Xiao, and J. F. Cohn, “Meticulously detailed eye region model and its application to analysis of facial images,”IEEE Transactions on Pattern Analysis and Machine Intelligence, vol. 28, no. 5, pp. 738–752, 2006. [28] C.-H. Park, J.-J. Lee, M. J. T. Smith, and K.-H. Park, “Iris-based
personal authentication using a normalized directional energy feature,” in Proceedings of the 4th International Conference on Audio- and Video-Based Biometric Person Authentication (AVBPA ’03), vol. 2688, pp. 224–232, Guildford, UK, June 2003.
[29] M. B. Pereira and A. C. P. Veiga, “Application of genetic algorithms to improve the reliability of an iris recognition system,” in Proceedings of the IEEE Workshop on Machine Learning for Signal Processing (MLSP ’05), pp. 159–164, Mystic, Conn, USA, September 2005.
[30] X. Qiu, Z. Sun, and T. Tan, “Global texture analysis of iris images for ethnic classification,” in Proceedings of the International Conference on Advances on Biometrics (ICB ’06), vol. 3832 ofLecture Notes in Computer Science, pp. 411–418, Springer, Hong Kong, January 2006.
[31] C. Sanchez-Avila, R. Sanchez-Reillo, and D. de Martin-Roche, “Iris-based biometric recognition using dyadic wavelet transform,”IEEE Aerospace and Electronic Systems Magazine, vol. 17, no. 10, pp. 3–6, 2002.
![Figure 1: Samples of iris images from CASIA [12] and ICE [8]datasets.](https://thumb-us.123doks.com/thumbv2/123dok_us/898014.1587337/2.600.74.268.71.228/figure-samples-iris-images-casia-ice-datasets.webp)