Abstract—Indoor air quality monitoring has attracted increasing attention with the rapid development of industrialization and urbanization in the modern society as people typically spend more than 80% of their time in indoor environments. A novel indoor air quality detector (IAQD) integrated with multiple communication interfaces has been designed, built, programmed deployed and tested in order to meet the requirements of wide variety of scenarios. The IAQD measures the indoor air quality data, including temperature, humidity, CO2, dust and formaldehyde timely. With state-of-the-art Internet of Things (IoT) technologies, the IAQD is integrated with Modbus, LoRa, WiFi, GPRS and NB-IoT communication interfaces, which enables to be applied to wired communications, short-range wireless communications, and remote transmission to the cloud. The designed software in cloud allows users to track the indoor air quality of their home or office or industries everywhere. The performance IAQD is evaluated in terms of packet loss rate and time delay. The evaluation of IAQD are demonstrated and analyzed within the office environment over a week. Experimental results show that the proposed system is effectiveness in measuring the air-quality status and provide excellent consistency and stability.
Index Terms—Indoor air quality (IAQ), Lora, NB-Internet of Things (IoT), Sensors, Interfaces
I. INTRODUCTION
ITH the rapid development in industrialization and urbanization, air pollution has become a critical problem all over the world, especially for developing countries. It is well-accepted that poor air quality is harmful to human health and induce respiratory diseases such as asthma. Basically, people considered that air pollution is exist outdoors, but the air in houses or offices, where we live and work, could also be polluted. Indoor Air Quality (IAQ) is the air quality within or around buildings, which relates to the health and comfort of building occupants closely.
Since people spend more than 80% daily time in indoor environment, and IAQ has become one of the most critical influence factor to the human health [1]. Indoor pollution affects
This research is supported by National Key Research and Development Project of China (No.2017YFC0704202), the National Natural Science Foundation of China (No.61803067) and EU H2020-MSCA-ITN-IOT4win (765921). (corresponding author :Liang Zhao, email: [email protected])
Liang Zhao is with with Key Laboratory of Intelligent Control and Optimization for Industrial Equipment of Ministry of Education, and school of
human health, where some health effects may show up shortly after a single exposure to pollutant. These include irritation of nose, eyes, and throat, headache, and so on[2]. Thus the demand
of a real time indoor air quality detector (IAQD) is rapidly increasing for monitoring air pollution effectively in living and working space before the situation becomes worse.
With the continuous development of IoT technology[3],
sensor technology and information communication technology (ICT), it is no longer difficult to monitor the environment in which people work and live at any time. So far, there are already a large number of researches related to this issue and try to develop proper device to monitor IAQ based on internet of thing (IoT) technology. Kumar et al.[4] developed a low cost
indoor pollution gas monitoring system. This monitoring system was based on a DSP microcontroller, which could measure the concentrations of CO and CO2 gases with ± 5%
variation to standard data. The main disadvantage of this research was the connection of the system to PC, and do not have the ability to connect to network. Preethichandra [5] in
2013 reported another monitoring system for IAQ based on Zigbee communication. As a disadvantage, the system only has one gas parameter, carbon dioxide, is monitored. Abraham in 2014 presented a low-cost indoor air quality monitoring system, which could collect six air quality parameters from different locations at the same time based on WSN [6]. Ahmed[7] in 2017
proposed a real-time system for monitoring CO and CH4 gases based on Intel Edison microcontroller Board, which increased the final cost of the system. Firdhous et al.[8] proposed an indoor
air monitoring, which is limited to O3 only, based on the IoT
technology. The designed device communicates with a gateway node over Bluetooth, which in turn communicates with the processing node via WiFi. Thang et al. proposed a battery-free smart-sensor for monitoring indoor air quality based on the ultra-high frequency (UHF) smart tag and radio frequency identification (RFID) reader, the communication distance can reach up to 250cm[2]. This research provides a new solution for
some situations where power supplies are difficult. After reviewing the published literature, it was identified that the communication technologies most used are Zigbee and WiFi
[9-control science and engineering, Dalian University of Technology, Dalian, 116024, China.
Wenyan Wu is with Faculty of Computing, Engineering and the Built Environment Birmingham City University, Birmingham UK. B4 7XG
Shengming Li is with School of Innovation and Entrepreneurship, Dalian University of Technology, Dalian, 116024, China.
Design and implementation of an IoT based
indoor air quality detector with multiple
communication interfaces
Liang Zhao, Wenyan Wu, Shengming Li
IEEE INTERNET OF THINGS JOURNAL
11]. Furthermore, most of the existing sensor working scenarios
are in buildings, have some detection points distributed in different rooms. Zigbee is used to compose an internal LAN and to publish data to the web via WiFi.
By analyzing the previous research work, we can find that the majority of existing IAQ support one or two communication interfaces, which can only be suitable for some of the specific application scenarios. For example, WiFi application must have a base station, it is difficult to communicate outdoors, and ZigBee technology can only be applied in a house because of its transmission distance and signal attenuation. therefore it will bring great benefits and values to design an indoor air quality detector that can support different communication interfaces to meet the various requirements of wired communications, near-range wireless communications, and long-distance communication to cloud platform.
In terms of sensor, we select dust sensor, which is used to monitoring PM2.5 and PM10 dust particles. Scientists have long pointed out that haze can significantly increase the risk of lung cancer, leading to a 1-year reduction in the average life expectancy of global residents [12]. Next is formaldehyde sensor,
it has been proved that formaldehyde is an important factor in inducing leukemia and one of the important causes of many diseases. Formaldehyde is classified as a type of carcinogen in the cancer list released by the World Health Organization's International Agency for Research on Cancer, in 2017. However, there is not much research on the indoor formaldehyde. The third is carbon dioxide (CO2) sensor, higher
concentrations of indoor CO2 will lead to low performance and
increased symptoms of health problems. Finally, the temperature and humidity sensor is also selected as usual, in order to monitor the comfort of people's working and living environments, as well as the impact of temperature and humidity on the parameters of the other three sensors.
The core objective of this paper is to provide an indoor air quality detector integrated multiple sensors and multiple communication modes so as to fait variety of indoor air quality monitoring systems. The main contribution of this paper is as following:
The experiment of sensor accuracy measurement in real physical scene is provided.
The performance of different communication interfaces are evaluated, including packet loss rate and time delay. The advantages and disadvantages of different
communication modes are compared and analyzed. The remainder of this paper is organized as follows. The communication technologies used in system are introduced in Section II briefly. The hardware design and software design of the indoor air quality monitoring system are discussed in detail in Section III. In Section IV analyzes experiment data and provides performance evaluation of the proposed system. Finally, this paper is conclude in Section V.
II. COMMUNICATION TECHNOLOGIES REVIEW
In this paper, an IAQD with many network communication interfaces is proposed to meet a variety of scenarios in practical applications, shown as in Fig.1.The system offers both wired
and wireless communication functions. The wired communication technology is Modbus via RS485 fieldbus, shown as in Fig.1-(a).Wireless communication technology can be divided into two types, one is short-range wireless communication technology, LoRa, and the other is long-distance transmission to the cloud platform, including GPRS, WiFi and NB-IoT, shown as in Fig.1-(b) and Fig.1-(c) respectively.
A. RS485 & Modbus
Although it has never been formally standardized, Modbus can certainly be a protocol that is seen as open and widely used in construction buildings, smart instrumentation, industry and other fields. Modbus protocol is a master and slave communication architecture, there is only one master node on the bus, all the other nodes are slave nodes. Modbus supports serial communication using a simple master–slave protocol over EIA-485. Each slave device has a unique address, and in general, approximately 247 different nodes are allowed to communicate on the bus at the same time[13]. In this paper, we
adopt Modbus mainly for two reasons. One is that Modbus, which is a low-cost, widely used wired communication technology, where wireless communication is not allowed, and the other is that the system can be free networking through Modbus protocol and connecting controllers, actuators and other devices.
B. LoRa technology
LoRa is a kind of ultra-long distance wireless transmission technology based on spread spectrum communication, which is one of the IoT communication technologies. Its name comes from the abbreviation of "Long Range". It can be seen from the name, the biggest feature of LoRa is the long distance communication. Lora's spread spectrum technology changes the balance between transmission power consumption and transmission distance, and completely changes the situation in the field of embedded wireless communication. It presents a new communication technology that enables long-distance, long battery life, large system capacity, and low hardware costs, which is what the Internet of Things (IoT) needs[14].
TABLEI
ZIGBEE AND LORA PERFORMANCE COMPARISON[17]
Technology Frequency band Rate Range Topology
LoRa
433MHz 868MHz 915MHz
0.3-50Kbps 15-20Km Star
Zigbee 2.4GHz 250Kbps 100m Mesh
Another widely used short-range wireless communication technology is ZigBee before LoRa, which has speed, low-power consumption, lower cost, support a large number of online nodes, support automatic networking and other functions. ZigBee technology is widely used in smart home, intelligent agriculture, building energy consumption monitoring and other fields[15, 16] . Table I lists the performance comparison between
clearly seen that Lora has better performance, which is why Lora is chosen as a short-range wireless network communication technology in this paper.
C. WiFi technology
WiFi is a popular IP-based wireless technology, which is equipped inside most homes, shopping malls and office buildings in the city. WiFi provides reliable, secure and high-speed communications. WiFi can use an existing wireless local area network and has no additional requirements for a private network. However, the communication range of WiFi is short in the order of 20m (indoor) to 100m (outdoor) [18]. This
characteristics makes WiFi available only for short-range data aggregation.
D. GPRS technology
GPRS stand for general packet radio service, which is well known as one of the world’s most deployed communication technology and is present even in the remote parts of the world. GPRS technology breaks the distance limit for communication between devices, and data collected in the field can be transmitted directly to the cloud or to the specified server. The advent of IoT cards makes GPRS communications widely used in the IoT industry chain in the M2M industry, such as environmental protection, digital Medicine, Remote Sensing survey, agriculture, forestry, water, and other fields.
Compared with Lora communication technology, GPRS has no communication distance limit, and on the other hand, compared with WiFi communication technology, GPRS does not need WiFi base station, communication can be achieved wherever there is a GPRS signal. However, GPRS communication also has its own defects, one is the need for a communication card, which brings a certain cost, the other is that the power consumption of GPRS communication is relatively high, the peak current can reach 2A during the process of communication with the base station, which limits its application in low-power applications.
E. NB-IoT technology
NB-IoT is an emerging communications technology in the IoT sector that supports cellular data connections for low-power devices in Wan, also known as low-power wide area networks (LPWAN)[19]. NB-IoT supports long standby times and wide
coverage, and will provide improved indoor coverage in the same frequency band compared to GPRS. NB- IoT has an existing network gain of 20dB, which is equivalent to the ability to increase the coverage area by 100 times; NB- IoT supports optimized network architecture and low-power operating modes. Nb- IoT terminal modules can be up to 10 years of standby time and are highly competitive in low-power monitoring scenarios[20]. The NB-IoT communication more
suitable for low power applications compared with GPRS communication, and the only drawback is that the NB-IoT communication module is slightly more expensive.
(a)
(b)
(c)
Fig.1. System architecture of IAQD system. Wired-RS485/Modbus(a), LAN-LoRa(b),
WAN-GPRS/NB-IoT/WiFi (c)
III. SYSTEM DESIGN AND IMPLEMENTATION
A. General Description
Fig.2 shows the diagram of the IAQD, which consists of five functional components, i.e., power module, sensor module, MCU controller module, mode control module and communication module. The MCU controller measures temperature, humidity, CO2, formaldehyde and dust parameters,
and data is coded two kinds of formats, Modbus RTU and JSON. The Modbus RTU packet is for RS485 or LoRa communication, and JSON packet is for message queuing telemetry transport (MQTT), which is transmitted by GPRS, WiFi or NB-IoT to cloud. The mode control mode is responsible for the system's working mode switching, including the selection of wired or wireless communication mode, as well as the configuration of wireless modules and IAQD. The output current designed by the power module can reach 3A to meet the peak current requirements of GPRS module in communication.
IAQD
RS485
IAQD IAQD
IAQD
Receiver
Transmitter
IAQD Transmitter
IAQD Transmitter
IAQD IAQD
IAQD IAQD
IEEE INTERNET OF THINGS JOURNAL
Fig.2. Main function components of the IAQD
B. Hardware implementation
1) Sensor selection
Table II shows the specific parameters of selected sensors, including resolution, repeatability, range and interface to MCU. SHT30 is a new temperature and humidity sensor produced by Sensirion company in Switzerland, with an I2C communication
interface and a wide operating voltage range, suitable for a wide range of applications. PMS5003 is a high-precision digital particulate concentration sensor made by Plantower company in China, which can be used to obtain the mass and quantity of suspended particulate matter in the air and output in the form of a UART interface. PMS5003 sensor adopts laser scattering principle, which has higher precision compared to the ultra-red sensor, and can be easily used without calibration. Formaldehyde sensor is a WZ-S-K produced in UK, combined with advanced micro-detection technology, the environment of formaldehyde content directly converted to concentration value. The sensor is a two-electrode electrochemical sensor, with high measuring precision and easy operation. Finally, CO2 sensor is
S8 0053, which is made by SenseAir in Sweden. The working principle of S8 0053 is non-dispersion infrared, and the average expected life is more than 15 years. All these sensors adopted in this paper can be obtained high accuracy without calibration, and communicate to MCU via serial TTL interface, except SHT30, which is I2C interface.
TABLEII
BASIC INFORMATION FOR THE SENSORS USED IN THIS STUDY
Parameter Resolution Repeatability Range Interface
Temperature 0.015℃ ±0.2℃ 40~125℃ I2C
Humidity 0.01%RH ±2% 0-100%RH I2C
Dust 1μg/m3 ±10μg/m3 ≥1000μg/m3 UART
Formaldehyde 0.001ppm ±20ppm 0-2ppm UART
CO2 1ppm ±40ppm
400 to 2000
ppm UART
2) Communication module
With the emergence and rapid development of IoT, many communication technologies are widely spread to transmit data instantly from remote place. In this paper, we select five typical communication technologies for different application scenarios. RS485 is for local networking application, which can be easily connected to other control equipment and actuators within the building. LoRa is for short range communication and GPRS, WiFi, NB-IoT are for long range communication.
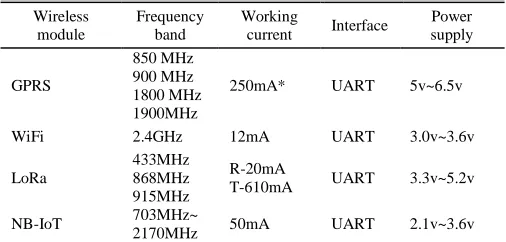
Fig.3 shows these communication modules selected in this paper, and the detail working performance of these communication modules are described in Table III. Furthermore, all of these communication modules can communicate with MCU via serial port and are configured through AT instructions.
GPRS module Wifi module
LoRa module NB-IoT module
Fig.3. wireless communication modules used in IAQD
TABLEIII
ZIGBEE AND LORA PERFORMANCE COMPARISON
Wireless module
Frequency band
Working
current Interface
Power supply
GPRS
850 MHz 900 MHz 1800 MHz 1900MHz
250mA* UART 5v~6.5v
WiFi 2.4GHz 12mA UART 3.0v~3.6v
LoRa
433MHz 868MHz 915MHz
R-20mA
T-610mA UART 3.3v~5.2v
NB-IoT 703MHz~
2170MHz 50mA UART 2.1v~3.6v
* The peak current of GPRS can reach 2A
3) MCU module
According to the requirements of sensor module and communication module, the MCU controller should have I2C interface and UART interface. We select STM32F103C8T6 as microcontroller, which is an ARM 32-bit Cortex-M3 micro-controller operating at 72 MHz frequency. This micromicro-controller offers two 12-bit ADCs, three general purpose 16-bit timers plus one PWM timer, as well as standard and advanced communication interfaces: up to two I2C and SPIs, five
USARTs, an USB and a CAN[21].
These features make STM32F103C8T6 suitable for this proposed IAQD. The circuit of MCU module includes reset
STM32 MCU module
Dust sensor CO2 sensor
Temperature& humidity sensor
Formaldehyde sensor
Power Mode
control
Communication module
circuit, crystal circuit and Joint Test Action Group (JTAG) circuit, which is used for development and debugging. In order to save the area of the circuit board, we selected STM32F103C8T6 with 48 pins package format, which has three USART interfaces. The USART-1 is connected to dust sensor, USART-2 is connected to formaldehyde sensor and CO2
sensor at the same time, USART-3 is connected to the communication module, which is controlled by mode switching module. Because the data format of the CO2 module and
formaldehyde module is different, the MCU knows exactly who is at the other end of the communication.
4) Mode switching module
In this system, a variety of communication interfaces are designed, except that RS485 is a wired communication interface, the rest are wireless communication interfaces, and these wireless interfaces need to be configured (baud rate, check bit, server IP, port, etc.). The conventional design method is to equip the wireless module with a serial TTL configuration interface, shown as in Fig.4-(a), this method requires many switches to control the mode it works, and the RS485 and TTL modules have only one at work and the other is idle. In this mode, RS485 and wireless modules are parallel and do not intersect with each other. In this paper, we design the RS485, wireless module and MCU as peer-to-peer relationships, shown as in Fig.4-(b), each of these three can be communicated to each other by using BL1532, which is a double pole double throw (DPDT) chip. The block diagram and function table of BL1532 are shown as in Fig.5-(a), when OEb pin is high, the connection is disconnected, and sel pin is used to control switch.
Fig.5-(b) shows the communication switching circuit of the system, U3 controls mode-0 and mode-1, and U4 controls mode-2 and mode-3. Table IV describes a detailed description of the four modes in the system.
(a) (b)
Fig.4. Wireless Module Configuration diagram: Stand-by serial module(a) and Shared RS485 Interface(b)
(a)
(b)
Fig.5. Communication switching circuit. Block diagram and function table of BL1532(a), switching circuit(b)
TABLEIV WORKING MODES OF THE SYSTEM
Mode S1 S2 Circuit connection Function
0 On On RS485 – MCU Modbus work/
IAQD configuration
1 On Off RS485 – WM* WM configuration
2 Off On STM32 – WM* LoRa work
3 Off Off STM32 – WM* WiFi/GPRS/
NB-IoT work * WM:Wireless module, includes LoRa, WiFi, GPRS, NB-IoT
5) Power module
The main function of the DC power module is to provide power for MCU, sensor and communication modules. There are two kinds of supply voltages, one is DC 5V for sensor modules and most of the communication modules, and the other is DC 3.3v for MCU module and WiFi module. We select mp1584 as the main power chip to generate DC 5v, which has wide input range from DC 9v to DC 28v, and provides 3A output current for GPRS communication module. The power circuit structure is shown in Fig.6. In this circuit, special attention needs to be paid to D1, D2, L1. The maximum average rectifier current of D1 and D2 should be more than 3A, and L1 should be power inductance with rated current more than 3A too. ASM1117-3.3 chip is adopted to supply DC 3.3v power.
Fig.6. Power circuit diagram
The final prototype of IAQD is shown in Figs.7, which shows the interface, top view and bottom view, respectively.
MCU
WM RS485
Mode-0 Mode-1
TTL
MCU
WM RS485
Mode-0 Mode-1
IEEE INTERNET OF THINGS JOURNAL
(a)
(b)
(c)
Fig.7. The final prototype assembly. Interface(a), Top view(b), Bottom view(c)
C. software implementation
In this paper, the software implementation mainly includes two parts, as shown in Fig.8. First is the embedded software in STM32 microcontroller, which consists of data acquisition software, data processing software and data sending software. The other is software in cloud, which has real-time display function, historical data query function, data alarm management, access permission management function. Furthermore, Users can access data anytime, anywhere, either on the Web or in the mobile APP.
Fig.8. Software architecture of the system
1) Embedded software in MCU
The embedded software of IAQD is developed by using C language with Keil5 software platform. The embedded programs are divided into three parts, first of all, is data acquisition from four sensor modules, the temperature and humidity sensor module is through the I2C communication, the remaining three kinds of sensors are through serial communication to achieve data acquisition. The default working mode of formaldehyde sensor and dust sensor is to send data to the MCU actively, in order to unified management, initial working mode is set up as passive mode The sensors to return data only when the MCU send the acquisition instructions. Secondly, compose sensor data into the data message format to be sent. As mentioned above, the data packets are formatted as in the form of Modbus RTU for local communication, and in the form of message queue telemetry transport (MQTT) for cloud. The MQTT protocol is suitable for M2M communications where several devices or systems need to communicate between them, which is a light weight transport protocol works on TCP and assures the delivery of messages from node to the server[22]. The main advantages of MQTT
include energy saving, publish/subscribe model and two-way communication (via both directions) capabilities. Finally, data sending software consists of configuration, connecting server and UART communication. The serial communication parameters, IP address and port of cloud server, and sending period are configured in this module. Fig.9 shows the flowchart of software in MCU.
The main program flowchart is shown in Fig.9. The working mode is determined, Modbus monde or cloud mode, after the system is initialized. If it is in Modbus mode, the sensors data is collected by MCU and stored in Modbus RTU packet. After that, MCU will send data if receives the command from Master, otherwise, it will collect sensors data to ensure that the data stored is up to date. On the other hand, if it is in cloud mode, the sensors data will be stored into MQTT format, and MCU will send packet at the periodical time.
CO2 sensor
Formaldehyde sensor
Dust sensor
Temp&Humi sensor
Modbus RTU packet
MQTT packet
Communication
Connecting
Configuration Data acquisition
Data processing
Data sending
Cloud software function
Real-time display
Historical data
query Data alarm
Access permissions
Embedded software
Start
System Initialization
Data acquisition Modbus mode?
Connecting sever
MQTT Packet Modbus RTU
Packet
Data acquisition
Receive Master collecting command
periodical sending time ?
Send sensor data to cloud server Send sensor data to
Master Y
Y
Y N N
N
Fig.9. Main program flowchart
2) Server software in cloud
As aforementioned, authorized end users can access the air quality monitoring system in the form of website or mobile APP. Our website software is developed using web page configuration tool, The development of cloud platform software can be completed quickly finished by what you see is what you get (WYSIWYG) approach through the WYSIWYG approach. Fig.10-(a) and Fig.10-(b) illustrate the GUI interfaces of the website and the mobile APP, respectively. on dashboard, the air quality information can be shown in real-time, e.g.
• Real-time indoor air quality data
• IAQ trend in a day, week or time period by user defined.
• IAQ historical data query and export function, shown as in Fig.10-(c).
• Setting of alarm values
• Manage user access permissions
(a)
(b)
(c)
Fig.10. Software features in cloud platform. Mobile APP access(a), Web browser access(b), Historical data query and
export interface (c)
IV. EXPERIMENTAL RESULTS AND ANALYSIS
IEEE INTERNET OF THINGS JOURNAL
3 IAQDs are placed at the same location in the room of A711 of the Innovation Building. 1# IAQD connects to cloud server via GPRS, 2# and 3# connect to cloud server via WiFi and NB-IoT networks, respectively. The experiment is carried out for a week, from March 21, 00:00 to March 27, 23:58. IAQD sends data to cloud server every two minutes.
Fig.11. Innovation Building of Dalian University of Technology
A. Measurement results and analysis
Indoor air quality data are collected through the system and used for the sake of illustration and further analysis, which
include PM2.5, CO2, Formaldehyde, Temperature and humidity,
provided in Fig.12. On the whole, the three sets of measurements showed a high degree of consistency. As can be seen from Fig.12-(b), there is a significant deviation in the measured values of CO2 during the periods in rectangular box b and c. During the test, the three IAQDs were placed in the same position, but they were not at the same distance from the actuators in the room, and the CO2 sensor was highly sensitive, resulting in a deviation of the measurement results, but the overall trend of the tri-curves was highly consistent. Based on the above analysis, the air quality data obtained by the proposed IAQD can satisfy both the accuracy and reliability requirements. In addition, from the rectangular box marked “a” in each diagram, it can be seen that when opening the window, due to the acceleration of air flow, the various sensors show different degrees of fluctuation, of which CO2 and formaldehyde fluctuation amplitude is not obvious, PM2.5 fluctuations are more intense.
Furthermore, formaldehyde sensors were found to be susceptible to odors, such as alcohol and perfumes, while carbon dioxide and PM2.5 sensors were not affected, shown as in Fig.12-(c). Through these accurate measurements of indoor air, you can do a lot of meaningful research work, such as in-depth study of the effects of temperature and humidity on PM2.5, formaldehyde, such as the effect of opening windows on the measurement results of formaldehyde and PM2.5, such as human comfort research in different environments. More detailed and in-depth testing work will be carried out in the following research work.
(a)
(b)
(c)
(d)
Mar 21 Mar 22 Mar 23 Mar 24 Mar 25 Mar 26 Mar 27 Mar 28 0
20 40 60 80 100 120 140 160
P
M2
.5
(μ
g
/m
3 )
Time(day)
1# 2# 3# a
window opened
Mar 21 Mar 22 Mar 23 Mar 24 Mar 25 Mar 26 Mar 27 Mar 28 300
400 500 600 700 800 900 1000 1100
a
c
CO
2(p
p
m)
Time(day)
1# 2# 3#
b
window opened
Mar 21 Mar 22 Mar 23 Mar 24 Mar 25 Mar 26 Mar 27 Mar 28 -100
0 100 200 300 400 500 600 700 800
F
o
rma
lde
h
yd
e
(μ
g
/m
3)
Time(day) 1#
2# 3#
a window opened
Mar 21 Mar 22 Mar 23 Mar 24 Mar 25 Mar 26 Mar 27 Mar 28
20 21 22 23 24 25 26 27
a window opened
T
e
mp
e
ra
tu
re
(
℃
)
Time(day) 1#
(e)
Fig.12. Indoor air quality monitoring: PM2.5(a), CO2(b),
Formaldehyde(c), Temperature(d), Humidity(e)
B. Packet loss test
Packet loss rate is an important index to measure the stability of a communication system, whether it is a wireless communication system or a wired communication system. For RS485 wired communication, we use the computer as the Master of Modbus fieldbus, and send a collection instruction per second. A total of more than 10,000 acquisition messages are sent continuously, and the packet loss ratio is calculated by number of bytes sent and received, as shown in Fig.13-(a). As for LoRa module, we still use the computer as the Master in the room of A711, and place 8 IAQDs in 16th floor, 6th floor, 5th floor, 4th floor, 3th floor, 1th floor, B1th floor, and B2th floor, as shown in Fig.13, send a collection instruction every 10s. A total of 5,000 acquisition messages are sent continuously. Table V shows the distribution of packet loss rates at these locations. As can be seen from the measurement results, LoRa has a strong penetration capability inside the building. Although the measuring point on the 16 floor is further away from the main node than the B2 measuring point, the PLR at that point has little impact on the monitoring system. On the contrary, the PLR of the B2 measuring point cannot be accepted. This phenomenon may be caused by a more complex construction environment under the ground. In practical applications, LoRa communication distance is greatly influenced by obstacles, electromagnetic interference and antennas[14]. As for cloud
transmission scenarios, IAQD sends data to cloud server every two minutes. The amount of data that each IAQD should send is: 7days*24hours*60mintues/2minutes =5040.
Fig.13-(b) shows the client software, MQTT.fx, by which we can subscribe data that has been published to the cloud platform. The actual amount of data received by the cloud platform and the PLRs of each module are shown in the Table V. It can be seen that WiFi has less packet loss rate than the other two communication methods, the PLRs of GPRS and NB-IoT are 1.73% and 2.4%, respectively. It was found that most of the data loss occurred between 6 o'clock to 9 o'clock in the evening, when cellular communication networks were relatively busy. Once the GPRS or NB network is dropped, reconnecting to the network takes a certain amount of time, and this period will
result in data loss. Generally speaking, the packet loss rate below 3% is also acceptable in the field of monitoring system.
TABLEV
PACKET LOSS RATE STATISTICS OF DIFFERENT COMMUNICATION MODES
Type Slave Send Receive PLR
RS485 13275 13275 0%
LoRa*
16F 5000 4952 0.96%
6F 5000 5000 0%
5F 5000 5000 0%
4F 5000 5000 0%
3F 5000 5000 0%
1F 5000 4996 0.08%
B1 5000 4945 1.1%
B2 5000 2955 40.9%
GPRS 2160 2123 1.71%
WiFi 2160 2156 0.18%
NB-IoT 2160 2108 2.4%
*Master is in the 7th floor
(a)
(b)
Fig.13. Packet loss rate experiments: RS485 and LoRa test (a), GPRS, WiFi, and NB-IoT (b)
C. Time Delay Test
Time delay is another important index to evaluate the performance of communication system in addition to packet
Mar 21 Mar 22 Mar 23 Mar 24 Mar 25 Mar 26 Mar 27 Mar 28
10 12 14 16 18 20 22 24 26 28 30
H
u
mid
it
y
(%)
Time(day)
1# 2# 3#
a
IEEE INTERNET OF THINGS JOURNAL
loss rate. Time delay refers to the time it takes to send a message from one side of the system to the other side of the system to receive the message. However, in most of communication systems, it is difficult to measure this time delay directly because of inconsistencies in the timing of both sides. In this paper, a unilateral measurement method is used to measure the time delay of sending instructions from the server to receiving the returned data. One-way time delay can be obtained by round-trip delay divided by 2.
By using the Uart Assistant software to send the acquisition instruction from computer, the sensor will automatically return the data. The software records the sending and receiving time points, and the round-trip delay can be obtained by receiving time points minus sending time points. GPRS, WiFi and NB-IoT all need to be transmitted by public network, and the working conditions of the three are similar. So, in this test, we deployed three test scenarios, namely wired RS485, short-range wireless LoRa, and long-distance GPRS communication tests, and the time delay under the condition of WiFi and NB-IoT can be analyzed qualitatively by GPRS data. The data acquisition instruction sent by the computer to sensor for a period of 10s. RS485 Communications and GPRS communications were measured 200 times, respectively. For LoRa communications, 3 points were selected as sampling tests, located on 7th floor, 3th floor and 1th floor.
Fig.14 shows the measurement results of the time delay of three communication modes, and Table VI shows the maximum and minimum and average statistics of the measurement results. Data shown in Fig.14 clearly illustrated that the time delay of RS485 is relatively stable compared to GPRS and LoRa communication. Furthermore, RS485 and LoRa have obvious minimum delay values, for RS485 is 50ms, for LoRa is 300ms. However, the time delay of GPRS shows obvious characteristics of irregular fluctuation, and there is no obvious upper and lower boundary values. This is because GPRS communication needs to go through the public network, with multiple routes and nodes in the middle, and the time spent on the routing node is not the same for each time. In addition, we can see that for LoRa communications, there is no significant change in the time delay of nodes located on different floors from Table VI.
(a)
(b)
(c)
Fig.14. Time delay experiments: RS485-(a), GPRS-(b), LoRa-(c)
TABLEVI
TIME DELAY OF DIFFERENT COMMUNICATION MODES
Type Max/ms Min/ms Avg/ms
RS485 56.5 50 51.4
GPRS 2710 852.5 1345.3
LoRa*
7F 311 300.5 301.9
3F 306 300.5 301.7
1F 327 301 302.8
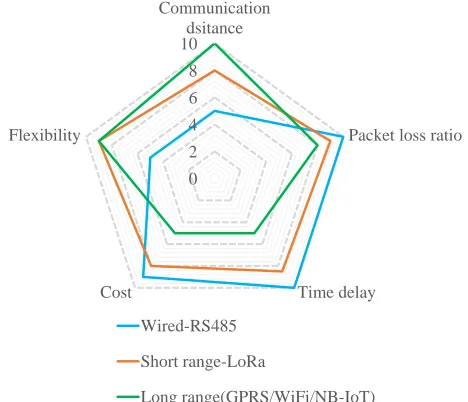
D. Contrast analysis
The IAQD developed in this paper supports a variety of communication methods at the same time, and each communication technology has its own application. As shown in Fig.15, a comparative analysis of these communication technologies is carried out from 5 different dimensions. In the specific application, we should choose the appropriate communication technology from these five aspects according to the actual situation.
• Communication distance: The communication distance of
RS485 is the shortest, generally not more than 1km. The communication distance of GPRS/WiFi/NB-IoT is the longest, the data of IAQD can be transmitted to cloud platform as long as there is a network signal. Finally, the communication
0 50 100 150 200
49 50 51 52 53 54 55 56 57
T
ime
d
e
lay
/ms
The number of data packets
RS485
0 50 100 150 200
500 1000 1500 2000 2500 3000
T
ime
d
e
lay
/ms
The number of data packets
GPRS
0 50 100 150 200
300 305 310 315 320 325 330
T
ime
d
e
lay
/ms
The number of data packets
distance of LoRa is in the middle, 3km~8km within the visual range.
• Packet loss ratio: Overall, RS485 has the lowest packet drop rate, and the wireless transmission scheme is affected by the signal strength and the occlusion between the IAQD and the collector.
• Time delay: The time delay of RS485 is smallest, the time delay of GPRS is largest, and LoRa is in the middle. It is suggested to choose RS485 and LoRa, if the collected indoor environment parameters participate in the control process, the time delays of which are relatively stable.
• Cost: For the hardware cost of IAQD, RS485 is the lowest, GPRS/WiFi/NB-IoT are the highest and, LoRa is in the middle.
•Flexibility: The deployment of IAQD, which supports wireless communication, is flexible. On the contrary, RS485 needs wiring work, construction is difficult, and the labor costs is high.
Fig.15. Performance comparison of different communication technologies
Table VII presents a comprehensive and comparative analysis of proposed indoor air quality detectors with various communication interfaces and systems in literatures in recent years. The proposed system in this paper has the advantages of
real-time monitoring with multi-sensors and
multi-communication mode, and can meet various requirements of real-time monitoring and analysis of indoor air quality in the IoT environment.
Compared with single or fewer sensors, the integration of multiple sensors can monitor the indoor environment from different dimensions, and the indoor environment can be better evaluated through data fusion. On the other hand, the system proposed in this paper integrates multiple communication interfaces, which can be applied to both single room monitoring scenarios and whole building monitoring. Furthermore, it can be extended to whole community or even the city level of indoor environmental quality monitoring through WAN networking.
TABLEVII
COMPARATIVE ANALYSIS WITH LITERATURES
Ref. Year Sensor Communication
interface
Application scenario
[4] 2009 CO and CO2 NA standalone
[5] 2013 CO2 Zigbee standalone
[6] 2014 CO, CO2,
VOC Zigbee, WiFi LAN, WAN
[7] 2017 CO and CH4 WiFi standalone
[8] 2017 O3 WiFi, Bluetooth LAN, WAN
[11] 2017 VOC, T*, H* Zigbee standalone
[10] 2017 T*, H* Zigbee standalone
[9] 2018 CO,CO2,
PM2.5, T*, H* Zigbee standalone
This
paper 2019
CO2, PM2.5, T*, H*, F*,
RS485, Lora, GPRS, NB-IoT WiFi
Standalone, LAN WAN *T-Temperature, H-Humidity, F- Formaldehyde.
V. CONCLUSION
The indoor air pollution problem has a significant impact on quality of life, and has become a worldwide issue in recent years. In this paper, we have implemented an indoor air quality detector (IAQD) by using the advanced IoT techniques in this paper. This IAQD comprises five sensors that could detect temperature, humidity, PM2.5, CO2 and formaldehyde in real time. In order to meet the actual needs of different application scenarios, the instrument with multiple communication interface was designed in this paper, including RS485, LoRa, WiFi, GPRS and NB-IoT. This IAQD can be applied in wired communication scenario, short-range wireless network communication scenario, long-distance to cloud platform scenario, or mixed applications. Sufficient experiments have been carried out, and the results of statistical analysis demonstrates the reliability and high performance of the proposed indoor air quality system. Such a system is extremely useful in monitoring air quality conditions inside buildings to better understand the current status of air quality.
Further work will include low power mode research by using LoRa and NB-IoT, and the data would be collected for a longer time in order to meet some occasions where there is only battery-powered occasions. Furthermore, and the system performance should be tested in larger scale deployment environment for long-term testing, such as in office buildings and residences.
REFERENCES
[1] de Nazelle A, Seto E, Donaire-Gonzalez D, et al."Improving estimates of air pollution exposure through ubiquitous sensing technologies", Environ. Pollut., vol.176, pp.92-99, May. 2013, [2] Tran T V, Dang N T, Chung W. "Battery-free smart-sensor system for real-time indoor air quality monitoring", Sensor Actuat B-Chem. vol.248, pp.930-939, Sep. 2017.
[3] A. Z, N. B, A. C, et al. "Internet of Things for Smart Cities",
IEEE Internet Things J., vol.1, no.1, pp.22-32, Feb. 2014. 0
2 4 6 8 10
Communication dsitance
Packet loss ratio
Time delay Cost
Flexibility
Wired-RS485
Short range-LoRa
IEEE INTERNET OF THINGS JOURNAL
[4] Kumar A, Singh I P, Sud S K. "Indoor Environment Gas Monitoring System Based on the Digital Signal Processor", in
Proc IMSPCT, Aligarh, India, Mar, 2009, pp.245-249. [5] D. M G P. "Design of a smart indoor air quality monitoring wireless sensor network for assisted living", in Proc I2MTC, Minneapolis, MN, USA, May, 2013. pp.1306-1310.
[6] Abraham S, Li X. "A Cost-effective Wireless Sensor Network System for Indoor Air Quality Monitoring Applications", Procedia Comput. Sci., vol.34, pp.165-171, Aug. 2014.
[7] M. M A, S. B, B. P. "Real-time air quality monitoring system for Bangladesh's perspective based on Internet of Things", in Proc EICT, Khulna, Bangladesh, Dec, 2017, pp.1- 5.
[8] M. F M F, B. H S, P. M K. "IoT enabled proactive indoor air quality monitoring system for sustainable health management", in Proc ICCCT, Chennai, India, Feb, 2017, pp. 216-221.
[9] C. L, J. L. "Development of indoor air quality supervision systems using ZigBee wireless networks", in Proc ICIEA, Wuhan, China, May, 2018, pp.95-98.
[10] Bamodu O, Xia L, Tang L. "An indoor environment monitoring system using low-cost sensor network". Energ Procedia, vol.141, pp.660-666, Dec. 2017.
[11] Tareq Alhmiedat G S."A Low Cost ZigBee Sensor Network Architecture for Indoor Air Quality Monitoring", J Comput Sci Inform Secur. vol.15, no.1, pp.140-144, Dec. 2017. [12] Apte J S, Brauer M, Cohen A J, et al. "Ambient PM2.5 Reduces Global and Regional Life Expectancy", Environ Sci Tech Let, vol.5, no.9, pp.546-551, Sep. 2018.
[13] Bhatt J, Verma H K. "Design and Development of Wired Building Automation Systems". Energ Buildings., vol. 103, pp.396-413, Sep. 2015.
[14] X. Z, M. Z, F. M, et al. "A Low-Power Wide-Area Network Information Monitoring System by Combining NB-IoT and LoRa". IEEE Internet Things J., vol.6, no.1, pp.590-598, Feb. 2019.
[15] A. R, A. K. "ZigBee based wireless temperature monitoring system for shrimp farm", in Proc. ICCAS, Busan, South Korea, Oct. 2015. pp.13-16.
[16] Huang L, Chang H, Chen C, et al. "A ZigBee-based monitoring and protection system for building electrical safety".
Energ Buildings., vol.43, no.6, pp.1418-1426, Jun. 2011. [17] Ali A, Shah G A, Farooq M O, et al."Technologies and challenges in developing Machine-to-Machine applications: A survey", J Network Comput Appl., vol.83, pp.124-139, Apr. 2017.
[18] Ray P P. "A survey on Internet of Things architectures" J. King Saud Univ. - Comp., vol.30, no.3, pp.291-319, Oct. 2018. [19] Y. L, H. T, Y. L, et al."NB-IoTtalk: A Service Platform for Fast Development of NB-IoT Applications", IEEE Internet Things J., vol.6, no.1, pp.928-939, Feb. 2019.
[20] Sinha R S, Wei Y, Hwang S. "A survey on LPWA technology: LoRa and NB-IoT", ICT Exp. vol.3, no.1, pp.14-21, Jun. 2017.
[21] Zhang H, Kang W. "Design of the Data Acquisition System Based on STM32", Procedia Comput. Sci., vol.17, pp.222-228, May. 2013.
[22] Santamaria A F, De Rango F, Serianni A, et al. "A real IoT device deployment for e-Health applications under lightweight
communication protocols, activity classifier and edge data filtering", Comput Commun., vol.128, pp.60-73, Sep. 2018.
LiangZhao was born in Harbin, China. He received the B.S. and M.S. degrees in electronic information engineering from Dalian University of Technology, Dalian, Liaoning Province, in 2007 and 2009, respectively, and the Ph.D. in heating gas ventilation and air conditioning engineering, still in Dalian University of Technology, in 2014. He is currently an Associate Professor at the School of control science and engineerging, Dalian University of Technology. His current research interests include Internet of Things, embedded systems, as well as building energy information system.
Wenyan Wu received the B.Sc. and M.Sc. degrees in electronic engineering and computer-aided design from the Dalian University of Technology, Dalian,China. She received the Ph.D. degree in water quality modeling and optimization in water distribution system from the Harbin Institute of Technology, Harbin, China, in 1999, and received the second Ph.D. degree in three-dimensional visualization and virtual reality from the University of Derby, Derby, U.K., in 2003. She is currently a Professor in smart sensor and advanced system engineering at Birmingham City University, Birmingham UK. She was Professor in Digital design and Technologies at Staffordshire University U.K. She has senior lecturer in Department of Computing at the Harbin Institute of Technology, China and a Research Fellow in Water Software Systems at De Montfort University, Leicester, U.K,. National Key CAD Laboratory at Institute of Computing Technology, Academy of Science, Beijing, China. Her research interests include smart sensors and sensor networks, IOT, intelligent monitoring, digital design and processing, data visualization and advanced interface. modeling and optimization