https://doi.org/10.5194/esd-8-477-2017
© Author(s) 2017. This work is distributed under the Creative Commons Attribution 3.0 License.
Sensitivity experiments on the response of Vb cyclones
to sea surface temperature and soil moisture changes
Martina Messmer1,2, Juan José Gómez-Navarro1,2,3, and Christoph C. Raible1,2
1Climate and Environmental Physics, Physics Institute, University of Bern, Bern, Switzerland
2Oeschger Centre for Climate Change Research, University of Bern, Bern, Switzerland
3now at Department of Physics, University of Murcia, Murcia, Spain
Correspondence to:Martina Messmer ([email protected])
Received: 1 December 2016 – Discussion started: 15 December 2016 Revised: 5 May 2017 – Accepted: 16 May 2017 – Published: 3 July 2017
Abstract. Extratropical cyclones of type Vb, which develop over the western Mediterranean and move
north-eastward, are major natural hazards that are responsible for heavy precipitation over central Europe. To gain fur-ther understanding in the governing processes of these Vb cyclones, the study explores the role of soil moisture and sea surface temperature (SST) and their contribution to the atmospheric moisture content. Thereby, recent Vb events identified in the ERA-Interim reanalysis are dynamically downscaled with the Weather Research and Forecasting (WRF) model. Results indicate that a mean high-impact summer Vb event is mostly sensitive to an increase in the Mediterranean SSTs and rather insensitive to Atlantic SSTs and soil moisture changes. Hence, an
increase of+5 K in Mediterranean SSTs leads to an average increase of 24 % in precipitation over central Europe.
This increase in precipitation is mainly induced by larger mean upward moisture flux over the Mediterranean with increasing Mediterranean SSTs. This further invokes an increase in latent energy release, which leads to an increase in atmospheric instability, i.e. in convective available potential energy. Both the increased availability of atmospheric moisture and the increased instability of the atmosphere, which is able to remove extra moisture from the atmosphere due to convective processes, are responsible for the strong increase in precipitation over the entire region influenced by Vb events. Precipitation patterns further indicate that a strong increase in precipita-tion is found at the eastern coast of the Adriatic Sea for increased Mediterranean SSTs. This premature loss in atmospheric moisture leads to a significant decrease in atmospheric moisture transport to central Europe and the northeastern flanks of the Alpine mountain chain. This leads to a reduction in precipitation in this high-impact
region of the Vb event for an increase in Mediterranean SSTs of +5 K. Furthermore, the intensity of the Vb
cyclones, measured as a gradient in the 850 hPa geopotential height field around the cyclone centre, indicates that an upper bound for intensity might be reached for the most intense Vb event.
1 Introduction
The frequency and intensity of extreme events are highly vul-nerable to climate change (Hartmann et al., 2013; Fischer and Knutti, 2014; Fischer et al., 2014; Fischer and Knutti, 2015), e.g. heavy precipitation events in the midlatitudes ex-hibit an increase with ongoing climate change (Hartmann et al., 2013). Since it is difficult to predict changes in extreme weather events, in particular at regional scales in a possible future climate (Fischer and Knutti, 2015), it is of great
im-portance to understand the triggering mechanisms and the involved processes of high-impact weather events, e.g. cy-clonic systems with their associated wind gusts and heavy precipitation.
during their intensification phase. As they reach the eastern edge of the Alpine mountain chain, they turn northeastward towards St. Petersburg (Van Bebber, 1891). These cyclones transport large amounts of atmospheric moisture to the north-ern side of the Alps and central Europe, thus triggering ex-treme precipitation events (Messmer et al., 2015), and they exhibit a great potential for floods in the Elbe, Danube, or the Rhine catchments (Nied et al., 2014) and the Alpine area, including adjacent flatlands and low mountain ranges (e.g. chap. 5 in MeteoSchweiz, 2006).
Several studies record that often cut-off lows, including the Vb pathway, are responsible for extreme precipitation and discharge events in the Alps and central Europe, e.g. the prominent European flood that occurred in August 2002 (Ul-brich et al., 2003a; Jacobeit et al., 2006; Grams et al., 2014; Messmer et al., 2015; Awan and Formayer, 2016). The po-tential of transporting extreme precipitation to central Eu-rope is especially high if these cut-off low systems are posi-tioned in the northern or eastern parts of the Alps (Awan and Formayer, 2016). These studies above demonstrate that there seems to be a wide agreement on the large-scale dynamics of Vb events. Furthermore, the large-scale dynamics seem to determine whether a Vb cyclone delivers high precipitation or not (Messmer et al., 2015). Despite this fact, an important moisture source needs to supply the atmosphere with the re-quired moisture. In fact, these thermodynamical processes, and especially the moisture sources, remain unclear, as de-scribed in the following.
To identify the main moisture sources during Vb events, the case study approach is widely used in the literature (Ul-brich et al., 2003a; Stohl and James, 2004; Sodemann et al., 2009; Gangoiti et al., 2011). The most intensively studied Vb cyclone is the once-in-a-century event that occurred in August 2002 and led to a major flooding of the Oder and Elbe catchments. Some studies have identified evaporation from land, together with moisture from the Mediterranean Sea and the Atlantic, as important moisture sources during the 2002 Vb event (Ulbrich et al., 2003a; Stohl and James, 2004). This is in line with the study performed by Sode-mann et al. (2009), who suggested that water vapour from separated moisture sources contributes to the extreme pre-cipitation in the most affected area during the August 2002 Vb event. These moisture sources include the Atlantic Ocean and Mediterranean Sea areas inside the model domain, the evapotranspiration from land areas, and long-range advec-tion from subtropical areas outside the model domain. How-ever, some more general studies on precipitation events in Europe suggest that the Mediterranean Sea plays an impor-tant role in such events. Gimeno et al. (2010), for example, identified the Mediterranean Sea as the main oceanic mois-ture source for precipitation over central Europe. Gangoiti et al. (2011) focused on the August 2002 Vb event and iden-tified evaporation in the western Mediterranean Basin 6 to 2 days prior to the actual event as its most prominent source of moisture. Winschall et al. (2014) further supported the fact
that the Mediterranean Sea is not the only moisture source during various heavy precipitation events in central Europe. They found that additional moisture sources with high event-to-event variability are needed to trigger such events. These moisture sources include, in addition to others, the evapo-ration from European land masses especially in summer or evaporation from the North Atlantic Ocean in winter. The fact that evaporation from land, and thus soil moisture re-cycling, might play an important role in extreme precipi-tation events has been further highlighted in recent studies (Grams et al., 2014; Kelemen et al., 2016). Both studies anal-yse a rather atypical Vb event in 2013, which was never-theless associated with widespread flooding in the Danube and Elbe catchments. Even though there have been several case studies devoted to identifying the moisture sources dur-ing high-impact Vb events, the results seem to be diverse as the moisture sources include the Mediterranean Sea, the At-lantic Ocean, and soil moisture. Therefore, identifying the main moisture source during Vb events in general and inde-pendent of single cases, still remains a challenge.
A one-at-a-time sensitivity experiment can help identify-ing the main moisture sources as it allows the diagnosis of the processes that contribute most to the model parametric sen-sitivity (Lee et al., 2012; Zhao et al., 2013). Thus, sensitiv-ity analyses enable the analysis of the impact of several fac-tors on a certain process (Saltelli et al., 2000). Consequently, the effect on precipitation, for example, can be determined according to changes in the input variable, e.g. sea surface temperatures (SSTs).
The present work aims at shedding light on the sensitiv-ity of extreme summer Vb events and their impact on pre-cipitation over central Europe to several moisture sources. Hence, a number of idealized sensitivity experiments are de-signed and carried out with the regional Weather Research and Forecasting (WRF) model to disentangle the contribu-tion of these moisture sources during the five most intense summer Vb events (Messmer et al., 2015) recorded in the period 1979–2013. Thereby, and according to the variables considered by previous studies, we test the sensitivity of Vb events to changes in soil moisture in Europe and SSTs of the Atlantic Ocean and the Mediterranean Sea.
2 Data and methods
2.1 Reanalysis data set
The ERA-Interim data set is used to provide the initial conditions and 6-hourly lateral boundaries for the regional model. This data set is produced by the European Centre for Medium-Range Weather Forecasts (ECMWF) in a spectral resolution of T255, which corresponds to a spatial resolu-tion of approximately 80 km, and 60 vertical levels up to 0.1 hPa (Dee et al., 2011). The 6-hourly estimates of three-dimensional meteorological variables and the 3-hourly esti-mates for surface variables are generated with the Integrated Forecast System model version 2006 of the ECMWF assim-ilating various sources of observational data, e.g. satellite data, surface pressure observations, and radiosonde profiles (Sect. 4 in Dee et al., 2011).
2.2 Observations used in the model evaluation
For evaluation, simulated daily accumulated precipitation and multi-day sums of daily accumulated precipitation over the five precipitation-intense summer Vb events are com-pared to two observational data sets. The first one is the E-OBS data set version 10.0 (Haylock et al., 2008). It consists of weather station data, which are interpolated to a regular 25 km grid over the European land, i.e. it does not provide data over the ocean. The variables included in this product are precipitation; sea level pressure; and mean, minimum, and maximum temperature. All variables have daily resolu-tion and span the period 1950–2013 (Haylock et al., 2008). For our analysis we will only use the daily accumulated pre-cipitation.
The second data set is the EURO4m-APGD precipitation data. It contains the daily accumulated precipitation distribu-tion over the European Alps and the adjacent flatland regions for the period 1971–2008 (Isotta et al., 2014). In contrast to E-OBS, the data are based on measurements from high-resolution rain-gauge stations and thus provide 5 km resolu-tion on a regular grid in the ETRS89-LAEA coordinate sys-tem (Isotta et al., 2014).
2.3 Selection of Vb events
For this analysis, five precipitation-intense summer Vb events are selected in the period between 1979 and 2013 that triggered extreme precipitation over the region of the north-ern slope of the Alps and northnorth-ern central Europe. For that analysis the ERA-Interim period between 1979 and 2013 is used to identify several Vb events by applying a tracking tool developed by Blender et al. (1997) to the geopotential height field at 850 hPa (Messmer et al., 2015). The Vb tracks are then filtered with a technique adapted from Hofstätter and Chimani (2012). The filtered Vb events are classified and sorted according to the accumulated precipitation de-livered over the region of the northern Alps, including parts
Three nested domains
30° w 1s0 w oo 15° E 30° E 45° E
55° N 55° N
50° N 50° N
45° N 45° N
40° N 40° N
35° N 35° N
30° N 30° N
10° w oo 10° E 20° E 30° E
0 400 800 1 200 1 600 2000 2400 3000
m a.s. I
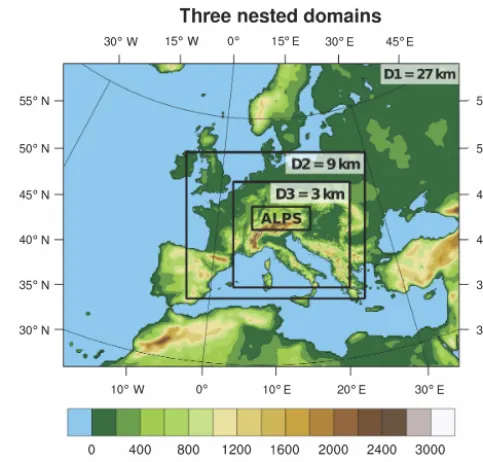
Figure 1.The three nested domains (D1 to D3) with their actual
resolution are depicted as black boxes. The box labelled “Alps” de-notes the area used for measuring the precipitation intensity of the Vb events. The shading shows the topographical elevation imple-mented in the simulations in metres above sea level.
of Switzerland, Austria, Germany, and the Czech Republic. More details on the method of Vb event selection are pre-sented in Messmer et al. (2015).
The five most precipitation-intense summer Vb cyclones that we selected include two events that are of historic im-portance. One event is the so-called European Flood, which happened in August 2002 and especially affected the catch-ment areas of two rivers: the Elbe and the Oder (Ulbrich et al., 2003a, b). The other event took place in August 2005 and caused severe floods on the northern side of the Alps, especially in Switzerland (MeteoSchweiz, 2006). The other three events occurred in July 1981, August 1985, and June 1979. These three events are not related to historic flooding events. All five events were initialized by a cold air outbreak located northeast of the Alps. As this trough moves west-wards lee cyclogenesis is induced at the southeastern flanks of the Alps and hence in the region of the Gulf of Genoa. From this starting point all five Vb cyclones move along the Vb track described by Van Bebber (1891), showing some in-dividual behaviour along the path.
2.4 Model set-up and sensitivity experiments
The simulations for the sensitivity experiments are carried out with the WRF version 3.5.1. WRF is run with a three
nested-domain set-up with a nest ratio of 1:3. The domains
lower-Table 1.Important parameterizations used to run the WRF sensitivity experiments.
Parameterization Parameter name Chosen parameterization Applied to
Microphysics mp_physics WRF single-moment six-class scheme Domain 1–3 Longwave radiation ra_lw_physiscs RRTM scheme Domain 1–3 Shortwave radiation ra_sw_physics Dudhia scheme Domain 1–3 Surface layer sf_sfclay_pysics MM5 similarity Domain 1–3 Land and water surface sf_surface_physics Noah land surface model Domain 1–3 Planetary boundary layer bl_pbl_physics Yonsei University scheme Domain 1–3
Cumulus cu_physics Kain–Fritsch scheme Domain 1
Grell–Freitas scheme Domain 2 No parameterization Domain 3
resolution domains (Fig. 1). The outermost domain covers all of the Mediterranean Sea and a large part of the Atlantic Ocean. The design of the domains considers a large area of water masses to be included in the outermost domain in or-der to allow strong water vapour signals in the inner domains. Hence, although the innermost domain does not include the Atlantic, the outer domains allow WRF to consistently inte-grate the moisture flux provided by the physical mechanisms outside the smallest domain. This flux is advected towards central Europe through the various domain boundaries. The innermost domain targets central Europe, showing the Alpine mountain chain, and thus the region of interest, in the middle of the domain (Fig. 1). Vertically, all simulations implement 50 eta levels. The 3 km resolution in the innermost domain al-lows the explicit simulation of convective processes; thus, no additional parameterization is needed. Other important pa-rameterizations chosen to run the WRF simulations are listed in Table 1.
Nudging techniques are avoided (except for the pre-simulations for the moisture sensitivity pre-simulations; see de-tails below), so that Vb cyclones can freely develop their path and intensity according to the new boundary conditions im-posed by the sensitivity experiments. However, the fact that nudging is not admitted renders the starting time of the simu-lation critical since initializations that are too early may lead to situations where the Vb cyclone is very different to the one reproduced in ERA-Interim, or even completely missing. Af-ter testing several initiation times (not shown), we found that starting the simulation 6 h before the corresponding event is first observed allows the reproduction of the events. This means the simulated trajectory of the cyclone mimics the cor-responding track of the events found in the original ERA-Interim data set (Messmer et al., 2015). However, this rela-tively short spin-up period of 6 h can be a drawback as the model might not be in full equilibrium. Note that the spin-up time is equal for all three domains, which means that there is no additional time lag for the nested domains.
To assure that this short spin-up period does not affect the performance of the simulation in the sensitivity studies, a set of experiments was performed with a spin-up time of 1 week. The set of experiments consists of sensitivity
simu-lations where SST changes of−5 and+5 K in the Atlantic
Ocean and the Mediterranean Sea are applied (not shown). These tests are aimed at assessing to what extent longer sim-ulations can achieve a better equilibrium state, leading to dif-ferent results. To force the model to reproduce the Vb event and circumvent the problem stated above, the wind fields
(UandV) and the geopotential height (GPH) are spectrally
nudged (wavelengths larger than roughly 600 km) above the planetary boundary layer and in domain 1 only. Note that nudging has only been applied to this 1-week spin-up set-up. We found hardly any change in the thermodynamic variables when using this longer spin-up period (not shown). We thus conclude that the length of the spin-up period is suitable to reach an equilibrium during the whole life of the Vb event.
2.4.1 Sensitivity experiment for soil moisture
cur-rent climate change projections in the Mediterranean Sea. The projections for central Europe indicate a robust 5–15 % reduction in soil moisture for the end of the century, with a tendency for wetter soils in the northern parts of Europe (Seneviratne et al., 2010). This projected reduction is still higher than the southern Spain experiments, as a reduction of 15 % in the central European soil moisture would result in our cases in 25 % soil water content. Similarly, the full satu-ration experiment is also rather unrealistic even in a possible moistening scenario of Europe.
Since the evaporation from soil moisture can influence the moisture content in the atmosphere before the actual Vb event takes place, we have carefully designed the initializa-tion of these simulainitializa-tions. For all three experiments, as well as the control simulation, the WRF model is started 5 days before the actual Vb event is initialized and the model ter-minated after these 5 days. During this pre-simulation, we use the same spectral nudging as described for the SST test simulations, and the soil moisture is constantly overruled to impose a fixed value of soil moisture according to each of the three sensitivity experiments in all four model layers of the Noah model. The atmospheric water vapour content af-ter these 5 days of the pre-simulation is then used to over-write the water vapour present in the initial conditions taken from the driving data set and used in the actual Vb simula-tion. The actual Vb event simulations are started at the same time as the SST experiments in order to obtain similar cy-clone tracks throughout the different types of experiments and therefore minimize side effects arising from changes in the Vb dynamics.
Across all soil moisture sensitivity experiments, the ini-tial conditions for soil moisture in the actual simulation are set to the corresponding value according to each of the three families described above. In this regard, it is important to note that just the initial conditions are set, i.e. the model is free to adjust the soil moisture afterwards due to precipita-tion and evaporaprecipita-tion processes, for example. For this reason, we did not use spin-up times longer than 6 h since otherwise the model would use the longer spin-up period to refill the soil moisture volume until the equilibrium was recovered. Furthermore, such a short spin-up time precludes obtaining a realistic initial condition of the water atmosphere content in equilibrium with the perturbed soil, which is the reason for running the pre-simulations described above. The care taken in the initialization of the soil experiments pertains espe-cially to the first model soil layer, which is the most weather-relevant layer and the one with the shortest response time. It is important to remark that unlike in the SST experiments, where we change a given boundary condition, in the case of soil the variables are simulated together with the atmosphere model, and therefore the soil experiments shall be regarded as perturbation in the initial conditions. To change the soil moisture content for the actual Vb event simulation, the orig-inal ERA-Interim initial file is modified and the land values
are set to either 0, 0.175, or 0.5 m3m−3. The latter value is
selected because the soil moisture content of all soil types
listed in the WRF model is always lower than 0.5 m3m−3.
The full saturation soil experiment described above, rep-resents an averaged increase in land soil moisture by 21 % compared to the control simulation for the first soil layer, which is the most relevant for weather. In contrast, the com-plete drainage experimental setting and the southern Spain soil experiment reduces soil moisture by 68.5 and 24 %, re-spectively, when temporally and spatially averaging domain 3.
2.4.2 Sensitivity experiment for the Atlantic SST
In order to gain insight into the moisture impact of the At-lantic SSTs on Vb events, the AtAt-lantic SSTs are increased and decreased by 5 K. The two most extreme sensitivity ex-periments are performed to obtain a strong signal in the re-sults. Since this large change in the Atlantic SSTs does not strongly impact precipitation (Sect. 4 for more details) other sensitivity experiments with lower SST amplitudes are not performed.
The increase in the Atlantic SSTs in our experiment has been chosen according to the increase in SSTs in the sen-sitivity experiments of the Mediterranean SSTs described in Sect. 2.4.3. This is to obtain some consistency within the two families of the SST sensitivity experiments.
2.4.3 Sensitivity experiments for the Mediterranean SST
For the sensitivity experiments within the Mediterranean Sea, 10 sensitivity simulations plus a control simulation are performed for each of the five Vb events. This corresponds to homogeneous SST changes within the Mediterranean Sea
between−5 and+5 K, in 1 K intervals (0 K is the control
simulation). The ERA-Interim SST field is used to calculate the horizontally interpolated SST field for the input file used by WRF. The homogeneous increase in SSTs is added to the horizontally interpolated WRF grid obtained according to the WRF Preprocessing System (WPS) and not to the original ERA-Interim data set itself. This is done to avoid any incon-sistencies in the increased Mediterranean SSTs at grid points close to the coast lines, related to differences in the land–sea mask of the ERA-Interim and WRF domains.
is in line with the spread of projected scenarios for several periods of the 21st century.
3 Model evaluation of the control simulations
The control simulations of the five Vb events are used in the following as reference for the different sensitivity ex-periments. As this analysis shall show the ability of WRF to realistically reproduce such events, key variables of these control simulations are compared to observational data sets and ERA-Interim data. The analysis focuses on precipitation and the trajectories of the Vb events.
3.1 Precipitation
To show the performance of WRF in simulating Vb cyclones and their impact, we first focus on precipitation. Daily accu-mulated precipitation and multi-day sums of daily accumu-lated precipitation are evaluated in two different areas.
First, both variables are compared to observations for the entire domain 3 using E-OBS. For this the E-OBS data set is bilinearly interpolated onto the grid of the innermost do-main and the ocean grid points are masked since the E-OBS data are land only. For the comparison, the simulated and observed mean daily accumulated precipitation for five Vb events is shown in Fig. 2a. WRF generally simulates higher daily accumulated precipitation compared to E-OBS across all 5 days of the Vb events. These differences are mainly caused by an overestimation of the simulated precipitation during the first 2 days of each event and coincide with the highest daily accumulated precipitation. As a consequence of this, the multi-day sums of daily accumulated precipitation in domain 3 are systematically higher for WRF throughout all the selected Vb events than E-OBS in domain 3 (Fig. 2b). This mismatch can be attributed to some extent to deficien-cies in the E-OBS data since it is known that precipitation is underestimated in the E-OBS data, especially over moun-tainous areas and during summer (Hofstra et al., 2009). The reason is that precipitation is mainly driven by convection during summer, and thus it is very local, making it difficult to capture these phenomena with the sparse observation net-work that is available over the Alps (Hofstra et al., 2009). Additionally, some of the overestimation by WRF can be at-tributed to the finer resolution compared to E-OBS. Hence, lower values are expected for the coarser E-OBS grid, as each grid point represents an average over a larger area compared to the WRF grid (Göber et al., 2008). Furthermore, possible positive biases in the average precipitation of the regional model additionally increase the differences between E-OBS and WRF.
Second, the same variables are compared in a smaller area focusing over the Alps, which is depicted by the “Alps” box in Fig. 1. In this case, the simulated extreme daily accu-mulated precipitation compared to E-OBS and EURO4m-APGD tends to be around a one-to-one relationship (second
row in Fig. 2), indicating a close resemblance between the observed and simulated daily accumulated precipitation dur-ing the different Vb events. The same is also true for the multi-day sums of daily accumulated precipitation during the complete event. Note that as indicated before, WRF over-estimates daily accumulated precipitation compared to E-OBS, whereas it generally underestimates precipitation com-pared to EURO4m-APGD data (Fig. 2d). This opposite be-haviour of E-OBS and EURO4m-APGD compared to WRF underlines the argument about the uncertainties in the E-OBS data set as an explanation for the mismatch between simu-lated and observed precipitation for domain 3. Indeed, the EURO4m-APGD data set includes a denser spatial network of the rain-gauge stations. This renders it more suitable to capture the local convective systems that predominantly oc-cur during summer and that lead to the high amounts of pre-cipitation that are simulated by WRF but are not captured by E-OBS.
The evaluation indicates that WRF is able to realistically capture the daily accumulated precipitation and thus also the multi-day sums of daily accumulated precipitation during the five precipitation-intense summer Vb events of interest. Fur-thermore, the fact that WRF overestimates precipitation com-pared to E-OBS underlines the ability of WRF to accurately simulate convective processes over the Alpine area.
3.2 Cyclone track
To evaluate the cyclone trajectories obtained by WRF, the tracks are compared to the ones observed in ERA-Interim data. The latter are detected by a tracking tool (Blender et al.,
1997) applied to the 1.5◦×1.5◦resolved 850 hPa
geopoten-tial height field (see Messmer et al., 2015). Since the down-scaled geopotential height field is affected by high-frequency noise, which is introduced by the fact that the domains are lo-cated over the Alps, the track detection is applied to the out-ermost domain only. The 850 hPa geopotential height field is bilinearly interpolated onto a regular latitude–longitude grid
with 0.5◦×0.5◦ resolution to smooth the field and remove
the high-frequency noise. Nevertheless, the resolution is still somewhat finer than the ERA-Interim grid.
4th day 1st day 2nd day 3rd day
5th day
Multi-day sums of daily accumulated
precipitation WRF [mm] (a)
Daily accumulated precipitation WRF [mm] Daily accumulated precipitation WRF [mm]
Da
ily
a
c
cu
mu
la
te
d
pr
ec
ip
it
a
tio
n
E-OB
S
/ EURO4m [mm]
1st day 2nd day 3rd day 4th day 5th day
Blue icons Red icons
g
E-OBS EURO4 m
g
(c)
1 day 2 days 3 days 4 days 5 days
M
ulti-day sums of daily accumulated
pr
ecipitation
E-OB
S
[mm]
(b)
1 day 2 days 3 days 4 days 5 days
Blue icons Red icons
g
E-OBS EURO4 m
g
(d)
Da
ily
a
c
c
um
u
lat
e
d
p
rec
ipi
ta
ti
o
n
E-OB
S
[mm]
M
ulti-day sums of daily accumulated
pr
ecipitation
E-OB
S
/ EURO4
m [mm
]
Domain 3 Domain 3
Alps Alps
Multi-day sums of daily accumulated
precipitation WRF [mm]
Figure 2.The left column shows the daily accumulated precipitation (mm) obtained by observations plotted against the precipitation obtained
by WRF for(a)domain 3 and(c)the Alps (“Alps” box in Fig. 1) for each of the 5 days of the five different Vb events. The right column depicts the multi-day sums of daily accumulated precipitation (mm) for 1 to 5 days for the observations against the multi-day sums obtained by the WRF simulations for(b)domain 3 and(d)the Alps for each of the five Vb events. The upper row uses E-OBS as an observational data set, while the bottom row depicts E-OBS (blue icons) and EURO4m-APGD (red icons) as observational data sets.
4 Sensitivity of Vb cyclones to soil moisture and
Atlantic Ocean and Mediterranean SSTs
In the following we present the analysis of the different ideal-ized sensitivity experiments focusing on daily mean precip-itation, moisture flux over land and the Mediterranean Sea, precipitable water, and convective available potential energy (CAPE). These variables are able to provide insight into the processes that take place within the moisture exchange from its sources to the atmosphere. Therefore, all variables are av-eraged over domain 3 (tests with areas encircled around the
cyclone centre by≥500 km show similar results). Since most
of the ocean grid points are located over the Mediterranean Sea and only a few over the Atlantic (see domain 3 in Fig. 1), these few grid points have been masked to obtain only the moisture flux over the Mediterranean Sea.
there-˚C
˚C
˚C
˚C
˚C Ctrl
˚C
˚C
˚C
˚C
˚C + + +
+ +
– –
– –
–
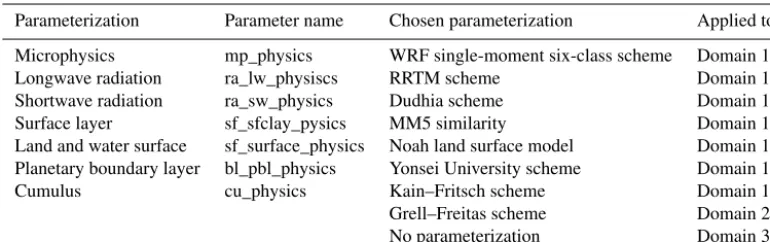
Figure 3.Tracks for the five different Vb events. The black line depicts the tracks that are obtained using the ERA-Interim data set. The
light green line shows the tracks detected in the control simulation. The stippled lines show the tracks of the different Mediterranean SST experiments. The green and black diamonds represent the point of the cyclone at which it reaches the strongest gradient during its lifetime for the control simulation and ERA-Interim, respectively.
fore the region of main interest. The statistical confidence of the differences between the sensitivity experiments and the control simulations is established with the non-parametric
Mann–WhitneyUtest at the 5 % significance level.
4.1 Soil moisture
The idealized soil moisture experiment reveals that a com-plete drainage of the soil moisture volume in the initial condi-tions leads to an average reduction of 32 % in the daily mean
Da ily m e a n p re c ip it a ti o n [kg m
-2 da
y -1] Da ily m e a n u p w a rd m o is tu re
flux over la
nd [kg m
-2 da
y -1] Da ily m e a n u p w a rd m o is tu re
flux over Medite
rra
nean
[kg m
-2 da
y -1] Precipit able water [kg m -2] Me an convec tive ava ilable potential ener gy [10
2 J kg -1] Soil Soil Soil Soil A tlantic O cean A tlantic O cean A tl a n ti c O c e a n A tl a n ti c O c e a n M editerranean Sea M editerranean Sea M editerranean Sea A tlantic O cean +5 K ctrl -5 K +5 K ctrl -5 K +5 K ctrl -5 K +5 K ctrl -5 K +5 K ctrl -5 K +5 K +4 K +3 K +2 K +1 K ctrl -1 K -2 K -3 K -4 K -5 K +5 K +4 K +3 K +2 K +1 K ctrl -1 K -2 K -3 K -4 K -5 K +5 K +4 K +3 K +2 K +1 K ctrl -1 K -2 K -3 K -4 K -5 K +5 K +4 K +3 K +2 K +1 K ctrl -1 K -2 K -3 K -4 K -5 K +5 K +4 K +3 K +2 K +1 K ctrl -1 K -2 K -3 K -4 K -5 K (k ) (c) (d) (f) (g) (j) (a) (m ) (n ) (o ) Soil (b) (e) (h ) ( i) (l ) M e d iterranean Sea M editerranean Sea * * * * * * * * * * * * * * * * * * 17.5 % SMAX ctrl 0 % SMAX ctrl 17.5 % 17.5 % SMAX ctrl SMAX ctrl 17.5 % 17.5 % SMAX ctrl 0 % 0 % 0 % 0 %
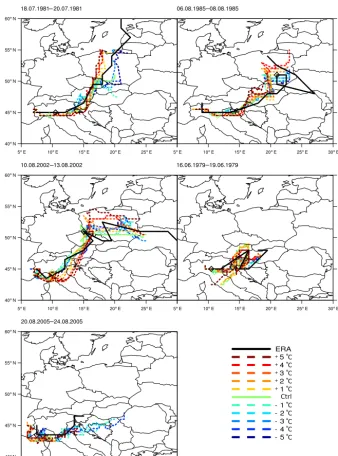
Figure 4.The panels in the first row show the mean over 5 Vb events for the soil experiments with a bar for drainage (0 %, red), southern
daily mean upward moisture flux over land shows an increase of 11 % for full saturation (Fig. 4b). As expected, the daily mean upward moisture flux over the Mediterranean Sea, pre-cipitable water, and CAPE reveal only small changes for the two experiments with the soil moisture volume and conse-quently, they do not show significant changes (Fig. 4c–e). Therefore, the reduction in precipitation as well as in precip-itable water with a complete drainage can be attributed to a reduction in moisture flux from the land (Fig. 4b), which is in turn a direct consequence of the complete removal of the soil moisture volume.
The reason is that a reduction (increase) in soil moisture volume leads to a reduction (increase) in latent heat flux and therefore to an increase (reduction) in sensible heat flux. This further decreases (increases) precipitation since relative hu-midity over land is strongly modified during these experi-ments (not shown). There is a slight reduction (increase) in the mean upward moisture flux over the Mediterranean Sea. These changes are not significant and hence their changes are not analysed in more detail here.
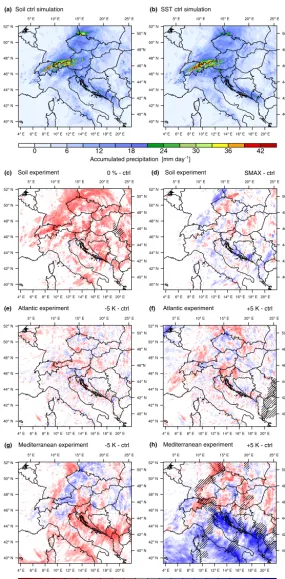
The average spatial precipitation patterns obtained within the soil experiment show a strong reduction in the continen-tal precipitation for the complete drainage experiment com-pared to the control simulation (Fig. 5a). Especially higher elevated regions such as the Alpine mountain ridge or the Dinaric Alps are affected by the decrease in precipitation. In contrast, the differences in the spatial precipitation patterns between the full saturation experiment and the control sim-ulation are small (Fig. 5d). This is also true for the south-ern Spanish soil condition experiments (not shown). Further-more, only a few small areas of the differences between the two most extreme sensitivity experiments are significant at
the 5 % level using a non-parametric Mann–WhitneyUtest,
also indicating a high variability in the exact location of the precipitation changes within the five cases.
4.2 Atlantic SSTs
The sensitivity experiment with increased and decreased SSTs in the Atlantic Ocean reveals only moderate changes in all variables (Fig. 4f to j), and none of the variables show significant changes compared to the control simulation. For mean daily precipitation in domain 3, there is almost no change detectable with changing Atlantic SSTs. Daily mean moisture flux over land, precipitable water, and CAPE show a very small change with decreasing and also increasing At-lantic SSTs compared to the control simulation (Fig. 4g, i, j). The daily mean moisture flux over the Mediterranean Sea shows an inverse behaviour compared to the rest of the vari-ables, i.e. an increase (decrease) in Atlantic SSTs results in a decrease (increase) of 9 % (7 %) compared to the control ex-periment (Fig. 4h). This is because the impact of the Atlantic SSTs is only indirectly captured. The surface moisture flux over the Atlantic Ocean increases (decreases) with increasing (decreasing) SSTs and thus the atmospheric moisture
con-tent becomes more (less) saturated when the air reaches the Mediterranean Sea. Hence, the Mediterranean Sea behaves in the opposite direction as the Atlantic, i.e. a reduced mois-ture flux over the Mediterranean Sea is observed as long as the Atlantic Ocean supplies the atmosphere with moisture, and vice versa. Note that the changes in moisture flux over the Mediterranean Sea are still relatively small and indeed insignificant.
This lack of sensitivity to Atlantic SSTs means that pre-cipitation of high-impact summer Vb events hardly changes with changing SSTs. Therefore, the precipitable water in do-main 3 also only increases slightly. As moisture content in the atmosphere increases marginally, the latent energy re-mains almost unchanged and thus CAPE does not vary be-tween these experiments.
The small observable sensitivity in the mean (Fig. 4) is also evident in the precipitation patterns of the Atlantic SST experiment. The two most extreme sensitivity experiments show on average over the five precipitation-intense summer Vb events in both cases a patchy pattern with insignificant anomalies of both signs throughout domain 3 (Fig. 5e and f). The insignificance can be explained by a large case-to-case variability in the precipitation changes for the five Vb events selected.
4.3 Mediterranean SSTs
An increase (decrease) in the SSTs of the Mediterranean Sea leads on average over the five Vb events to an increase (de-crease) in daily mean precipitation, daily mean upward mois-ture flux over the Mediterranean Sea, precipitable water, and mean CAPE (Fig. 4k–o). Particularly, an increase of 5 K in the Mediterranean SSTs leads to a significant increase in pre-cipitation of 24 % on average, while a reduction in Mediter-ranean SSTs induces a reduction in precipitation of only 9 % compared to the control simulation (Fig. 4k). This indicates a non-linear relationship that is further discussed below. The daily mean upward moisture flux over land shows no change over the different Mediterranean Sea sensitivity experiments (Fig. 4l). As expected, changes in the Mediterranean SSTs have the strongest impact on the daily mean moisture flux over the Mediterranean Sea compared to the other variables shown in Fig. 4. This is because an increase (a reduction)
in SSTs of 5 K results in a change of 124 % (−65 %) in the
mean moisture flux over the Mediterranean Sea compared to the control simulation (Fig. 4m). In addition to the daily mean upward moisture flux over land, precipitable water also shows small deviations due to changes in the Mediter-ranean SSTs compared to the control simulation. Hence, pre-cipitable water increases (decreases) insignificantly by 8 % (4 %) with an increase (a decrease) of 5 K in the Mediter-ranean SSTs (Fig. 4n).
Differences in accumulated precipitation [mm day-1 ]
Soil experiment 0 % - ctrl ((d) Soil experiment SMAX - ctrl
(e) Atlantic experiment -5 K - ctrl (f) Atlantic experiment +5 K - ctrl
(g) Mediterranean experiment -5 K - ctrl (h) Mediterranean experiment +5 K - ctrl
(c)
(b)SST ctrl simulation
(a)Soil ctrl simulation
Accumulated precipitation [mm day ]-1
Figure 5.Panel(a)shows the accumulated precipitation (mm day−1) for the control simulation of the soil moisture experiments averaged
over the five Vb events. Panel(b)shows the same as panel(a)but for the SST experiments. The second to fourth rows show the differ-ences between the mean daily precipitation obtained by the different sensitivity experiments and the control simulation (mm day−1). Panel
can be due to two different mechanisms. One is the increased moisture flux induced by increased SSTs. This increased moisture flux leads to a mostly linear increase in the aver-age atmospheric moisture, as demonstrated by the amount of precipitable water in Fig. 4n. Nevertheless, the non-linear behaviour observed in the average precipitation is driven by an increase in atmospheric instability, i.e. CAPE. Hence, an increase in atmospheric water vapour goes along with an in-crease in latent heat and leads to additional convection, which is capable of removing an even larger portion of water than expected from the single increase in atmospheric moisture.
As expected from the distinct changes described above, Mediterranean SST variability leads to significant anomalies
in the average precipitation pattern for the+5 K experiment
(Fig. 5h). The experiments with +1 to +3 K show almost
no significance, whereas the +4 K experiments show
sim-ilar significance patterns as the +5 K experiment, but with
a smaller amplitude (not shown). The cooling experiments,
including the −5 K experiment, do not generate significant
changes on the 5 % significance level (Fig. 5g) compared to the control simulation (Fig. 5b). For the sensitivity exper-iments with the Mediterranean SSTs, an increase in SSTs leads to a strong increase in precipitation over coastal areas, together with a reduction in precipitation over the Alpine ar-eas. This is explained by the loss of moisture over the coastal areas in the sensitivity experiments induced by the destabi-lization of the atmosphere pointed out above. Note that the changes over the coastal areas are not significant since the exact location and amount of precipitation varies across the five high-impact summer Vb events. This increased precipi-tation is responsible for the removal of great amounts of at-mospheric moisture so that the precipitation over central Eu-rope, and especially the Alps, is reduced as a side effect. The significant pattern in precipitation reduction nicely resembles the water transport towards the Alps that is significantly
re-duced for the+5 K Mediterranean SST experiment. In case
of a cooling, there is a reduced precipitation over coastal ar-eas because of an incrar-eased stability of the atmosphere. Since the precipitation is reduced in coastal areas, the air is more likely saturated when it hits the Alps during the Vb event. Hence, more precipitation can fall in the Alpine region dur-ing the event with decreased SSTs in the Mediterranean Sea. However, such changes for a decrease in Mediterranean SSTs are not significant on the 5 % significance level.
4.4 Discussion
The three families of sensitivity experiments suggest that the Vb events are mostly sensitive to changes in the Mediter-ranean Sea and seem to be rather insensitive to changes in the Atlantic SSTs and the soil moisture content. This is because an increase of 5 K in the Mediterranean SSTs leads to a rise in precipitation of up to 24 % over central Europe. This high number can otherwise only be exceeded by an initialized and complete desaturation of the soil moisture in all of domain
1 and all four layers of the Noah soil model implemented within WRF. However, the latter experiment is an unrealistic extreme and more realistic situations are not likely to pro-voke an appreciable impact on the severity of precipitation-intense summer Vb events, as the southern Spanish soil con-dition experiment confirms. Furthermore, the insensitivity of the Vb events to Atlantic SST changes might also be due to the fact that they are all observed during summer. This is consistent with the argument that the North Atlantic might influence the atmospheric moisture more strongly in winter (Sodemann and Zubler, 2010). Still this does not mean that the Atlantic has no influence on the Vb cyclones throughout a season as seasonal SST change might change the atmo-spheric circulation, stimulating the generation of a Vb cy-clone. Nevertheless, such responses cannot be assessed with the experimental design selected and are thus beyond the scope of the study.
of a single case study. Thus, it cannot be expected that the average behaviour of several Vb events fully agrees with sin-gle case studies. Even though the agreement between these events is relatively large, there is still case-to-case variability. Additionally, it is noteworthy that the fact that the Mediter-ranean Sea seems to be the main contributor to heavy pre-cipitation events independent of case studies is in line with Gimeno et al. (2010).
Furthermore, the increase in precipitation in coastal areas as they were found for the Mediterranean SST experiment is confirmed by the study of Meredith et al. (2015). In their study they attributed a strong increase in precipitation at the eastern coast of the Black Sea to increases in the SSTs of the Black Sea. Meredith et al. (2015) also argued that the strong increase in precipitation is connected to an enhancement of the instability in the lower troposphere that allows the trig-gering of deep convection.
5 Analysis and discussion of changes in cyclone
(and) characteristics
Since the Mediterranean Sea seems to be the most important factor for the high-impact summer Vb events, this section focuses on the sensitivity of the dynamics of the cyclones in the experiments with the Mediterranean SSTs.
The 10 tracks (stippled lines in Fig. 3) obtained by the sen-sitivity experiments with the Mediterranean SSTs for each of the five Vb events line up with the tracks obtained in the control simulation (light green line in Fig. 3). Especially the first time steps of each of the events show a good agreement between the 10 sensitivity experiments and the control sim-ulation. Only during the mature and decaying phases of the cyclones do the tracks within the sensitivity experiment start to diverge (Fig. 3). This indicates that deviations in the track cannot be made responsible for changes in the precipitation within the sensitivity experiments. A strong latitudinal dis-placement of the tracks might have influenced and changed the moisture advection to the impact area over central Eu-rope and hence precipitation amounts. Since only very small deviations within the tracks are found, this effect can be ex-cluded.
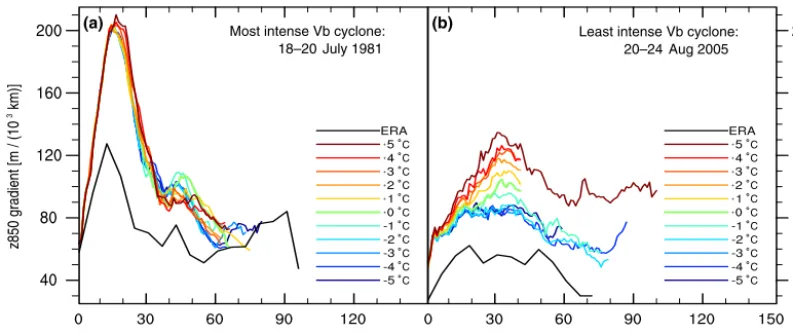
Another important variable for the dynamics of a cyclone
is the mean gradient within an area of 1000×1000 km2 at
850 hPa, which is a measure of the wind intensity around a cyclone assuming the geostrophic approximation. The anal-ysis shows that the cyclone with the steepest gradient during its lifetime is almost insensitive to changes in the Mediter-ranean SSTs (Fig. 6a). In contrast, the cyclone that has the weakest gradient of the five studied Vb events shows a much stronger sensitivity to changes in the Mediterranean SSTs (Fig. 6b). Thus, a warming of the Mediterranean SSTs has the potential to intensify Vb cyclones, while a slight reduc-tion in intensity can be obtained by cooling the Mediter-ranean SSTs. The three other cyclones (not shown) obtain
maximum gradients located in between the ones depicted in Fig. 6. Therefore, it seems that the five summer Vb cy-clones show an increasing sensitivity towards changes in the Mediterranean SSTs with decreasing maximum gradient. This is especially true during the first 30 to 50 h of the life-time of a cyclone, i.e. during the intensification phase. These results may indicate that a maximal threshold of the cyclone is reached in the most intense Vb cyclone; thus, only weaker cyclones are able to intensify with warmer Mediterranean SSTs. This threshold can be interpreted as an energy thresh-old as the gradient in 850 hPa geopotential height around a cyclone is related to the wind speed (via the geostrophic ap-proximation) and thus the kinetic energy. Therefore, our re-sults indicate that warmer Mediterranean SSTs lead in a non-linear way to stronger kinetic energy, whereas the growth of the strongest cyclones might be capped by a possible upper energy limit. This result is in line with the work of Pepler et al. (2016) on southern hemispheric cyclones. They inves-tigated the influence of eastern Australian coastal SSTs on extratropical cyclone intensification and results suggest that SSTs play only a minor role in the intensification of the most intense cyclones, as they are more strongly influenced by the prevailing atmospheric conditions. Also, the work of Blender et al. (2016), who analysed extreme values in vorticity and GPH fields during the winter, support that extremes in the GPH might be limited by an upper bound.
6 Summary
In this study, we identify the main moisture source for a com-posite of five different high-impact summer Vb events. For this, three different families of idealized sensitivity exper-iments are carried out over five precipitation-intense sum-mer Vb events that occurred in the period between 1979 and 2013. The three sensitivity experiments include artificial re-moval and supply of soil moisture as well as changes in the SSTs of the Atlantic Ocean and the Mediterranean Sea. The experiments are conducted with the regional model WRF, driven with the ERA-Interim reanalysis data set.
The validation of WRF with two observational data sets, E-OBS and EURO4m-APGD, reveals that WRF is generally able to reproduce precipitation amounts in Vb events over the Alpine region. There is however a slightly better agree-ment with EURO4m-APGD, which suggests that the convec-tive processes largely responsible for summer precipitation in the Alps are reasonably reproduced by the model. Hence, the latter database seems to be more suitable than E-OBS for recording the precipitation in this area of complex topogra-phy.
Time [h]
Least intense Vbcyclone: 20–24 Aug 2005
˚C ˚C ˚C ˚C ˚C ˚C ˚C ˚C ˚C ˚C ˚C + + + + + +
z850 gr
a
die
nt [
m / (10
3 km)]
Most intense Vbcyclone: 18–20 July 1981
˚C ˚C ˚C ˚C ˚C ˚C ˚C ˚C ˚C ˚C ˚C + + + + + +
Time [h]
(a) (b)
Figure 6.The gradient within an area of 1000×1000 km2for the geopotential height at 850 hPa is shown for two different Vb events. The
coloured lines indicate changes in the gradient over the time of the Mediterranean SST experiments. The black line shows the evolution in the gradient in the ERA-Interim data for the same event. In panel(a)the most intense Vb event (18–20 July 1981) is shown. In panel(b), the least intense of the Vb events (20–24 August 2005) is shown. The data based on WRF show an hourly resolution and a spatial resolution of 0.5◦×0.5◦. The ERA-Interim data are based on 6-hourly temporal resolution, which has been linearly interpolated on 1-hourly temporal resolution, while the spatial resolution is 1.5◦×1.5◦.
Various sensitivity experiments are carried out, which al-low one to draw the folal-lowing conclusions: a complete re-moval of the soil moisture content over great parts of Europe and in all four layers of the soil model in the initial conditions leads to a notable reduction in daily mean upward moisture flux over land, which leads to an increase in sensible heat flux and a reduction in latent heat flux. The increase in sensible heat conversely drives a reduction in relative humidity. The reduction in daily mean upward moisture flux and relative humidity lead to a reduction of approximately 32 % in pre-cipitation over central Europe. For the southern Spanish soil condition sensitivity experiment the processes just described are valid but in a smaller extent such that the reduction in precipitation only reaches 7 %. Conversely, for an increase in soil moisture content the same processes hold but in the inverse and also in a reduced way and hence leads to a small increase of around 7 % in precipitation.
Nevertheless, these soil moisture experiments, but espe-cially the complete drainage experiment, are very unrealis-tic and extreme. Still, it seems unlikely that a considerable impact on the severity of precipitation-intense summer Vb events, i.e. on precipitation amounts, can be obtained in more realistic scenarios.
The changes in precipitation patterns for the soil mois-ture experiment generally show a decrease (increase) over domain 3 for a full drainage (saturation) of the soil moisture content. Nevertheless, the case-to-case variability for the lo-cation of the precipitation changes is high and inconsistent, and thus no significant changes are found (5 % significance level).
Similarly, the sensitivity experiments varying the Atlantic SSTs show almost no change in precipitation over domain
3, indicating that on average the Vb events are hardly sen-sitive to changes in the Atlantic SSTs. The same holds true for the precipitation pattern changes for the Atlantic Ocean. In these experiments the sign and location of changes varies between single Vb events, and hence no significant change can be found, either for increasing or for decreasing Atlantic SSTs.
A 5 K increase in the Mediterranean SSTs leads to a more similar absolute change in precipitation than a complete re-moval of the soil moisture content. Hence, an increase in Mediterranean SSTs of 5 K leads to an increase in precipita-tion of approximately 24 %. The larger precipitaprecipita-tion rates for warmer Mediterranean SSTs are induced by a strong increase in daily mean upward moisture flux over the Mediterranean Sea, together with a decrease in the atmospheric stability in-duced by the release of more latent heat. While the increase in mean upward moisture flux feeds a linear increase in pre-cipitable water, i.e. the water content in the atmosphere, a non-linear increase in CAPE, i.e. the atmospheric instability, leads to convection that is able to remove more moisture from the atmosphere than expected by a single increase in water vapour. Hence, a non-linear behaviour is found in the pre-cipitation sensitivities. This is attributable to an increase in atmospheric instability with increasing Mediterranean SSTs due to a strong significant increase in moisture flux over the Mediterranean Sea. Conversely, a decrease in Mediter-ranean SSTs leads to processes that are inverted from those described before, and thus produces a slight reduction in pre-cipitation over central Europe.
the Alps. This indicates that the air contains enough mois-ture to precipitate out while it is lifted over the Dinaric Alps. Note that the exact location and amount of precipitation does change within the different Vb events, and consequently no significant change can be obtained here. This topographic-induced precipitation leaves the air drier than in the control experiment when it reaches the Alpine area and explains the significant reduction in precipitation over the whole expected air advection path of a Vb event. The same mechanism, but reversed, happens in a cooled Mediterranean SSTs scenario. Still, unlike in the former case, the changes induced by a cooling of the Mediterranean SSTs do not reach a significant level (5 % significance level).
The above-mentioned changes in precipitation amounts and patterns indicate, from all the sensitivities analysed, that these five precipitation-intense summer Vb events are mostly sensitive to changes in the Mediterranean SSTs.
The Mediterranean SST experiments allow further inter-esting findings. While there is a good agreement in the trajec-tories of Vb events across sensitivity experiments, the
inten-sity measured by gradient within an area of 1000×1000 km2
around the cyclone centre is generally different in the various sensitivity experiments carried out. In particular, we found that a warming of the Mediterranean SSTs can lead to an increase in the gradient, and thus to a more intense cyclone during its intensification period within the first 30 to 50 h. Similarly, a decrease in the cyclone intensity is found for a decrease in Mediterranean SSTs. Interestingly, the change in intensity of the cyclone is inversely proportional to the maximal intensity that is obtained during a cyclone’s lifetime in the control experiment. That is, the most intense cyclone shows little to no change in intensity, either for decreasing or for increasing Mediterranean SSTs. This may indicate that strong cyclones are limited in growth of kinetic energy since they might be capped by an upper bound. Conversely, there seems to be the possibility for weaker cyclones to grow in kinetic energy with increasing Mediterranean SSTs in a non-linear way. A possible reason for the limited sensitivity of strong cyclones to changes in the intensity might be that these cyclones are more strongly steered by the large-scale atmo-spheric conditions, as described by Pepler et al. (2016).
As a final remark, these results shall not be understood as climate change projections. An important drawback in this type of sensitivity studies is that to some extent the physical consistency cannot be granted. In our set-up, the most non-physical problem is the heating of the ocean surface alone. This has the effect that a strong and artificial temperature gradient is introduced near the coastal areas, which does not correspond to a natural behaviour. Although in these exper-iments the model seems to bring this disturbance back to a physically plausible situation after a few hours, this in-troduces artefacts in the simulation, which are difficult to isolate. Therefore, obtaining more physically consistent and thus reliable results would require running transient
simula-tions driven by comprehensive Earth system models under realistic climate change scenarios.
Data availability. The data are available upon request
from the corresponding author Martina Messmer ([email protected]).
Author contributions. MM, JJG-N, and CCR contributed to the
design of the experiments. Martina Messmer ran the simulations and wrote the first draft. All authors contributed to the internal re-view of the text previous to the submission.
Competing interests. The authors declare that they have no
con-flict of interest.
Acknowledgements. The authors are grateful for the
fund-ing provided by the Alfred Bretscher-Fonds für Klima- und Luftverschmutzungsforschung. Thanks are also due to the support provided by the Oeschger Centre for Climate Change Research and the Mobiliar Lab for climate risks and natural hazards (Mobilab). Juan José Gómez-Navarro acknowledges the funding provided through the contract for the return of experienced researchers, resolution R-735/2015 of the University of Murcia and the CARM for the funding provided through the Seneca Foundation (project 20022/SF/16). The ERA-Interim reanalysis data were provided by the ECMWF. Furthermore, we acknowledge the E-OBS data set from the EU-FP6 project ENSEMBLES (http://ensembles-eu.metoffice.com) and the data providers in the ECA&D project (http://www.ecad.eu). Thanks are due to European Reanalysis and Observations for Monitoring for providing us with the APGD data set. The simulations are all run at the Swiss National Supercomputing Centre (CSCS). Thanks are due to the two anonymous referees and the editor Rui A. P. Perdigão for their constructive comments that helped to improve the paper.
Edited by: Rui A. P. Perdigão Reviewed by: two anonymous referees
References
Awan, N. K. and Formayer, H.: Cutoff low systems and their relevance to large-scale extreme precipitation in the European Alps, Theor. Appl. Climatol., 129, 149–158, https://doi.org/10.1007/s00704-016-1767-0, 2016.
Blender, R., Fraedrich, K., and Lunkeit, F.: Identification of cyclone-track regimes in the North Atlantic, Q. J. Roy. Meteor. Soc., 123, 727–741, https://doi.org/10.1002/qj.49712353910, 1997.
Blender, R., Raible, C. C., and Franzke, C. L. E.: Vorticity and Geopotential Height Extreme Values in ERA-Interim Data dur-ing Boreal Winters, Q. J. Roy. Meteor. Soc., 143, 634–640, https://doi.org/10.1002/qj.2944, 2016.
Bauer, P., Bechtold, P., Beljaars, A. C. M., van de Berg, L., Bid-lot, J., Bormann, N., Delsol, C., Dragani, R., Fuentes, M., Geer, A. J., Haimberger, L., Healy, S. B., Hersbach, H., Hólm, E. V., Isaksen, L., Kållberg, P., Köhler, M., Matricardi, M., McNally, A. P., Monge-Sanz, B. M., Morcrette, J.-J., Park, B.-K., Peubey, C., de Rosnay, P., Tavolato, C., Thëpaut, J.-N., and Vitart, F.: The ERA-Interim reanalysis: Configuration and performance of the data assimilation system, Q. J. Roy. Meteor. Soc., 137, 553–597, https://doi.org/10.1002/qj.828, 2011.
Fischer, E. M. and Knutti, R.: Detection of spatially aggregated changes in temperature and precipitation extremes, Geophys. Res. Lett., 41, 547–554, https://doi.org/10.1002/2013GL058499, 2014.
Fischer, E. M. and Knutti, R.: Anthropogenic contribution to global occurrence of heavy-precipitation and high-temperature extremes, Nature Climate Change, 5, 560–564, https://doi.org/10.1038/nclimate2617, 2015.
Fischer, E. M., Sedláçek, J., Hawkins, E., and Knutti, R.: Mod-els agree on forced response pattern of precipitation and temperature extremes, Geophys. Res. Lett., 41, 8554–8562, https://doi.org/10.1002/2014GL062018, 2014.
Gangoiti, G., Sáez de Cámara, E., Alonso, L., Navazo, M., Gómez, M. C., Iza, J., García, J. A., Ilardia, J. L., and Millán, M. M.: Origin of the water vapor responsible for the European extreme rainfalls of August 2002: 1. High-resolution simulations and tracking of air masses, J. Geophys. Res.-Atmos., 116, D21102, https://doi.org/10.1029/2010JD015530, 2011.
Gimeno, L., Drumond, A., Nieto, R., Trigo, R. M., and Stohl, A.: On the origin of continental precipitation, Geophys. Res. Lett., 37, L13804, https://doi.org/10.1029/2010GL043712, 2010. Göber, M., Zsótér, E., and Richardson, D. S.: Could a
per-fect model ever satisfy a naïve forecaster? On grid box mean versus point verification, Meteorol. Appl., 15, 359–365, https://doi.org/10.1002/met.78, 2008.
Grams, C. M., Binder, H., Pfahl, S., Piaget, N., and Wernli, H.: Atmospheric processes triggering the central European floods in June 2013, Nat. Hazards Earth Syst. Sci., 14, 1691–1702, https://doi.org/10.5194/nhess-14-1691-2014, 2014.
Hartmann, D., Tank, A. K., Rusticucci, M., Alexander, L., Brönni-mann, S., Charabi, Y., Dentener, F., Dlugokencky, E., Easterling, D., Kaplan, A., Soden, B., Thorne, P., Wild, M., and Zhai, P.: Ob-servations: Atmosphere and Surface, in: Climate Change 2013: The Physical Science Basis, Contribution of Working Group I to the Fifth Assessment Report of the Intergovernmental Panel on Climate Change, edited by: Stocker, T. F., Qin, D., Plattner, G.-K., Tignor, M., Allen, S. G.-K., Boschung, J., Nauels, A., Xia, Y., Bex, V., and Midgley, P. M., Cambridge University Press, Cam-bridge, United Kingdom and New York, NY, USA, 2013. Haylock, M. R., Hofstra, N., Klein Tank, A. M. G., Klok,
E. J., Jones, P. D., and New, M.: A European daily high-resolution gridded data set of surface temperature and precipi-tation for 1950–2006, J. Geophys. Res.-Atmos., 113, D20119, https://doi.org/10.1029/2008JD010201, 2008.
Hofstätter, M. and Chimani, B.: Van Bebber’s cyclone tracks at 700 hPa in the Eastern Alps for 1961–2002 and their compari-son to circulation type classifications, Meteorol. Z., 21, 459–473, https://doi.org/10.1127/0941-2948/2012/0473, 2012.
Hofstra, N., Haylock, M., New, M., and Jones, P. D.: Testing E-OBS European high-resolution gridded data set of daily precipitation
and surface temperature, J. Geophys. Res.-Atmos., 114, D21101, https://doi.org/10.1029/2009JD011799, 2009.
Isotta, F. A., Frei, C., Weilguni, V., Perˇcec Tadi´c, M., Lassègues, P., Rudolf, B., Pavan, V., Cacciamani, C., Antolini, G., Ratto, S. M., Munari, M., Micheletti, S., Bonati, V., Lus-sana, C., Ronchi, C., Panettieri, E., Marigo, G., and Ver-tac˘nik, G.: The climate of daily precipitation in the Alps: de-velopment and analysis of a high-resolution grid dataset from pan-Alpine rain-gauge data, Int. J. Climatol., 34, 1657–1675, https://doi.org/10.1002/joc.3794, 2014.
Jacobeit, J., Philipp, A., and Nonnenmacher, M.: Atmo-spheric circulation dynamics linked with prominent discharge events in Central Europe, Hydrol. Sci. J., 51, 946–965, https://doi.org/10.1623/hysj.51.5.946, 2006.
Kelemen, F., Ludwig, P., Reyers, M., Ulbrich, S., and Pinto, J.: Evaluation of moisture sources for the Central European summer flood of May/June 2013 based on regional climate model simu-lations, Tellus A, 68, https://doi.org/10.3402/tellusa.v68.29288, 2016.
Lee, L. A., Carslaw, K. S., Pringle, K. J., and Mann, G. W.: Mapping the uncertainty in global CCN using emulation, At-mos. Chem. Phys., 12, 9739–9751, https://doi.org/10.5194/acp-12-9739-2012, 2012.
Meredith, E. P., Semenov, V. A., Maraun, D., Park, W., and Cher-nokulsky, A. V.: Crucial role of Black Sea warming in ampli-fying the 2012 Krymsk precipitation extreme, Nat. Geosci., 8, 615–619, https://doi.org/10.1038/ngeo2483, 2015.
Messmer, M., Gómez-Navarro, J. J., and Raible, C. C.: Climatol-ogy of Vb cyclones, physical mechanisms and their impact on extreme precipitation over Central Europe, Earth Syst. Dynam., 6, 541–553, https://doi.org/10.5194/esd-6-541-2015, 2015. MeteoSchweiz: Starkniederschlagsereignis August 2005,
Arbeits-berichte der MeteoSchweiz, 211, 63 pp., 2006.
Mimura, N., Nurse, L., McLean, R., Agard, J., Briguglio, L., Lefale, P., Payet, R., and Sem, G.: Small islands, Climate Change 2007: Impacts, Adaptation and Vulnerability, Contribution of Working Group II to the Fourth Assessment Report of the Intergovernmen-tal Panel on Climate Change, edited by: Parry, M. L., Canziani, O. F., Palutikof, J. P., van der Linden, P. J., and Hanson, C. E., Cambridge University Press, Cambridge, UK, 2007.
Nied, M., Pardowitz, T., Nissen, K., Uwe, Hundecha, Y., and Merz, B.: On the relationship between hydro-meteorological patterns and flood types, J. Hydrol., 519, 3249–3262, https://doi.org/10.1016/j.jhydrol.2014.09.089, 2014.
Pepler, A. S., Alexander, L. V., Evans, J. P., and Sherwood, S. C.: The influence of local sea surface temperatures on Australian east coast cyclones, J. Geophys. Res.-Atmos., 121, 2016JD025495, https://doi.org/10.1002/2016JD025495, 2016.
Saltelli, A., Tarantola, S., and Campolongo, F.: Sensitivity Ana-ysis as an Ingredient of Modeling, Stat. Sci., 15, 377–395, https://doi.org/10.1214/ss/1009213004, 2000.
Seneviratne, S. I., Corti, T., Davin, E. L., Hirschi, M., Jaeger, E. B., Lehner, I., Orlowsky, B., and Teuling, A. J.: Investigating soil moisture-climate interactions in a changing climate: A review, Earth-Sci. Rev., 99, 125–161, https://doi.org/10.1016/j.earscirev.2010.02.004, 2010.
Sodemann, H. and Zubler, E.: Seasonal and inter-annual variability of the moisture sources for Alpine precipita-tion during 1995–2002, Int. J. Climatol., 30, 947–961, https://doi.org/10.1002/joc.1932, 2010.
Sodemann, H., Wernli, H., and Schwierz, C.: Sources of water vapour contributing to the Elbe flood in August 2002 – A tag-ging study in a mesoscale model, Q. J. Roy. Meteor. Soc., 135, 205–223, https://doi.org/10.1002/qj.374, 2009.
Stohl, A. and James, P.: A Lagrangian analysis of the at-mospheric branch of the global water cycle, Part I: Method description, validation, and demonstration for the August 2002 flooding in Central Europe, J. Hy-drometeorol., 5, 656–678, https://doi.org/10.1175/1525-7541(2004)005<0656:ALAOTA>2.0.CO;2, 2004.
Ulbrich, U., Brücher, T., Fink, A. H., Leckebusch, G. C., Krüger, A., and Pinto, J. G.: The central European floods of August 2002: Part 1 – Rainfall periods and flood development, Weather, 58, 371–377, https://doi.org/10.1256/wea.61.03A, 2003a.
Ulbrich, U., Brücher, T., Fink, A. H., Leckebusch, G. C., Krüger, A., and Pinto, J. G.: The central European floods of August 2002: Part 2 – Synoptic causes and considera-tions with respect to climatic change, Weather, 58, 434–442, https://doi.org/10.1256/wea.61.03B, 2003b.
Van Bebber, W.: Die Zugstrassen der barometrischen Minima nach den Bahnenkarten der deutschen Seewarte für den Zeitraum 1875-1890, Meteorol. Z., 8, 361–366, 1891.
Volosciuk, C., Maraun, D., Semenov, V. A., Tilinina, N., Gulev, S. K., and Latif, M.: Rising Mediterranean Sea Surface Tempera-tures Amplify Extreme Summer Precipitation in Central Europe, Scientific Reports, 6, 32450, https://doi.org/10.1038/srep32450, 2016.
Winschall, A., Sodemann, H., Pfahl, S., and Wernli, H.: How important is intensified evaporation for Mediterranean precip-itation extremes?, J. Geophys. Res.-Atmos., 119, 5240–5256, https://doi.org/10.1002/2013JD021175, 2014.