R E S E A R C H
Open Access
Mechanism of continuous high
temperature affecting growth performance,
meat quality, and muscle biochemical
properties of finishing pigs
Xianyong Ma
1,2,3,4,5*, Li Wang
1,2,3,4,5, Zibiao Shi
1,2,3,4,5, Wei Chen
1,2,3,4,5, Xuefen Yang
1,2,3,4,5, Youjun Hu
1,2,3,4,5,
Chuntian Zheng
1,2,3,4,5and Zongyong Jiang
1,2,3,4,5*Abstract
Background:The mechanism of high ambient temperature affecting meat quality is not clear till now. This study
investigated the effect of high ambient temperature on meat quality and nutrition metabolism in finishing pigs.
Methods:All pigs received the same corn-soybean meal diet. A total of 24 Landrace × Large White pigs (60 kg BW,
all were female) were assigned to three groups: 22AL (fed ad libitum at 22 °C), 35AL (ad libitum fed at 35 °C), and 22PF (at 22 °C, but fed the amount consumed by pigs raised at 35 °C) and the experiment lasted for 30 days.
Results:Feed intake, weight gain, and intramuscular fat (IMF) content of pigs were reduced, both directly by high temperature and indirectly through reduced feed intake. Transcriptome analysis of longissimus dorsi (LM) showed that downregulated genes caused by feed restriction were mainly involved in muscle development and energy metabolism; and upregulated genes were mainly involved in response to nutrient metabolism or extracellular stimulus. Apart from the direct effects of feed restriction, high temperature negatively affected the muscle structure and development, energy, or catabolic metabolism, and upregulated genes were mainly involved in DNA or protein damage or recombination, cell cycle process or biogenesis, stress response, or immune response.
Conclusion:Both high temperature and reduced feed intake affected growth performance and meat quality. Apart
from the effects of reducing feed intake, high temperature per se negatively downregulated cell cycle and upregulated heat stress response. High temperature also decreased the energy or catabolic metabolism level through PPAR signaling pathway.
Keywords:Growth performance, High ambient temperature, Meat quality, mRNA array, Restricted feed intake
Introduction
Continuous high temperature, especially in summer in tropical or subtropical countries, is an unfavorable factor in swine production. Persistent exposure to high temperature decreases feed intake [1], growth perform-ance [2], and meat quality [3, 4]. For example, high temperature reduced intramuscular fat (IMF) deposition [5,6] and changed the pH value of the meat [3,7]. These alterations were traditionally believed to result from the
decreased feed intake, but more recent studies have shown that heat stress per se also reduced metabolic rates and altered post-absorptive metabolism, regardless of decreased feed intake [8, 9]. Heat stress also changed expression of some genes related to oxidative metabol-ism, through adaptive physiological mechanisms, to re-duce thermogenesis [7, 10]. Although inferior meat quality induced by heat stress has been intensively stud-ied, the molecular mechanisms underlying the patho-physiological changes remain to be defined. As heat stress does decrease feed intake, it remains unclear what changes are dependent or independent low nutrient availability. Gene expression profiles of longissimus
© The Author(s). 2019Open AccessThis article is distributed under the terms of the Creative Commons Attribution 4.0 International License (http://creativecommons.org/licenses/by/4.0/), which permits unrestricted use, distribution, and reproduction in any medium, provided you give appropriate credit to the original author(s) and the source, provide a link to the Creative Commons license, and indicate if changes were made. The Creative Commons Public Domain Dedication waiver (http://creativecommons.org/publicdomain/zero/1.0/) applies to the data made available in this article, unless otherwise stated.
* Correspondence:[email protected];[email protected]
1Institute of Animal Science, Guangdong Academy of Agricultural Sciences,
Guangzhou 510640, People’s Republic of China
muscle (LM) have been used here to further examine how heat stress affects meat quality and the extent to which it is dependent on reduced feed intake.
Materials and methods Animals and diets
A total of 24 Landrace × Large White pigs (60 kg BW) were assigned randomly to three groups with eight pigs per group. Pigs were housed individually in wire cages (139 × 67 × 115 cm) in one of three temperature-controlled rooms at the Institute of Animal Science, Guangdong Academy of Agricultural Sciences. After adaption for 1 week, pigs were treated as follows: a con-trol group of pigs had ad libitum access to feed at 22 °C (RT) (22AL); the heat-stressed group had ad libitum ac-cess to feed at 35 °C (35AL); and pair-fed pigs at 22 °C (22PF) were fed the amount consumed by pigs raised at 35 °C. All pigs were fed twice daily with a typical corn-soybean meal-based diet for finishing pigs (the diet for-mula is available as Additional file 1: Table S1). The temperature in one room was increased from 22 to 35 °C within approximately 2 h and then remained at 35 °C for the 30-d experimental period; other rooms were maintained at 22 °C. Water was available ad libi-tum for all pigs.
Feeding, slaughter procedure, and sample collection
All aspects of the experiment including transport and slaughtering procedures were carried out in accordance with the Chinese guidelines for the use of experimental animals and animal welfare [11] and approved by the Animal Experimental Committee of the Institute of Ani-mal Science, Guangdong Academy of Agricultural Sci-ences. Pigs were weighed at the beginning and feed intakes were recorded to determine average daily gain (ADG), average daily feed intake (ADFI), and feed to gain ratio (F:G). At the end of the experiment, all pigs were fasted for 14 h, and then slaughtered; the whole LM samples were taken immediately after slaughtered for testing meat quality and parts samples at the last thoracic vertebra were collected and stored at −80 °C for subsequent analyses.
Meat quality measurements
The pH of muscle samples was measured at 45 min, 24 h, and 48 h postmortem using a pH meter (HI 8242C, Beijing Hanna Instruments Science & Technol-ogy, Beijing, China). Meat color CIE LAB values (L*, lightness;a, redness; b, yellowness) were determined on the transverse surface of the LM after it was cut and let to bloom for 45 min at the same times postmortem using a colorimeter (CR-410, Minolta, Suita-shi, Osaka, Japan), as described by Mason et al. [12]. Shear force was measured using an Instron Universal Mechanical
Machine (Instron model 4411; Instron, Canton, MA, USA) and drip loss was measured by weight loss over 24 h at 4 °C in a plastic bag, also as described by Mason et al. [12]. The IMF content was measured by petroleum ether extraction of powdered, lyophilized muscle using the Soxtec 2055 fat extraction system (Foss Tecator AB, Höganäs, Sweden), according to the Association of Offi-cial Analytical Chemists method [13].
RNA extraction and target labeling
Total RNA was isolated from LM using the TRIzol re-agent (Invitrogen, Carlsbad, CA, USA) and purified using a QIAGEN RNeasy® Mini Kit (QIAGEN, Chatsworth, CA, USA) according the manufacturer’s instructions. The RNA quality was checked with a spectrophotometer (ND-1000, Nano-Drop Technologies, Wilmington, DE, USA). Each RNA sample was annealed with a primer containing a poly-dT and a T7 polymerase promoter. Reverse tran-scriptase produced primary and secondary cDNA strands. T7 RNA polymerase was then used to create cRNA from the double-stranded cDNA by incorporating cyanine-3-labeled cytidine 3-CTP according to the labeling kit rec-ommendations (Agilent Technologies, Santa Clara, CA, USA). The quality of the labeled cRNA was again verified.
Hybridization, scanning, and feature extraction
A total of 24 pigs were used and four cRNA pools of two pigs per treatment was hybridized to 12 microarrays (4 × 3 treatments) using a Gene Expression Hybridization Kit (Agilent) at 60 °C for 17 h using whole pig genome arrays (Pig 4x44K Gene Expression Microarrays v2, Agilent). The arrays were washed, stabilized, and dehydrated, as recommended, then examined on a G2565BA microarray scanner (Agilent) and the data were compiled using fea-ture extraction software (FE).
Data analysis of the mRNA microarrays
Array normalizations and error detection were carried out using Silicon Genetics’GeneSpring GX v11.5.1 (Agilent) via the enhanced FE import preprocessor, then was normalized using the supplied algorithms. A final quality control filter was applied to eliminate transcripts with excessive bio-logical variability then GeneSpring was used to reveal genes significantly differing in expression among the 3 treatments. Differentially expressed genes with statistical significance between pairs of treatments were those passing Volcano Plot filtering (Fold Change≥2.0,Pvalue≤0.05).
Real-time PCR analysis
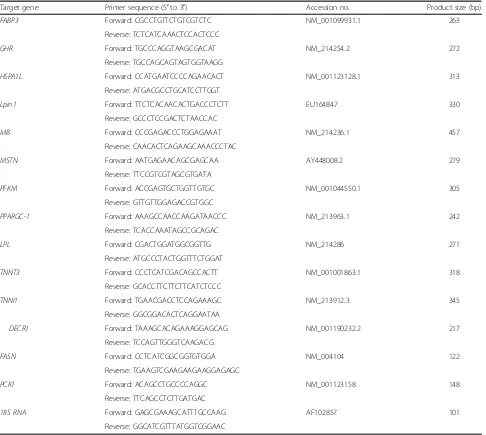
System (Bio-Rad, Hercules, CA) using the iTaq Universal SYBR Green SuperMix (Bio-Rad Laboratories) with gene-specific primers. The primer sequences (listed in
Table 4) were designed using Primer Express 5. The
PCR protocol was as follows: denaturation at 95 °C for 30 s, followed by 40 cycles of 95 °C for 20 s and 60 °C for 20 s, then 72 °C for 30 s. The relative abundance of tran-scripts was expressed as 2-ΔΔCt, where the Ct (threshold cycle) value for each reaction was used to calculate gene expression, and then further normalized to abundance in the 22AL control animals, given a value of 1.
Western blotting
Pools (four pools of two pigs per treatment) of muscle proteins (40 μg, one for each treatment) were separated by SDS-PAGE and proteins were electro-transferred to PVDF membranes at 250 mA for 90 min, as described by Ma et al. [14]. Membranes were blocked overnight at 4 °C with 5% non-fat milk in TBST (10 mmol/L Tris-HCl, pH 8.0, 150 mmol/L NaCl, 0.1% Tween 20). All primary anti-bodies were raised in rabbits and were suitable for detect-ing specific porcine proteins: DECR1(sc-393473, Santa Cruz Biotechnology, Dallas, TX), FABP3 (orb156814, Bior-byt, Berkeley, CA), HSPA1L (bs-18079R, Bioss, Columbia, TN), LPIN1 (sc-50050, Santa Cruz), PEKM (sc-31712, Santa Cruz), TNNI1 (orb106871, Biorbyt), TNNT3 (BWB-MS201C, Genway Biotech, San Diego, CA), PPARGC-1 (bs-7535R, Bioss), MSTN (ab98337, Abcam), FASN (ab128856, Abcam), PCK1 (ab87340, Abcam), and GAPDH (sc-20357, Santa Cruz). Each was used at 1:250 diluted in blocking buffer for 2 h at room temperature. Membranes were washed three times, each for 10 min, with 10 mL TBST then incubated for 1 h in blocking buf-fer containing horseradish peroxidase-labeled (HRP) anti-rabbit secondary antibody (ABCAM Biotechnology, Cam-bridge, UK) diluted 1:5000. After three 10-min washes, immunoreactive proteins were visualized using a chemilu-minescent HRP substrate (Millipore, Billerica, MA) and a Versa Doc imaging system (Bio-Rad). The band densities were calculated by Quantity One software (Bio-Rad) and compared to the density of GADPH. The Western blot analyses were performed in triplicate and data were ana-lyzed with IMAGE J 1.49 software (NIH, Bethesda, MD).
Statistical analysis
The effect of treatment was examined by one-way ANOVA and, where appropriate, means were compared using Fisher’s least significant difference (LSD) post-hoc tests (SPSS V22). Differences were considered to be sig-nificant atP< 0.05. Microarray analyses were conducted using GeneSpring GX v11.5.1, via the enhanced FE im-port preprocessor, then normalized using the supplied algorithms. Significant GO ID pathways were selected by adjustedPvalue < 0.05.
Results
Growth performance and meat quality
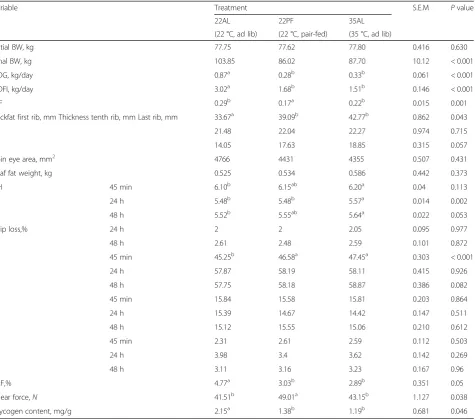
The performance and meat quality data are summarized in Table1. The final BW, ADFI, and ADG of the control pigs (22AL) were much higher than those in the heat-stressed (35AL) or pair-fed pigs (22PF) (P< 0.05), but the backfat thickness of the first rib in the control was lower than that in the heat-stressed or pair-fed pigs (P< 0.05), the latter having the lowest F:G ratio. There were no dif-ferences on loin eye area and leaf fat weight among three groups (P> 0.05). The pH value of LM in 35AL pigs was higher than that in the PF pigs at 45 min postmortem (P< 0.05), was higher than that of other two treatments at 24 h (P< 0.05), and exceeded that of the 22AL pigs at 48 h (P< 0.05). There were no differences in drip loss at 24 h or 48 h postmortem, nor in meat color (a,b, andL* value) except forL* at 45-min postmortem being lowest in the 22AL controls(P< 0.05). Both high temperature and feed restriction decreased IMF content in LM (P< 0.05). The shear force value in 22PF pigs was greatest in 22PF pigs (P< 0.05), without any difference between 35AL and 22AL pigs.
mRNA expression profiling and bioinformatics analysis
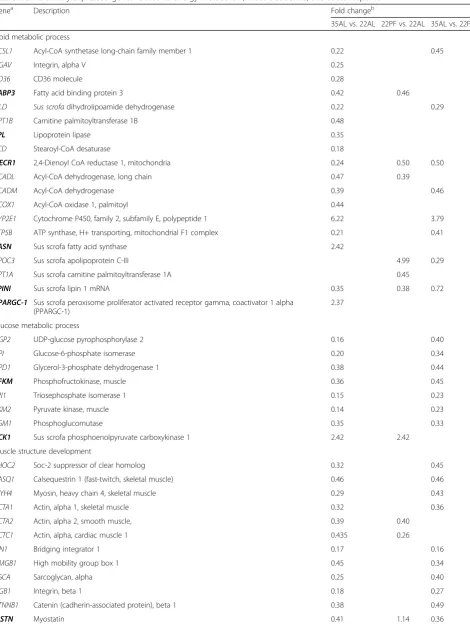
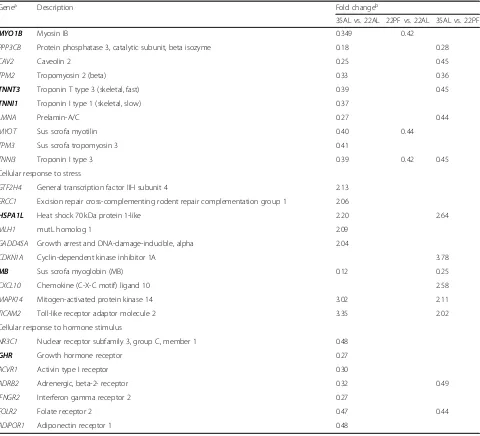
PPARGC-1 in 22PF group were downregulated. Compared with 22PF group, ITGAV, DLD, DECR1, ACADM, ATP5B, and APOC3 (apolipoprotein C-III) were downregulated. Glucose metabolic process related genes (UGP2(UDP-glu-cose pyrophosphorylase 2), GPI (glu(UGP2(UDP-glu-cose-6-phosphate isomerase), GPD1 (glycerol-3-phosphate dehydrogenase 1), PFKM (phosphofructokinase), TPI1 (triosephosphate isom-erase 1), PKM2 (Pyruvate kinase isozyme type M2), PGM1 (Phosphoglucomutase 1)) expression in 35 AL group were lower than those in 22AL and 22PF group. Compared with control, PCK1 was upregulated in 35AL and 22PF group. All the genes related with muscle structure development listed in Table 2 were downregulated in 35AL group and most of them were downregulated in 22PF group compared with the control. Cellular response to stress-related genes
such as GTF2H4 (general transcription factor IIH sub-unit 4), ERCC1 (excision repair cross-complementing rodent repair complementation group 1), HSPA1L (heat shock 70 kDa protein 1-like), MLH1 (mutL homolog 1), GADD45A (growth arrest and DNA- damage-inducible, alpha), CDKN1A (cyclin-dependent kinase inhibitor 1A), MAPK14 (mitogen-activated protein kinase 14), and TICAM2 (toll-like receptor adaptor molecule 2) were upregulated in 35AL group and some of them were upregulated in 22PF group compared with the control. Cellular response to hormone stimulus related genes such as NR3C1, GHR, ACVR1, ADRB2, IFNGR2, FOLR2, and ADIPOR1 in 35AL group was lated and some of them in 22PF group was downregu-lated compared with the control.
Table 1Effect of high temperature and feed restriction on growth performance and meat quality of finishing pigs
Variable Treatment S.E.M Pvalue
22AL 22PF 35AL
(22 °C, ad lib) (22 °C, pair-fed) (35 °C, ad lib)
Initial BW, kg 77.75 77.62 77.80 0.416 0.630
Final BW, kg 103.85 86.02 87.70 10.12 < 0.001
ADG, kg/day 0.87a 0.28b 0.33b 0.061 < 0.001
ADFI, kg/day 3.02a 1.68b 1.51b 0.146 < 0.001
G:F 0.29b 0.17a 0.22b 0.015 0.001
Backfat first rib, mm Thickness tenth rib, mm Last rib, mm 33.67a 39.09b 42.77b 0.862 0.043
21.48 22.04 22.27 0.974 0.715
14.05 17.63 18.85 0.315 0.057
Loin eye area, mm2 4766 4431 4355 0.507 0.431
Leaf fat weight, kg 0.525 0.534 0.586 0.442 0.373
pH 45 min 6.10b 6.15ab 6.20a 0.04 0.113
24 h 5.48b 5.48b 5.57a 0.014 0.002
48 h 5.52b 5.55ab 5.64a 0.022 0.053
Drip loss,% 24 h 2 2 2.05 0.095 0.977
48 h 2.61 2.48 2.59 0.101 0.872
L* 45 min 45.25b 46.58a 47.45a 0.303 < 0.001
24 h 57.87 58.19 58.11 0.415 0.926
48 h 57.75 58.18 58.87 0.386 0.082
a 45 min 15.84 15.58 15.81 0.203 0.864
24 h 15.39 14.67 14.42 0.147 0.511
48 h 15.12 15.55 15.06 0.210 0.612
b 45 min 2.31 2.61 2.59 0.112 0.503
24 h 3.98 3.4 3.62 0.142 0.269
48 h 3.11 3.16 3.23 0.167 0.96
IMF,% 4.77a 3.03b 2.89b 0.351 0.05
Shear force,N 41.51b 49.01a 43.15b 1.127 0.038
Glycogen content, mg/g 2.15a 1.38b 1.19b 0.681 0.046
Data are means with s.e.m.,n= 8
a, b, Within a row, means with a common superscript do not differ (P> 0.05)
To further characterize the types of genes altered in response to heat stress or reduced feed intake, the differ-entially expressed genes were classified according to gene ontology (GO) slim terms. GO slim ranks high level terms from each of the three major gene ontol-ogies: biological process, cellular component, and mo-lecular function. Biological process analysis results are listed in Additional file 2: Tables S2, Additional file 3: Table S3, and Additional file 4: Table S4. Biological process analysis found that the differentially expressed genes were predominantly related to energy metabolism, muscle tissue development, catabolic process, or stress. Compared with the 22AL pigs, the downregulated genes in the 35AL pigs are mainly involved in muscle development or cell growth (GO:0060537, GO:0045927), actin cytoskeleton organization (GO:0030036), cellular ketone or oxoacid meta-bolic process (GO:0042180, GO:0043436), actin filament-based process or actomyosin structure organization (GO: 0030029, GO:0031032), cellular component organization
(GO:0016043), and catabolic process (GO:0009056); the up-regulated genes are mainly involved in RNA processing or translation(GO:0006364,GO:0006412), DNA damage stimu-lus or DNA recombination (GO:0006974, GO:0016444), cell cycle arrest (GO:0022402), and amino acid metabolism (GO: 0043038) (Additional file2: Table S2). Assessing reduced feed intake, compared with 22AL controls, the downregulated genes in 22 PF pigs are mainly involved in muscle contrac-tion or morphogenesis (GO:0006936, GO:0060415), cellular component biogenesis or organization (GO:0044085, GO: 0016043,GO:0071840), and muscle cell differentiation (GO: 0051146); the upregulated genes are mainly involved in re-sponse to nutrient levels (GO:0031667), rere-sponse to extracel-lular stimulus (GO:0009991), lipid, steroid, or acetyl-CoA metabolic process (GO:0006629, GO:0008202, GO:0006084) (Additional file3: Table S3). Assessing direct effects of heat stress, compared with 22PF pigs, the downregulated genes in the 35AL pigs are involved in muscle development (GO: 0060537, GO:0061061), growth rate (GO:0040009, GO:
Table 2Differentially expressed genes related to energy metabolism, muscle structure, and stress response
Genea Description Fold changeb
35AL vs. 22AL 22PF vs. 22AL 35AL vs. 22PF
Lipid metabolic process
ACSL1 Acyl-CoA synthetase long-chain family member 1 0.22 0.45
ITGAV Integrin, alpha V 0.25
CD36 CD36 molecule 0.28
FABP3 Fatty acid binding protein 3 0.42 0.46
DLD Sus scrofadihydrolipoamide dehydrogenase 0.22 0.29
CPT1B Carnitine palmitoyltransferase 1B 0.48
LPL Lipoprotein lipase 0.35
SCD Stearoyl-CoA desaturase 0.18
DECR1 2,4-Dienoyl CoA reductase 1, mitochondria 0.24 0.50 0.50
ACADL Acyl-CoA dehydrogenase, long chain 0.47 0.39
ACADM Acyl-CoA dehydrogenase 0.39 0.46
ACOX1 Acyl-CoA oxidase 1, palmitoyl 0.44
CYP2E1 Cytochrome P450, family 2, subfamily E, polypeptide 1 6.22 3.79
ATP5B ATP synthase, H+ transporting, mitochondrial F1 complex 0.21 0.41
FASN Sus scrofa fatty acid synthase 2.42
APOC3 Sus scrofa apolipoprotein C-III 4.99 0.29
CPT1A Sus scrofa carnitine palmitoyltransferase 1A 0.45
LPINI Sus scrofa lipin 1 mRNA 0.35 0.38 0.72
PPARGC-1 Sus scrofa peroxisome proliferator activated receptor gamma, coactivator 1 alpha (PPARGC-1)
2.37
Glucose metabolic process
UGP2 UDP-glucose pyrophosphorylase 2 0.16 0.40
GPI Glucose-6-phosphate isomerase 0.20 0.34
GPD1 Glycerol-3-phosphate dehydrogenase 1 0.38 0.44
PFKM Phosphofructokinase, muscle 0.36 0.45
TPI1 Triosephosphate isomerase 1 0.15 0.23
PKM2 Pyruvate kinase, muscle 0.14 0.23
PGM1 Phosphoglucomutase 0.35 0.33
PCK1 Sus scrofa phosphoenolpyruvate carboxykinase 1 2.42 2.42
Muscle structure development
SHOC2 Soc-2 suppressor of clear homolog 0.32 0.45
CASQ1 Calsequestrin 1 (fast-twitch, skeletal muscle) 0.46 0.46
MYH4 Myosin, heavy chain 4, skeletal muscle 0.29 0.43
ACTA1 Actin, alpha 1, skeletal muscle 0.32 0.36
ACTA2 Actin, alpha 2, smooth muscle, 0.39 0.40
ACTC1 Actin, alpha, cardiac muscle 1 0.435 0.26
BIN1 Bridging integrator 1 0.17 0.16
HMGB1 High mobility group box 1 0.45 0.34
SGCA Sarcoglycan, alpha 0.25 0.40
ITGB1 Integrin, beta 1 0.18 0.27
CTNNB1 Catenin (cadherin-associated protein), beta 1 0.38 0.49
0040010), glucose metabolism (GO:0006006, GO: 0006096, GO:0006007), and catabolic process (GO: 0009056, GO:0044282); the upregulated genes are in-volved in immune or heat stress response (GO:0006955, GO:0009408), negative regulation of cell cycle (GO: 0045786), response to DNA damage stimulus or DNA re-combination (GO:0006974, GO:0006310), negative regula-tion of catalytic activity (GO:0043086), and protein folding (GO:0006457) (Additional file4: Table S4).
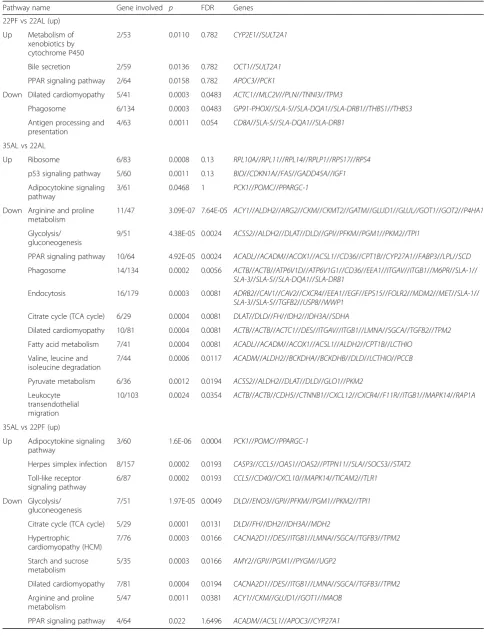
To define the biological pathways potentially associated with heat stress on meat quality or growth performance, KEGG pathway analysis (Table3) revealed that, compared with the 22AL controls, the significantly upregulated
pathways in 35AL were associated with ribosomes, p53 signaling pathway, and adipocytokine signaling pathway, whereas downregulated pathways were related to arginine and proline metabolism, glycolysis/gluconeogenesis, PPAR signaling, phagosome, and endocytosis pathways, citrate cycle (TCA cycle), dilated cardiomyopathy pathway, fatty acid metabolism, valine, leucine and isoleucine degrad-ation, pyruvate metabolism, and leukocyte transendothe-lial migration pathway. Compared with the 22AL controls, metabolism of xenobiotics by cytochrome P450, bile se-cretion, and PPAR signaling pathway were upregulated in 22PF pigs and dilated cardiomyopathy, phagosome and antigen processing, and presentation were downregulated.
Table 2Differentially expressed genes related to energy metabolism, muscle structure, and stress response(Continued)
Genea Description Fold changeb
35AL vs. 22AL 22PF vs. 22AL 35AL vs. 22PF
MYO1B Myosin IB 0.349 0.42
PPP3CB Protein phosphatase 3, catalytic subunit, beta isozyme 0.18 0.28
CAV2 Caveolin 2 0.25 0.45
TPM2 Tropomyosin 2 (beta) 0.33 0.36
TNNT3 Troponin T type 3 (skeletal, fast) 0.39 0.45
TNNI1 Troponin I type 1 (skeletal, slow) 0.37
LMNA Prelamin-A/C 0.27 0.44
MYOT Sus scrofa myotilin 0.40 0.44
TPM3 Sus scrofa tropomyosin 3 0.41
TNNI3 Troponin I type 3 0.39 0.42 0.45
Cellular response to stress
GTF2H4 General transcription factor IIH subunit 4 2.13
ERCC1 Excision repair cross-complementing rodent repair complementation group 1 2.06
HSPA1L Heat shock 70 kDa protein 1-like 2.20 2.64
MLH1 mutL homolog 1 2.09
GADD45A Growth arrest and DNA-damage-inducible, alpha 2.04
CDKN1A Cyclin-dependent kinase inhibitor 1A 3.78
MB Sus scrofa myoglobin (MB) 0.12 0.25
CXCL10 Chemokine (C-X-C motif) ligand 10 2.58
MAPK14 Mitogen-activated protein kinase 14 3.02 2.11
TICAM2 Toll-like receptor adaptor molecule 2 3.35 2.02 Cellular response to hormone stimulus
NR3C1 Nuclear receptor subfamily 3, group C, member 1 0.48
GHR Growth hormone receptor 0.27
ACVR1 Activin type I receptor 0.30
ADRB2 Adrenergic, beta-2- receptor 0.32 0.49
IFNGR2 Interferon gamma receptor 2 0.27
FOLR2 Folate receptor 2 0.47 0.44
ADIPOR1 Adiponectin receptor 1 0.48
a
Genes shown in boldface were used in qPCR verification b
Table 3Significant KEGG pathway analysis
Pathway name Gene involved p FDR Genes
22PF vs 22AL (up)
Up Metabolism of xenobiotics by cytochrome P450
2/53 0.0110 0.782 CYP2E1//SULT2A1
Bile secretion 2/59 0.0136 0.782 OCT1//SULT2A1
PPAR signaling pathway 2/64 0.0158 0.782 APOC3//PCK1
Down Dilated cardiomyopathy 5/41 0.0003 0.0483 ACTC1//MLC2V//PLN//TNNI3//TPM3
Phagosome 6/134 0.0003 0.0483 GP91-PHOX//SLA-5//SLA-DQA1//SLA-DRB1//THBS1//THBS3
Antigen processing and presentation
4/63 0.0011 0.054 CD8A//SLA-5//SLA-DQA1//SLA-DRB1
35AL vs 22AL
Up Ribosome 6/83 0.0008 0.13 RPL10A//RPL11//RPL14//RPLP1//RPS17//RPS4
p53 signaling pathway 5/60 0.0011 0.13 BID//CDKN1A//FAS//GADD45A//IGF1
Adipocytokine signaling pathway
3/61 0.0468 1 PCK1//POMC//PPARGC-1
Down Arginine and proline metabolism
11/47 3.09E-07 7.64E-05 ACY1//ALDH2//ARG2//CKM//CKMT2//GATM//GLUD1//GLUL//GOT1//GOT2//P4HA1
Glycolysis/ gluconeogenesis
9/51 4.38E-05 0.0024 ACSS2//ALDH2//DLAT//DLD//GPI//PFKM//PGM1//PKM2//TPI1
PPAR signaling pathway 10/64 4.92E-05 0.0024 ACADL//ACADM//ACOX1//ACSL1//CD36//CPT1B//CYP27A1//FABP3//LPL//SCD
Phagosome 14/134 0.0002 0.0056 ACTB//ACTB//ATP6V1D//ATP6V1G1//CD36//EEA1//ITGAV//ITGB1//M6PR//SLA-1//
SLA-3//SLA-5//SLA-DQA1//SLA-DRB1
Endocytosis 16/179 0.0003 0.0081 ADRB2//CAV1//CAV2//CXCR4//EEA1//EGF//EPS15//FOLR2//MDM2//MET//SLA-1//
SLA-3//SLA-5//TGFB2//USP8//WWP1
Citrate cycle (TCA cycle) 6/29 0.0004 0.0081 DLAT//DLD//FH//IDH2//IDH3A//SDHA
Dilated cardiomyopathy 10/81 0.0004 0.0081 ACTB//ACTB//ACTC1//DES//ITGAV//ITGB1//LMNA//SGCA//TGFB2//TPM2
Fatty acid metabolism 7/41 0.0004 0.0081 ACADL//ACADM//ACOX1//ACSL1//ALDH2//CPT1B//LCTHIO
Valine, leucine and isoleucine degradation
7/44 0.0006 0.0117 ACADM//ALDH2//BCKDHA//BCKDHB//DLD//LCTHIO//PCCB
Pyruvate metabolism 6/36 0.0012 0.0194 ACSS2//ALDH2//DLAT//DLD//GLO1//PKM2
Leukocyte transendothelial migration
10/103 0.0024 0.0354 ACTB//ACTB//CDH5//CTNNB1//CXCL12//CXCR4//F11R//ITGB1//MAPK14//RAP1A
35AL vs 22PF (up)
Up Adipocytokine signaling pathway
3/60 1.6E-06 0.0004 PCK1//POMC//PPARGC-1
Herpes simplex infection 8/157 0.0002 0.0193 CASP3//CCL5//OAS1//OAS2//PTPN11//SLA//SOCS3//STAT2
Toll-like receptor signaling pathway
6/87 0.0002 0.0193 CCL5//CD40//CXCL10//MAPK14//TICAM2//TLR1
Down Glycolysis/ gluconeogenesis
7/51 1.97E-05 0.0049 DLD//ENO3//GPI//PFKM//PGM1//PKM2//TPI1
Citrate cycle (TCA cycle) 5/29 0.0001 0.0131 DLD//FH//IDH2//IDH3A//MDH2
Hypertrophic cardiomyopathy (HCM)
7/76 0.0003 0.0166 CACNA2D1//DES//ITGB1//LMNA//SGCA//TGFB3//TPM2
Starch and sucrose metabolism
5/35 0.0003 0.0166 AMY2//GPI//PGM1//PYGM//UGP2
Dilated cardiomyopathy 7/81 0.0004 0.0194 CACNA2D1//DES//ITGB1//LMNA//SGCA//TGFB3//TPM2
Arginine and proline metabolism
5/47 0.0011 0.0381 ACY1//CKM//GLUD1//GOT1//MAOB
The comparison between 35AL and 22PF groups of pigs identified direct effects of heat treatment, showing upreg-ulation of adipocytokine signaling pathway, Herpes sim-plex infection, and Toll-like receptor signaling pathway, and downregulation of glycolysis/gluconeogenesis, citrate cycle (TCA cycle), hypertrophic cardiomyopathy (HCM), starch and sucrose metabolism, dilated cardiomyopathy, arginine, and proline metabolism pathways.
Verification of mRNA array analyses with qPCR
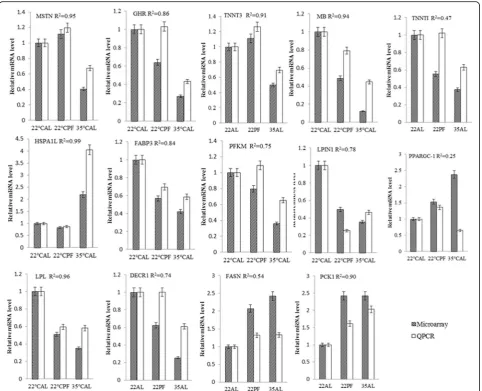
A selection of 14 genes with relatively large change and related to muscular energy metabolism or muscle devel-opment, DECR1, FABP3, GHR, HSPA1L, LPIN1, LPL, MB, MSTN, PFKM, PPARGC1,TNNI1, TNNT3, FASN, and PCK1(see Table2), were chosen to verify that their relative transcript abundance determined by the gene-chips could be confirmed by real-time PCR (qPCR). With the exception ofPPARGC1, there were high corre-lations between the two methods (Fig.2).
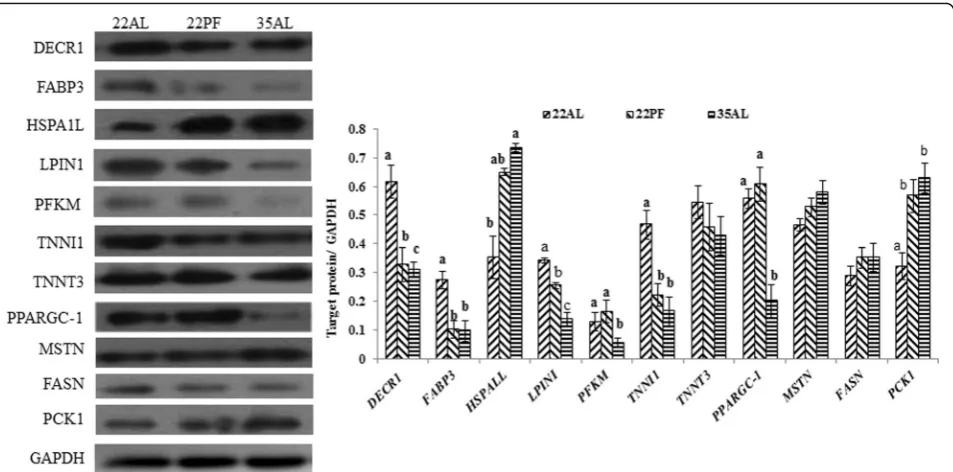
Based on these results, 11 proteins (DECR1, FABP3, HSPAL1, LPIN1, PFKM, TNNT3, TNNI1, PPARGC-1, MSTN, FASN, and PCK1) were selected and corres-pondence between protein abundance, by Western blots, and transcript abundance, by qPCR, was examined. The results (Fig. 3) showed that the relative transcript
abun-dance of 13 genes (DECR1, FABP3, GHR, HSPA1L,
LPIN1,LPL,MB,MSTN,PFKM,TNNT1,TNNT3,FASN, andPCK1) had high correlations to the mRNA array
re-sult. While PPARGC1 had lower correlations to the
mRNA array result. Among 11 proteins, the DECR, FABP3, LPINI, and TNNT1protein levels were downreg-ulated and PCK1 protein level was upregdownreg-ulated in 35AL and 22PF group compared with the control, which were correspondent with their mRNA result, but TNNT3, MSTN, and FASN protein levels in 35AL group and 22PF group were not different from that in the 22AL group, which were not correspondent with their mRNA result. HSPAL1 protein level was upregulated and PFKM was downregulated in 35AL compared with 22PF and 22AL group, which were correspondent with their mRNA result. Both PPARGC-1 protein level and mRNA level in 35AL group were downregulated, which is not consistent with the mRNA array result (Table4).
Discussion
The present study showed that high temperature de-creased the growth performance, which is consistent with others’ findings [1–3]. Le Dividich et al. [6] re-ported that high temperature decreased feed intake and that decreased energy intake was the main reason for the decreased IMF deposition. The restricted feed intake from exposure here to high temperature also decreased
IMF content, indicating that the effect of high
temperature on IMF content was explained mainly by
the decreased feed intake. In addition, many genes re-lated with lipid metabolism such as FABP3, LPL, SCD, DECR, and LPINI were downregulated, which decreased the fat synthesis and deposition. High temperature also increased pH value and decreased the content of glyco-gen in muscle, which is consistent with Hu et al. [15]. The shear force in feed-restricted group is greater com-pared to the control group, because of the lower intramuscular fat. As high temperature decreased the calpastatin expression [16] and possibly enhancing post-mortem proteolysis to offset any decreased tenderness from the lower IMF content, the shear force in higher temperature is not different from the control.
In this study, mRNA array analysis of the LM was used to explore the mechanisms of underlying the ef-fects of high temperature on meat quality and growth performance. High temperature has previously been shown to cause DNA damage [16, 17] and protein mis-folding [18], heat stress increased the expression of heat shock proteins, especially the heat shock protein 70 fam-ily [19,20]. In the present study, the GO analysis showed that high temperature per se upregulated gene expres-sion involved in stress reaction in cells, including
GTF2H4, ERCC1, HSPA1L, POLL, mutL homolog 1
(MLH1), GADD45A, and CDKN1A. HSPAL1 belong to 70-kDa heat shock proteins (Hsp70s), which have house-keeping functions and assist a wide range of folding pro-cesses, including the folding and assembly of newly synthesized proteins, refolding of mis-folded and aggre-gated proteins, membrane translocation of cellular and secretory proteins, and control of the activity of regula-tory proteins [21, 22]. In addition, heat shock proteins also adjust redox balance and relieve oxidative stress through inhibiting the activity of NADPH oxidase [23], which was one of the important reasons for high temperature causing oxidative stress. Compared with the 22PF pigs, the 35AL animals had increased expression of heat shock protein 90 (HSPCB), heat shock protein 90 (HSPH1). The GTF2H4 and ERCC1 genes also are in-volved in DNA repair-related biological processes, reflecting an enhanced self-protecting mechanism under high temperature stress. In addition, genes of ncRNA and rRNA metabolism, protein translation, and transla-tion extension also were upregulated, which might be re-quired by synthesis of heat stress proteins.
Heat stress also affected expression of some genes re-lated to muscle structure. Many studies have reported that high temperature decreased carcass muscle weight [2,24,25]. High temperature here decreased the relative expression of actin protein genes in LM including ACTA2, ACTC1, and ACTA1, myosin heavy chain IIb (MYH4), myofibrillar protein connection (DES), the con-nection protein with the membrane and myofibrils
proteins (CAV2,3),β-Tropomyosin (TPM2), and Integri-nβ1(ITGB1), all involved in muscle structure, fiber de-velopment, or muscle contraction. In addition, the high-temperature treatment induced a fiber transformation from slow type to fast type and downregulated CaMK and PPAR signaling pathways, but limited feed intake did not. The change in fiber type is largely caused by re-duced CaMK and PPAR cell signaling. For example, Gibala et al. [26] reported that over-expression of PPAR-γ induced a cell transformation from type II to type I. High temperature decreased muscle development here, independently of the reduced feed intake.
High temperature also affected expression of the genes related to energy metabolism. Rinaldo and Le Dividich [7] previously reported that high temperature decreased key enzymes related to oxidative and glycolytic
metabolisms including lactate dehydrogenase,
beta-hydroxy coenzyme A dehydrogenase, citrate synthase, and
cytochrome oxidase. Weller et al [10] then reported that high temperature (34 °C) decreased gene expression of
NADH dehydrogenase 1 (ND1), NADH dehydrogenase 2
(ND2), cytochrome C oxidase complex,ATP5,ATP6, and others involved in the electron transport chain. These re-sults implied that long-term exposure to high temperature reduced the level of energy metabolism in muscle. Consistent with those findings, high temperature here decreased expression of phosphofructokinase (PFKM), glucose-6-phosphate isomerase (GPI), pyruvate kinase (PKM2), triosephosphateisomerase 1 (TPI1), isocitrate
dehydrogenase 3 (IDH3A), and others involved in
carbohydrate metabolism, glucose metabolism, and other biological processes. Downregulated expression of these genes indicated that the g glycolytic and oxidative metabolisms were decreased under high temperature environment, and this would be expected to affect meat quality.
High temperature also downregulated genes involved in the TCA cycle, likely indicating reduced total energy metabolism in muscle. It also reduced expression of genes involved in ATP and amino acid synthesis and de-composition. These changes likely provide an adaptive, reduced thermogenic response to heat stress. In the amino acid synthesis and decomposition category, aspartate amino-transferase (GOT) and creatine kinase (CKM) both relate to intramuscular energy, creatine, and ADP phosphoexchange, and therefore generation of hydrogen ions determining postmortem pH [27]. Kwasi-borski et al. [28] reported that high levels of CKM in muscle lead to an increase in the rate of muscle metab-olism within the early stages after slaughter, so that ul-timate pH is lower. High temperature here decreased
the CKM expression, which may be a reason for the
higher pH. Related to decrease the content of IMF, high temperature altered expression of genes involved in lipid metabolism. For example, catalytic subunit A (PPP3CB), signal transducer and activator of transcription 5A (STAT5A), andATP5Bsynthase beta subunit (ATP) were downregulated in animals exposed to high temperature, as were fatty acid binding protein 3 (FABP3), long-chain
acyl coenzyme A dehydrogenase (ACADL),
medium-chain acyl coenzyme A dehydrogenase (ACADM), palmi-toyl coenzyme A oxidase (ACOX1), Ketoacyl CoA Thio-lase (LCTHIO), and carnitine acyl transfer enzyme 1B (CPT1B), involved in fatty acid location and beta oxidation-related processes. A decline in oxidative cap-acity may be another adaptation to high temperature by
reducing thermogenesis. Wu et al. [29] found that high temperature decreased IMF content by decreasing the activities of acetyl coenzyme A (ACC) and fatty acid syn-thase (FAS); it also inhibited beta-oxidation of fatty acids by decreasing the hydroxyacyl CoA dehydrogenase (HAD) in skeletal muscle. FASN, involved in fatty acid synthesis, was upregulated in mRNA array data, but qPCR and Western-blot in this present research showed that there were no differences on FASN protein among three groups, probably the fatty acid synthesis try to compensate for too lower IMF.
In the 22PF animals, the effects of reduced intake were separated from heat-stress per se; genes involved in fatty
acid decomposition including DECR1, LPIN1, FABP3,
and CPT1Awere downregulated; the GO analysis result showed that muscle cell development and cellular com-ponent biogenesis also were downregulated. Some genes related to lipid metabolite such apolipoprotein C3 (APOC3), cytochrome P4502C34 (CYP2C34), P450 2E1 (CYP2E1), sulfate transferase 2A1 (SULT2A1), phospha-tidylserine decarboxylase proenzyme (PISD), serum ret-inol binding protein 4 (RBP4), and PEP carboxykinase1 (PCK1) were not influenced by restricted feed intake. Al-though response to nutrient levels, vitamins and pro-teins, and lipid metabolic process were upregulated, the growth performance and IMF were lower than in 22AL group, which implies that the nutrient or energy intake did not meet the need of the pigs, and the pigs try to synthesize fat or other nutrients, but the nutrient and energy were too low to satisfy the needs of the pigs.
WhileAPOC3,CYP2E1, SULT2A, and PISD were down-regulated in animals exposed to high temperature and GO analysis showed that heat stress, DNA damage, and nega-tive regulation of cell cycle were upregulated, this implied that high temperature damaged the cell function and can-not synthesize the nutrients; pigs in 35AL group did can-not response to the nutrient level, but did response to the heat stress. This finding clearly shows differences between high temperature and limited feed intake in their effects on transcripts related to energy metabolism in muscle.
The most imported signaling pathways, identified by KEGG, are discussed below.
p53 signaling pathway
Skeletal muscle atrophy is reflected in the number of nu-clei [30], reduced mainly through apoptosis and the p53
signaling pathway, activated by stress signals including DNA damage, oxidative stress, and induction and activa-tion of cancer genes. The p53 protein regulates tran-scriptional activation of many genes, mainly involved in cell cycle arrest, cell senescence, and apoptosis [31]. Nitta et al. [32] reported that high temperature arrested cell cycles depending upon the p53 signaling pathway. Exposure of pigs to high temperature in the present study increased expression of genes of the p53 signaling pathway, apoptosis, and skeletal muscle atrophy, but p53 signal pathway was just upregulated in 35ALgroup com-pared with 22AL and 22PFgroup, which implied that the upregulation of p53 signal pathway was a direct temperature effect. Genes such as p21 (CDKN1A), Bid and FasFADD,Caspase 8, and Caspase10were involved
and are known to induce apoptosis [33]. Signaling
Table 4Primer sequences
Target gene Primer sequence (5′to 3′) Accession no. Product size (bp)
FABP3 Forward: CGCCTGTTCTGTCGTCTC NM_001099931.1 263
Reverse: TCTCATCAAACTCCACTCCC
GHR Forward: TGCCCAGGTAAGCGACAT NM_214254.2 272
Reverse: TGCCAGCAGTAGTGGTAAGG
HSPA1L Forward: CCATGAATCCCCAGAACACT NM_001123128.1 313 Reverse: ATGACGCCTGCATCCTTGGT
Lpin1 Forward: TTCTCACAACACTGACCCTCTT EU164847 330
Reverse: GCCCTCCGACTCTAACCAC
MB Forward: CCCGAGACCCTGGAGAAAT NM_214236.1 457
Reverse: CAACACTCAGAAGCAAACCCTAC
MSTN Forward: AATGAGAACAGCGAGCAA AY448008.2 279
Reverse: TTCCGTCGTAGCGTGATA
PFKM Forward: ACCGAGTGCTGGTTGTGC NM_001044550.1 305
Reverse: GTTGTTGGAGACCGTGGC
PPARGC-1 Forward: AAAGCCAACCAAGATAACCC NM_213963.1 242 Reverse: TCACCAAATAGCCGCAGAC
LPL Forward: CGACTGGATGGCGGTTG NM_214286 271
Reverse: ATGCCCTACTGGTTTCTGGAT
TNNT3 Forward: CCCTCATCGACAGCCACTT NM_001001863.1 318
Reverse: GCACCTTCTTCTTCATCTCCC
TNNI1 Forward: TGAACGACCTCCAGAAAGC NM_213912.3 345
Reverse: GGCGGACACTCAGGAATAA
DECR1 Forward: TAAAGCACAGAAAGGAGCAG NM_001190232.2 217 Reverse: TCCAGTTGGGTCAAGACG
FASN Forward: CCTCATCGGCGGTGTGGA NM_004104 122
Reverse: TGAAGTCGAAGAAGAAGGAGAGC
PCK1 Forward: ACAGCCTGCCCCAGGC NM_001123158 148
Reverse: TTCAGCCTCTTGATGAC
18S RNA Forward: GAGCGAAAGCATTTGCCAAG AF102857 101
complexes, including FADD, Caspase 8, andCaspase10, also induced apoptosis [33]. Yamada et al. [34] reported that human fast muscle type may be more likely to be induced to apoptosis and the same is true for rat [35]. So it can be deduced that high temperature induced more fast muscle type production through up-regulating the p53 pathway.
PPAR signaling pathway
PPAR-alpha and PPAR-sigma, members of the nuclear hormone receptor super family [36], influence gene tran-scription of fatty acid oxidation enzymes, such asFABP3, CPT1, and ABCA1 in skeletal muscle [37–39]. In this present study, genes of the PPAR signal pathway were downregulated in pigs exposed to high temperature, as wereACADL, ACADM, ACOX1, ACSL1, andCPT1B, all related to fatty acid beta-oxidation. It also is downregu-lated in 35AL compared with 22PF, but the FDR is very high (FDR = 1.64), the FDR of PPAR signaling pathway in 22PF vs 22AL also is very high (FDR = 0.78). It was deduced, therefore, that high temperature decreased en-ergy metabolism through the PPAR signaling pathway.
Adiponectin signal pathway
Adiponectin is an adipocytokine playing an import-ant role in insulin sensitivity and glucose and lipid metabolism, especially in skeletal muscle; it activates
AMPK, p38MAPK, and PPAR signal pathway [40]
and affects fatty acid metabolism. Adipocytokine sig-naling pathway also was involved in adaptive
re-sponses to heat stress [19], which is important
regulators of energy homeostasis, food intake, and insulin action. In the present research, adiponectin
signaling pathway was downregulated in muscle of pigs exposed to high temperature, which improved energy expenditure as adaptive response to heat stress.
Combining the results of GO and KEGG pathway ana-lyses, the genes downregulated by reduced feed intake were mainly involved in muscle contraction, muscle de-velopment, muscle system process, or differentiation, while the upregulated genes were mainly involved in re-sponse to nutrient levels or extracellular stimuli. Down-regulated genes caused by high temperature were mainly involved in muscle structure and development, energy, or catabolic metabolism, while upregulated genes were mainly involved in DNA or protein damage or recom-bination, or processes of cell cycle, biogenesis, and stress and immune responses. The comprehensive analyses of the transcriptome of porcine skeletal muscle provided here indicate some of the molecular basis for direct ef-fects of exposure to high temperature on traits related to meat quality, distinct from indirect effects resulting from depressed feed intake.
Conclusions
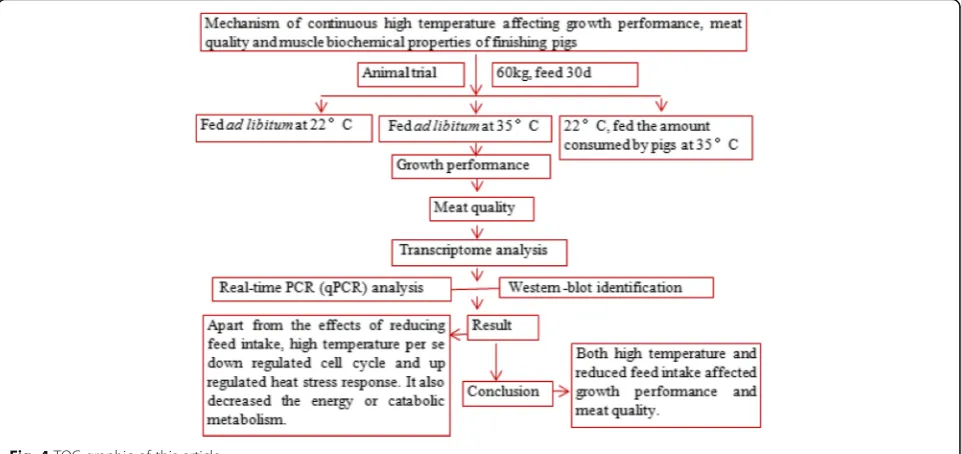
Both high temperature and reduced feed intake affected growth performance and meat quality. Apart from the effects of reducing feed intake, a direct effect of high temperature on growth performance and meat quality also was involved in negatively regulating cell cycle, stimulating protein, DNA damage and cell apoptosis, and heat stress response. High temperature also de-creased the energy or catabolic metabolism level through PPAR signaling pathway (Fig.4).
Additional files
Additional file 1:Table S1.Ingredient 7 composition and nutrient content of the basal diets (DOCX 14 kb)
Additional file 2:Table S2.Go analysis of differently expressed genes in35AL group compared with 22AL group (DOCX 15 kb)
Additional file 3:Table S3.GO analysis of differently expressed genes in 22PF group compared with 22AL group (DOCX 15 kb)
Additional file 4:Table S4.GO analysis of differently expressed genes in 35AL group compared with 22PF group (DOCX 15 kb)
Abbreviations
ADFI:Average daily feed intake; ADG: Average daily gain; AL: Ad libitum; BW: Body weight; F:G: Feed to gain; HCM: Hypertrophic cardiomyopathy; IMF: Intramuscular fat; LM: Longissimus muscle; PF: Pair fed;
PPAR: Peroxisome proliferator activated receptor; RT: Room temperature
Acknowledgements
We thank all authors who participated in this work. We thank W. Bruce Currie (Emeritus Professor, Cornell University) for helping us edit the manuscript.
Funding
This work was supported by grants from Key project of Natural Science Foundation of Guangdong Province (2014A030311010), National Key Research and Development Program of China (2016YFD0500501, 2016YFD0501210), and the earmarked fund for Modern Agro-industry Tech-nology Research System (2017LM1080, 2018LM1080). The National‘973’ Pro-ject of China (2012CB124706-5 and 4).
Availability of data and materials
If any reader needs the data, please contact the author for data requests.
Authors’contributions
XM carried out the meat quality studies, participated in the sample collection, and drafted the manuscript. LW carried out the Western-blot ex-periment. ZS participated to the whole experiment, WC carried out the mRNA analysis, WC carried out the mRNA analysis, XY carried out the RNA extraction, YH participated in the design of the study, CZ participated to the data analysis, and ZJ was in charge of experiment design and participate editing the article. All authors read and approved the final manuscript.
Ethics approval and consent to participate
All aspects of the experiment including transport and slaughtering procedures were carried out in accordance with the Chinese guidelines for the use of experimental animals and animal welfare and approved by the Animal Experimental Committee of the Institute of Animal Science, Guangdong Academy of Agricultural Sciences. Please see reference 11.
Consent for publication
All authors consent to participate and publish this article.
Competing interests
The authors declare that they have no competing interests.
Author details
1
Institute of Animal Science, Guangdong Academy of Agricultural Sciences, Guangzhou 510640, People’s Republic of China.2The Key Laboratory of Animal Nutrition and Feed Science (South China) of Ministry of Agriculture, Guangzhou, China.3State Key Laboratory of Livestock and Poultry Breeding, Guangzhou, China.4Guangdong Key Laboratory of Animal Breeding and Nutrition, Guangzhou, China.5Guangdong Engineering Technology Research Center of animal Meat quality and Safety Control and Evaluation, Guangzhou 510640, China.
Received: 18 January 2019 Accepted: 14 May 2019
References
1. Le Bellego L, Van Milgen J, Noblet J. Effect of high temperature and low-protein diets on the performance of growing-finishing pigs. J Anim Sci. 2002;80:691–701.
2. Collin A, van Milgen J, Dubois S, Noblet J. Effect of high temperature and feeding level on energy utilization in piglets. J Anim Sci. 2001;79(7):1849–57. 3. Lefaucheur L, Le Dividich J, Mourot J, Monin G, Ecolan P, Krauss D. Influence
of environmental temperature on growth, muscle and adipose tissue metabolism, and meat quality in swine. J Anim Sci. 1991;69:2844–54. 4. Witte DP, Ellis M, McKeith FK, Wilson ER. Effect of dietary lysine level and
environmental temperature during the finishing phase on the intramuscular fat content of pork. J Anim Sci. 2000;78:1272–6.
5. Čandek-Potokar M,Žlender B, Lefaucheur L, Bonneau M. Effects of age and/ or weight at slaughter on longissimus dorsi muscle: biochemical traits and sensory quality in pigs. Meat Sci. 1998;48:287–300.
6. Le Dividich J, Noblet J, Herpin P, Van Milgen J, Quiniou N. Thermoregulation. In: Progress in pig science; 1998. p. 229–63. 7. Rinaldo D, Le Dividich J. Effects of warm exposure on adipose tissue and
muscle metabolism in growing pigs. Comp Biochem Physiol A Physiol. 1991;100(4):995–1002.
8. Bernabucci U, Lacetera N, Danieli PP, Bani P, Nardone A, Ronchi B. Influence of different periods of exposure to hot environment on rumen function and diet digestibility in sheep. Int J Biometeorol. 2009;53(5):387–95.
9. Gabler NK, Pearce SC. The impact of heat stress on intestinal function and productivity in grow-finish pigs. Animal production Science. 2015;55(12): 1403–10.
10. Weller MM, Alebrante L, Campos PH, Saraiva A, Silva BA, Donzele JL, et al. Effect of heat stress and feeding phosphorus levels on pig electron transport chain gene expression. Animal. 2013;7(12):1985–93.
11. Science and Technology Ministry of China, The guiding suggestion about treating experimental animals amicably. 2006, Document no. 398. 12. Mason LM, Hogan SA, Lynch A, O'Sullivan K, Lawlor PG, Kerry JP. Effect of
restricted feeding and antioxidant supplementation on pig performance and quality characteristics of longissimusdorsi muscle from Landrace and Duroc pigs. Meat Sci. 2005;70:307–17.
13. AOAC. Fat (crude) in meat and meat products (16th method 991.36). Arlington: Association of Official Analytical Chemists; 1995. 14. Ma XY, Lin YC, Jiang ZY, Zheng CT, Zhou GL. Dietary arginine
supplementation enhances antioxidant capacity and improves meat quality of finishing pigs. Amino Acids. 2010;38:95–102.
15. Hu H, Bai X, Shah AA, Dai S, Wang L, Hua J, et al. Interactive effects of glutamine and gamma-aminobutyric acid on growth performance and skeletal muscle amino acid metabolism of 22-42-day-old broilers exposed to hot environment. Int J Biometeorol. 2016;60(6):907–15.
16. Paul C, Murray AA, Spears N, Saunders PT. A single, mild, transient scrotal heat stress causes DNA damage, subfertility and impairs formation of blastocysts in mice. Reproduction. 2008;136(1):73–84.
17. Bruskov VI, Malakhova LV, Masalimov ZK, Chernikov AV. Heat-induced formation of reactive oxygen species and 8-oxoguanine, a biomarker of damage to DNA. Nucleic Acids Res. 2002;30(6):1354–63.
18. Rotiroti JL. Cellular responses to hyperthermia (40-46 degrees C): cell killing and molecular events. Int J Hyperth. 2008;24(1):3–15.
19. Morera P, Basiricò L, Hosoda K, Bernabucci U. Chronic heat stress up-regulates leptin and adiponectin secretion and expression and improves leptin, adiponectin and insulin sensitivity in mice. J Mol Endocrinol. 2012; 48(2):129–38.
20. Lewis MJ, Pelham HR. Involvement of ATP in the nuclear and nucleolar functions of the 70 kd heat shock protein. EMBO J. 1985;4(12):3137–43. 21. Mayer MP, Bukau B. Hsp70 chaperones: cellular functions and molecular
mechanism. Cell Mol Life Sci. 2005;62(6):670–84.
22. Sharp FR, Massa SM, Swanson RA. Heat-shock protein protection. Trends Neurosci. 1999;22(3):97–9.
23. Martindale JL, Holbrook NJ. Cellular response to oxidative stress: signaling for suicide and survival. J Cell Physiol. 2002;192(1):1–15.
25. Bridges TC, Turner LW, Gates RS. Economic evaluation of misting-cooling systems for growing/finishing swine through modeling. Appl Eng Agric. 1998;14(4):425–30.
26. Gibala MJ, McGee SL, Garnham AP, Howlett KF, Snow RJ, Hargreave M. Brief intense interval exercise activates AMPK and p38 MAPK signaling and increases the expression of PGC-1alpha in human skeletal muscle. J Appl Physio. 2009;106(3):929–34.
27. Bendall JR. Postmortem changes in muscle. Struct Funct Muscle. 1973;2(Part 2): 244–309.
28. Kwasiborski A, Sayd T, Chambon C, Santé-Lhoutellier V, Rocha D, Terlouw C. Pig Longissimus lumborum proteome: part II: relationships between protein content and meat quality. Meat Sci. 2008;80(4):982–96.
29. Wu X. Effects of environmental high temperature on fat metabolism in different parts of finishing pigs. Chinese Academy of Agricultural Sciences; 2014. 30. Leeuwenburgh C. Role of apoptosis in sarcopenia. J Gerontol Ser A Biol Sci
Med Sci. 2003;58(11):999–1001.
31. Fridman JS, Lowe SW. Control of apoptosis by p53. Oncogene. 2003;22(56): 9030–40.
32. Nitta M, Okamura H, Aizawa S, Yamaizumi M. Heat shock induces transient p53-dependent cell cycle arrest at G1/S. Oncogene. 1997;15(5):561–8. 33. Juo P, Kuo CJ, Yuan J, Blenis J. Essential requirement for caspase-8/FLICE in
the initiation of the Fas-induced apoptotic cascade. Curr Biol. 1998;8(18): 1001–8.
34. Yamada H, Nakagawa M, Higuchi I, Ohkubo R, Osame M. Type II muscle fibers are stained by anti-Fas antibody. J Neurol Sci. 1995;134(1):115–8. 35. Libera LD, Zennaro R, Sandri M, Ambrosio GB, Vescovo G. Apoptosis and
atrophy in rat slow skeletal muscles in chronic heart failure. Am J Phys. 1999;277(5Pt1):C982–6.
36. Gilde AJ, Van Bilsen M. Peroxisome proliferator-activated receptors (PPARS): regulators of gene expression in heart and skeletal muscle. Acta Physiol Scand. 2003;178(4):425–34.
37. Mascaró C, Acosta E, Ortiz JA, Marrero PF, Hegardt FG, Haro D. Control of human muscle-type carnitine palmitoyltransferase I gene transcription by peroxisome proliferator-activated receptor. J Biol Chem. 1998;273(15):8560–3.
38. Krämer DK, Al-Khalili L, Guigas B, Leng Y, Garcia-Roves PM, Krook A. Role of AMP kinase and PPARδin the regulation of lipid and glucose metabolism in human skeletal muscle. J Biol Chem. 2007;282(27):19313–20.
39. Sprecher DL, Massien C, Pearce G, Billin AN, Perlstein I, Willson TM, et al. Triglyceride: high-density lipoprotein cholesterol effects in healthy subjects administered a peroxisome proliferator activated receptor delta agonist. Arterioscler Thromb Vasc Biol. 2007;27(2):359–65.
40. Yamauchi T, Kamon J, Ito Y, Tsuchida A, Yokomizo T, Kita S, et al. Cloning of adiponectin receptors that mediate antidiabetic metabolic effects. Nature. 2003;423(6941):762–9.
Publisher’s Note