www.atmos-meas-tech.net/10/1665/2017/ doi:10.5194/amt-10-1665-2017
© Author(s) 2017. CC Attribution 3.0 License.
High-resolution mapping of the NO
2
spatial distribution over
Belgian urban areas based on airborne APEX remote sensing
Frederik Tack1, Alexis Merlaud1, Marian-Daniel Iordache2, Thomas Danckaert1, Huan Yu1, Caroline Fayt1, Koen Meuleman2, Felix Deutsch2, Frans Fierens3, and Michel Van Roozendael1
1BIRA-IASB, Royal Belgian Institute for Space Aeronomy, Brussels, 1180, Belgium 2VITO, Flemish Institute for Technological Research, Mol, 2400, Belgium
3IRCEL-CELINE, Belgian Interregional Environment Agency, Brussels, 1210, Belgium
Correspondence to:Frederik Tack ([email protected])
Received: 10 December 2016 – Discussion started: 2 January 2017 Revised: 4 April 2017 – Accepted: 10 April 2017 – Published: 4 May 2017
Abstract. We present retrieval results of tropospheric ni-trogen dioxide (NO2) vertical column densities (VCDs),
mapped at high spatial resolution over three Belgian cities, based on the DOAS analysis of Airborne Prism EXperiment (APEX) observations. APEX, developed by a Swiss-Belgian consortium on behalf of ESA (European Space Agency), is a pushbroom hyperspectral imager characterised by a high spatial resolution and high spectral performance. APEX data have been acquired under clear-sky conditions over the two largest and most heavily polluted Belgian cities, i.e. Antwerp and Brussels on 15 April and 30 June 2015. Additionally, a number of background sites have been covered for the reference spectra. The APEX instrument was mounted in a Dornier DO-228 aeroplane, operated by Deutsches Zen-trum für Luft- und Raumfahrt (DLR). NO2VCDs were
re-trieved from spatially aggregated radiance spectra allowing urban plumes to be resolved at the resolution of 60×80 m2. The main sources in the Antwerp area appear to be re-lated to the (petro)chemical industry while traffic-rere-lated emissions dominate in Brussels. The NO2 levels observed
in Antwerp range between 3 and 35×1015molec cm−2, with a mean VCD of 17.4±3.7×10¹⁵molec cm−2. In the Brussels area, smaller levels are found, ranging be-tween 1 and 20×1015molec cm−2 and a mean VCD of 7.7±2.1×10¹⁵molec cm−2. The overall errors on the re-trieved NO2 VCDs are on average 21 and 28 % for the
Antwerp and Brussels data sets. Low VCD retrievals are mainly limited by noise (1σslant error), while high retrievals are mainly limited by systematic errors. Compared to co-incident car mobile-DOAS measurements taken in Antwerp
and Brussels, both data sets are in good agreement with cor-relation coefficients around 0.85 and slopes close to unity. APEX retrievals tend to be, on average, 12 and 6 % higher for Antwerp and Brussels, respectively. Results demonstrate that the NO2distribution in an urban environment, and its
fine-scale variability, can be mapped accurately with high spatial resolution and in a relatively short time frame, and the con-tributing emission sources can be resolved. High-resolution quantitative information about the atmospheric NO2
horizon-tal variability is currently rare, but can be very valuable for (air quality) studies at the urban scale.
1 Introduction
Nitrogen dioxide (NO2)is an atmospheric trace gas and a
key pollutant that attracts considerable attention due to sev-eral reasons: (1) NO2is a proxy for air pollution in general,
as its abundance mostly coincides with a range of other pol-lutants; (2) recent studies by the World Health Organization (WHO, 2013) have shown that NO2exposure can have a
di-rect health impact; (3) it is a precursor in the formation of aerosols (Chan et al., 2010) and tropospheric ozone (Crutzen, 1970) and therefore it contributes locally to radiative forcing (Solomon et al., 1999), through which it indirectly affects the climate system. In an urban environment, NO2 mainly
originates from anthropogenic sources such as the burning of fossil fuels, related to industrial activities and traffic. NO2
Figure 1. OMI annual NO2 VCD map for Belgium, 2015 and
overview of the three Belgian cities where APEX flights were launched (Google, TerraMetrics, Giovanni, NASA GES DISC, OMNO2d, units in molec cm−2).
vertical) and time, often exceeding limits set by the Eu-ropean legislation, i.e. hourly average limit of 200 µg m−3 and an annual mean limit value of 40 µg m−3(EU Directive 2008/50/EC). For the reasons stated, the accurate monitoring and mapping of the NO2variability at high spatial resolution
is of great relevance.
In this paper, a method is presented to retrieve tropospheric NO2 vertical column densities (VCDs) from hyperspectral
Airborne Prism EXperiment (APEX) observations. A major objective of the study is to assess the technical and oper-ational capabilities of APEX to map the NO2 field at city
scale and at high spatial resolution, in a relatively short time, and furthermore to characterise all aspects of the retrieval approach. APEX, developed by a Swiss-Belgian consortium on behalf of ESA (European Space Agency), is a pushb-room hyperspectral imager, integrating spectroscopy and 2-dimensional (2-D) spatial mapping in one single system. The well-established differential optical absorption spectroscopy technique (DOAS; Platt and Stutz, 2008) is applied to the observed backscattered solar radiation in order to quantify the abundance of NO2in the atmosphere, based on its fine
molecular absorption structures.
For atmospheric NO2detection, a high spectral resolution
is necessary in order to resolve the fast varying spectral sig-natures of this molecule. High spatial resolution, i.e. higher than 100 m, is also required to identify small-scale gradi-ents in the NO2amounts and to resolve individual emission
sources. Although the APEX instrument has been primarily designed for environmental remote sensing of the land sur-face, it also allows for observing atmospheric trace gases as demonstrated in the precursor study of Popp et al. (2012) on APEX tropospheric NO2mapping over Zurich, Switzerland.
In the framework of this study, dedicated APEX flights were launched above three of the largest and most heavily pol-luted urban areas in Belgium, namely Antwerp, Brussels and Liège. We report on the NO2retrieval scheme developed at
BIRA-IASB and on the results of the flight campaigns car-ried out in Belgium, with the focus on the cities of Antwerp and Brussels.
For about 2 decades, systematic mapping of the horizon-tal distribution of tropospheric trace gases, such as NO2, has
been carried out at global scale using spaceborne sensors like SCIAMACHY (Scanning Imaging Absorption Char-tography), GOME (Global Ozone Monitoring Experiment), GOME-2 and OMI (Ozone Monitoring Experiment; see e.g. Richter and Burrows, 2002; Beirle et al., 2010; Boersma et al., 2011; Hilboll et al., 2013; Valks et al., 2011; Bucsela et al., 2013). Such observations are well suited for global monitoring,; however, the coarse spatial resolution of typi-cally several tens of kilometres make them inadequate for detecting city-scale NO2variability and to resolve individual
emission sources (see Figs. 1 and 2). Several studies discuss instruments and experiments for atmospheric trace gas re-trieval from airborne platforms. Most of these works focus on the retrieval of the vertical distribution of trace gases, based on along-track Multi-AXis (MAX-) DOAS observations (see e.g. Petritoli et al., 2002; Melamed et al., 2003; Wang et al., 2005; Bruns et al., 2006; Dix et al., 2009; Merlaud et al., 2011; Baidar et al., 2013). Only a few recent studies report on the high-resolution 2-D spatial mapping of the NO2
hori-zontal distribution from an airborne platform. The discussed hyperspectral imaging systems are based on a whiskbroom (Merlaud et al., 2013; Liu et al., 2015) or pushbroom set-up (Heue et al., 2008; Popp et al., 2012; General et al., 2014; Lawrence et al., 2015; Schönhardt et al., 2015; Meier et al., 2016; Nowlan et al., 2016).
Besides the increased characterisation of horizontal trace gas distribution and related chemical processes in urban ar-eas, high-resolution NO2maps can be valuable for the
cali-bration and validation of satellite products, chemical trans-port models (CTMs) and high-resolution air quality mod-els, e.g. the RIO-IFDM high-resolution air quality model (Lefebvre et al., 2013), developed by the Belgian Interre-gional Environment Agency (IRCEL-CELINE) in coopera-tion with the Flemish Institute for Technological Research (VITO). There is also a general growing interest from the remote sensing community for airborne hyperspectral im-agers as they can complement and link ground-based mea-surements, spaceborne observations and model data.
The paper is organised as follows: Sect. 2 introduces the optical characteristics of the APEX instrument, as well as the hyperspectral data sets acquired at three major Belgian cities. Section 3 discusses post-flight, preprocessing steps in order to improve the signal-to-noise ratio (SNR) and the spectral performance. Section 4 characterises the key steps of the developed methodology to derive NO2 VCDs from APEX
Figure 2.Details of the APEX flight plan over Antwerp on 15 April 2015 and comparison with a space-borne nadir OMI and TROPOMI pixel (Google, DigitalGlobe).
Table 1.APEX spatial performance and instrumental specifications.
Spatial performance (at 6100 m a.g.l.)
Spatial CCD 1000 pixels FOV (across-track) 28◦ Swath width 3000 m IFOV (across-track) 0.028◦ Ground speed 72 m s−1 Integration time 58 ms Spatial resolution (across-track) 3 m Spatial resolution (along-track) 4 m
proper error characterisation. The following section presents and discusses the retrieved NO2 field above Antwerp and
Brussels. In Sect. 6, the retrieved VCDs are quantitatively as-sessed by intercomparison with correlative data sets (mobile DOAS and mini MAX-DOAS).
2 APEX instrument and data sets
2.1 APEX optical unit and spatial performance
The APEX instrument was designed and developed by a Swiss–Belgian consortium on behalf of ESA. Since 2011, APEX has been fully operational for data acquisition flights. A brief overview of the optical unit, the core element of the instrument, is given here. Solar radiation, backscattered by the Earth’s surface or atmosphere within the field of view (FOV) of the instrument enters the optical unit through a curved slit. A collimator groups and redirects the light
to-wards a beamsplitter, separating the VNIR (visible–near in-frared; 370–970 nm) from the SWIR (shortwave inin-frared; 950–2500 nm) channels. The VNIR radiance is spectrally dispersed by a prism, resulting in a greater light through-put and the absence of overlapping orders when compared to a diffraction grating, but with the drawback of a lim-ited resolution and a non-linear wavelength scale (Platt and Stutz, 2008). The dispersed radiation is then projected on a 2-D CCD (charge-coupled device) 14 bit depth area detector, recording the intensity in a series of narrow, contiguous spec-tral bands. The VNIR CCD can record up to 335 unbinned spectral bands. The SWIR channel is not taken further into account in this study as the DOAS analysis is applied to a small part of the visible wavelength region, i.e. 470–510 nm. The sealed optical unit is enclosed by a thermo-regulated box in order to be temperature (19◦C±1◦C) stabilised, while pressure in the spectrometer is kept at 200 hPa above ambient pressure (dry nitrogen atmosphere with partial differential pressure control). To obtain good compensation of the air-craft movement, the whole instrument is mounted and oper-ated on a Leica PAV-30 stabilised platform. A more complete description of the APEX instrument, its optical unit and its calibration concept can be found in Itten et al. (2008), Jehle et al. (2010), D’Odorico (2012), Schaepman et al. (2015) and Kuhlmann et al. (2016).
The spatial performance and relevant specifications of the APEX sensor are given in Table 1. The pushbroom imaging spectrometer consists of 1000 detector pixels across-track (spatial dimensionx), which are illuminated simultaneously, and 335 pixels in the spectral dimension I (λ). The plane formed by the spatial dimensionx and spectral dimension I (λ)is called a frame. Mapping of the NO2distribution
be-low the sensor is carried out using the swath imaging of the pushbroom scanner (spatial dimensionx) and the forward motion of the airborne platform (spatial dimensiony). The resulting 3-D hyperspectral image cubes, built by acquir-ing consecutive frames, consist of two planimetric dimen-sions (x, y)and a third spectral dimensionI (λ). With a field of view (FOV) of 28◦ and a flight altitude of 6.1 km a.g.l., which is much higher than the sampled air masses contain-ing the majority of NO2, the swath covers an area of
2.2 APEX acquisition and data sets
Air pollution levels in the northern part of Belgium are among the highest in Europe. The sources are mainly re-lated to the high population density and rere-lated traffic, and regular transport from industrial sources in the Rhine–Ruhr area in Germany. The annual mean NO2 VCDs for 2015,
retrieved based on OMI observations (OMNO2d, Giovanni, NASA GES DISC), range from 1 to 1.2×10¹⁶molec cm−2 in the northern part of Belgium and are well above the back-ground levels, as can be observed in Fig. 1. The NO2levels
are around 7–8×10¹⁵molec cm−2for the southern part. The coarse spatial resolution of current global monitoring spaceborne instruments makes them inappropriate for stud-ies of the NO2field at the scale of cities. This is illustrated
in Fig. 2 where the typical spatial extent of a nadir obser-vation from the OMI and the future TROPOMI (TROPO-spheric Monitoring Instrument) spaceborne sensors is illus-trated. The latter is the spectrometer payload of the ESA Sentinel-5 Precursor satellite, to be launched in 2017. For the sake of comparison, details of the APEX flight plan over the Antwerp area on 15 April 2015 are also provided. Whereas the Antwerp city centre is nearly fully covered by one TROPOMI pixel, it is sampled by approximately 5000 APEX pixels, which is needed to detect small-scale NO2
hor-izontal variability and to resolve individual emission sources. Note that the original APEX pixels of 3 by 4 m2 are spa-tially binned to pixels of 60 by 80 m2, as will be explained in Sect. 3.1.
The APEX instrument was installed in the Dornier DO-228 D-CODE, based at the Braunschweig research airport and operated by Deutsches Zentrum für Luft- und Raumfahrt (DLR). APEX data were acquired over the three largest and most heavily polluted Belgian cities, i.e. Brussels, Antwerp and Liège, on 14, 15 April and 30 June 2015. The three ac-quisition sites are indicated on Fig. 1. The main characteris-tics of the acquired data sets and covered sites are given in Table 2.
The flight campaign was carefully planned (Vreys et al., 2016a) in order to optimise the acquisition for trace gas re-trieval purposes. However, availability of the plane and crew, technical constraints, flight permissions granted by air traffic control (ATC), and most of all the meteorological conditions seemed to be the main factors constraining and determining the actual flights. APEX was installed in the Dornier DO-228 on 16 March 2015 and starting from that date, a 1-month window was scheduled for the necessary flights. In order to get an optimal NO2signal, early spring was considered to
be a good trade-off: NO2exhibits a peak in the seasonal
cy-cle around winter in the Northern Hemisphere. On the other hand, from the perspective of the solar zenith angle (SZA), flights in summer are considered to be more suitable. High sun maximises the signal or the light backscattered to the sensor and reduces the smoothing of the signal due to shallow sun elevation angle, as discussed in Lawrence et al. (2015).
In summer, there are also more clear-sky days. Due to poor weather conditions, actual flights could only be launched at the end of the foreseen time window. The flights were con-ducted from a small commercial airport, south-east of the Antwerp city centre. There were in total three flight days. A flight over Brussels occurred on the first campaign day, 14 April 2015. However, due to the presence of a substan-tial number of scattered clouds, which seriously disrupted the analysis of the data, Brussels was reflown on 30 June 2015. All other flights occurred under clear-sky conditions and good visibility.
In general, the flight path consists of adjacent straight flight lines, flown systematically in opposite directions, with overlapping footprints (approximately 20 % overlap in the across-track direction between consecutive flight lines) in or-der to have gap-free coverage. For example, the flight lines above Antwerp and Brussels were alternately flown from south to north, and from north to south, with the first flight line in the west. The spectra, acquired during the banking of the plane in order to prepare the acquisition of the next adja-cent flight line, are not taken into account in the processing due to the large roll angles. Flights take place at a constant altitude of 6.1 km a.g.l., which is well above the planetary boundary layer (PBL) in order to capture the full NO2
col-umn below the plane. The flights were carried out as close as possible to local noon when the sun reaches its highest posi-tion, as far this was made possible by ATC and the weather conditions. The three cities were fully covered and a num-ber of flight lines were also extended to rural background sites with decreased levels of NO2. Additionally, a number
of background sites were covered when the plane was flying from or to the airport or when flying from one city to another. These reference spectra, containing low NO2absorption, are
used in the DOAS analysis.
3 Post-flight preprocessing of APEX data for trace gas retrieval
Table 2.Acquired data sets and flight characteristics. Wind and temperature data are collected from weather stations of the Royal Mete-orological Institute (RMI) and averaged over the time of flight. Population data from 1 January 2015 is retrieved from Statistics Belgium: http://statbel.fgov.be/, last access: 15 January 2016. For each flight, the day number of the year 2015 is mentioned between brackets and will be used further in the manuscript to refer to the different flights.
Brussels Antwerp Liège
Date (day of year) 30-06-2015 (181) 15-04-2015 (105) 15-04-2015 (105) Flight time LT (UTC+2) 14:43–16:04 10:06–11:30 11:55–12:18
# flight lines 8 9 3
Flight pattern (Heading◦) 0, 180 0, 180 40, 220 SZA (◦) 29.7–38.6 60.4–49.6 46.0–44.1 Wind direction (◦) 125 235 240 Wind speed (Bft) 2 3 3 Temperature (◦C) 27.2 18.7 20.8 PBL height (m) 1200 500 700 Lat (◦N)/Long (◦E) 50.8/4.4 51.2/4.4 50.6/5.6 Terrain altitude (m a.s.l.) 76 10 66 Total population 1.175.173 513.570 195.968 Population density (#/km2) 6751 2496 2828
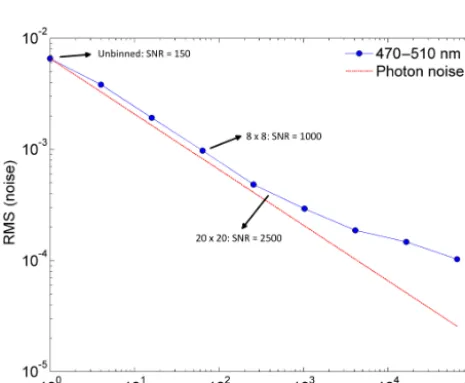
Figure 3.Allan plot illustrating the impact of spatial binning of the raw spectra on the rms of the noise, plotted on a double logarithmic scale.
To reduce the data load and processing time, a spectral subset is taken on the level 0-DC product. The VNIR channel observes radiation in the 370–970 wavelength range while only the subset 370–600 nm is taken into account for the spectral calibration and the DOAS analysis.
3.1 Spatial binning and signal enhancement
The raw, spectrally and spatially unbinned APEX spectra, acquired with an integration time of 58 ms, have a typical signal-to-noise ratio around 150. In order to reduce the noise level and increase the sensitivity of the instrument to NO2,
the raw pixels are spatially aggregated in postprocessing in
the along- and across-track direction. If only shot noise is assumed (which is a good assumption for UV-Vis detec-tors), the noise should decrease with
√
N according to pho-ton statistics, with N as the number of binned spectra.
For a test area, the raw APEX spectra are spatially binned in the along- and across-track direction according to a power of 2, 2n, withnranging from 0 to 8. For each binning level,
a clean reference area is binned in the same way. The binned spectra and the corresponding rms of the noise from the DOAS fit are plotted on a double logarithmic scale in Fig. 3. The applied DOAS settings for the noise analysis are pro-vided in Sect. 4.1 and Table 4. The red curve in the Allan plot represents the statistical shot noise
√
N, scaled to the noise of the unbinned raw spectra. High noise, around 7×10⁻³, can be observed for the unbinned APEX spectra. The measured noise follows photon statistics well until approximately 200 binned spectra, where a deviation of the noise slope occurs. Due to dominant instrumental noise, such as dark current and read-out noise, and systematic errors in the DOAS fit, satura-tion occurs and the noise cannot be significantly reduced any more. The noise is reduced to 4×10⁻⁴or a favourable SNR of 2500 after binning of 20 pixels in along- and across-track direction. As the curve slightly deviates from the statistical shot noise
√
N, the improvement of the SNR, compared to the unbinned spectra, is slightly less than 20 times.
The obtained higher SNR improves the detection limit of the instrument at the cost of a reduction of the original spa-tial resolution. A binning of 20 by 20 pixels is found to be an appropriate trade-off between the obtained instrument sensi-tivity and the spatial detail, leading to an effective GSD of approximately 60×80 m2.
The impact of a different spatial binning on the NO2VCD
bin-Figure 4.Along-track profile of(a)NO2VCDs and(b)rms error
of DOAS fits for three different levels of aggregated spectra, i.e. 8 by 8, 20 by 20 and 50 by 50 pixels. The VCDs are retrieved from an overlapping column on flight line eight of the Antwerp data set and are plotted from north to south.
ning levels, i.e. 82, 202 and 502 pixels, resulting in effec-tive GSDs of 24×32, 60×80 and 150×200 m2. Then, the same north–south along-track profile is taken from the three different sets of retrieved VCDs. As can be seen, the three NO2VCD along-track profiles show the same patterns of
en-hanced NO2, consisting of two major plumes related to
in-dustrial activities in the Antwerp harbour. However, the 82 binned data contain a lot of noise. On the other hand, the 502 binned data smooth out effective NO2signals, e.g. at pixel
2050. The smoothing effect can also be observed in Fig. 5. A horizontal profile of approximately 2500 m was taken per-pendicular to the second major plume and is indicated by a red dotted line in Fig. 15. Then, a Gaussian model was fitted to the obtained profile NO2VCDs for the three different
bin-ning levels. A broadebin-ning of the plume can be observed for the higher binning levels. The width of the fitted Gaussians is expressed as FWHM and increases from 1685 to 2129 and to 2331 m for binnings of 82, 202and 502pixels, respectively. 3.2 APEX spectral performance and wavelength
calibration
A key characteristic of the spectral performance is the in-strument spectral response function (ISRF or slit function), being the response of the instrument to a signal as a func-tion of wavelength. The ISRF can be determined by a peak response, i.e. central wavelength (CW) and response shape, i.e. full width at half maximum (FWHM). Typically for push-broom sensors, each across-track detector element should be considered as a 1-D instrument due to optical aberrations and
Figure 5.Gaussian model fit to the NO2VCDs of a 2500 m
hori-zontal profile, perpendicular to a major industrial NO2plume, for
three different binning levels, i.e. 82, 202and 502pixels.
Table 3.APEX spectral performance for the NO2calibration
win-dow. Both nominal (laboratory performance) and effective (in-flight performance) parameters are provided. Due to the wavelength and pixel-location dependency, FWHM and shift are provided for 490 nm, i.e. the middle of the analysis window, and for the nadir-looking detector pixel of the pushbroom sensor.
Spectral performance for NO2calibration window
Spectral interval 370–600 nm
Spectral pixels 249 (unbinned mode)
Nominal FWHM 1.5 nm
In-flight FWHM > 2.8 and < 3.3 nm
Nominal spectral shift from CW < 0.2 nm (single flight)
In-flight spectral shift from CW > 0.05 and < 0.8 nm
Spectral sampling interval (SSI) 0.9 nm
Sampling rate 3.1 to 3.6 pixels per FWHM
misalignments, with an intrinsic spectral response which is slightly different from the others.
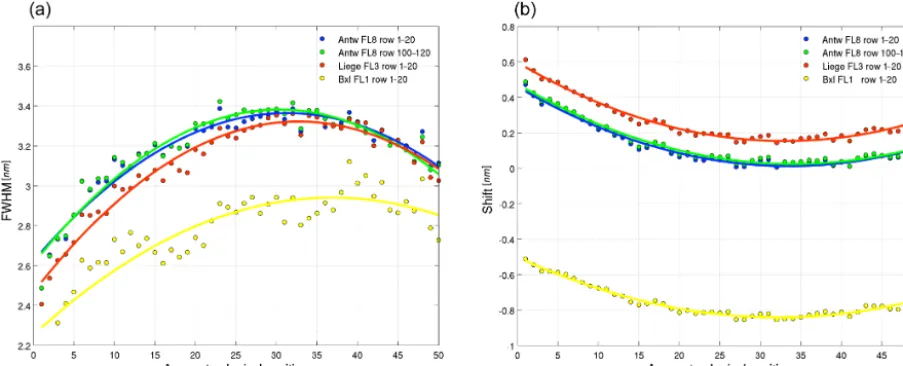
Figure 6.In-flight spectral calibration:(a)the spectral resolution (FWHM) and(b)the spectral shift and its dependency on the across-track scan line pixel position (spectral smile) plotted for 490 nm, i.e. the middle of the analysis window, for different flight lines. A second-order polynomial has been fitted to each calibration set.
by minimising the chi-square of the differences between the observed spectrum and the solar reference in each window. Then, we fit polynomials through the five resulting shift and FWHM values. As the pushbroom sensor consists of 1000 pixels across-track, which are binned by 20, the output con-sists of 50 different calibration sets in total.
During operation, airborne instruments are typically ex-posed to changes in environmental conditions (changes in pressure, humidity and temperature, vibrations, mechanical stress, etc.) which can affect the instrument characteristics and degrade its spectral performance. Even though the op-tical unit of APEX is temperature stabilised, sealed in a ni-trogen atmosphere and kept at 200 hPa above ambient pres-sure, deviations can occur between the nominal and effec-tive in-flight spectral performances. This has been exten-sively investigated by D’Odorico et al. (2011) and Kuhlmann et al. (2016) and confirmed by our study. Nominal param-eters of the spectral performance, determined by the labo-ratory calibration, are given in Table 3. Based on labora-tory measurements, the CW spectral shift should be smaller than 0.2 nm according to Schaepman et al. (2015). However, based on a recent reanalysis, a larger uncertainty between 0.4 and 1 nm was observed in real spectra (Kuhlmann et al., 2016). Because a prism dispersion element is used, the FWHM is a non-linear function, which broadens with wave-length. The slit function is assumed to have a Gaussian shape with a nominal FWHM of approximately 1.5 nm at 490 nm, i.e. at the centre of the fitting window, for the nadir detector element.
The spectral calibration on the in-flight spectra points out bigger CW shifts than specified by the nominal calibration as well as a broadening of the ISRF (see Table 3). In Fig. 6a and 6b, the FWHM and the spectral shift and their
depen-dencies on the across-track scan line pixel position (spectral smile) are plotted for 490 nm for different across-track scan lines and flight lines: the mean of 20 scan lines (1) at the start and (2) at the end of flight line eight of the Antwerp data set (day 105), (3) at the start of flight line three of the Liège data set (day 105) and (4) at the start of flight line one of the Brussels data set (day 181). A second-order polynomial has been fitted to each calibration set. In Fig. 6, minor changes in the slit function are detected between observations ac-quired on the same flight line. A spectral shift of approxi-mately 0.18 nm can be observed between Antwerp flight line eight and Liège flight line three, acquired during a single flight (day 105) but with a time interval of approximately 1 h. Large spectral shifts up to 0.8 nm can be observed be-tween the Antwerp (day 105) and Brussels (day 181) flights. This is largely attributed to changing environmental condi-tions, with pressure changes in particular (D’Odorico et al., 2012). As mentioned before, the pressure of the nitrogen gas in the spectrometer is kept at 200 hPa above ambient pres-sure. Pressure changes, due to changing ambient pressure or inaccuracies of the pressure regulation, can affect the index of refraction of the nitrogen gas and, subsequently, the dis-persion at the prism, resulting in spectral shifts (Kuhlmann et al., 2016). This time-dependent variability of the APEX slit function in operational conditions can be critical for the analysis of the spectra, as discussed in Sect. 4.2.
sub-tle spectral variations. According to Kuhlmann et al. (2016), there is no significant sensitivity of the FWHM to pressure changes (in contrast to the spectral shifts). Based on an in-tensive analysis, the study of Kuhlmann et al. (2016) con-cludes that the larger in-flight FWHMs are likely explained by a combination of (1) not fully corrected CCD readout smear, resulting in a spectral smoothing and (2) filling-in of the Fraunhofer lines.
Beside the spectral resolution and shift, the spectral sam-pling interval (SSI) and samsam-pling ratio are important char-acteristics of the spectral performance. As specified in Ta-ble 3, the SSI is approximately 0.9 nm. According to Chance et al. (2005), the Nyquist rate is just met in the case of a sampling ratio of 3.1 to 3.6 pixels per FWHM, assuming a Gaussian ISRF. However, being at the limits, APEX slightly undersamples the spectra, which can complicate the DOAS analysis due to reduced spectral information.
4 NO2vertical column density retrieval algorithm
The flow chart in Fig. 7 illustrates the key steps of the applied NO2VCD retrieval algorithm. For each of the modules, the
main input and output data sets and their respective file for-mats are specified. A NO2vertical column can be derived for
each APEX pixel or measured spectrumi, according to VCDi=
SCDi
AMFi
. (1)
In Eq. (1), the NO2 VCDi or the integrated amount of
molecules per cm2expected for a single, vertical transect of the atmosphere is defined as the ratio of the measured slant column density or the number of molecules per cm2detected in an observation (SCDi)and a corresponding air mass
fac-tor (AMFi; Solomon et al., 1987). The direct output of the
DOAS analysis (see Sect. 4.1) is not SCDi, but a differential
slant column density (DSCDi),being the difference of the
concentration of NO2integrated along the effective light path
and the NO2concentration in a reference spectrum (SCDref).
The residual NO2amount in the background spectrum needs
to be determined in order to convert DSCDi to SCDi (see
Sect. 4.2). Therefore Eq. (1) needs to be rewritten as follows: VCDi=
DSCDi+SCDref
AMFi
, (2)
or VCDi=
DSCDi+(VCDref×AMFref)
AMFi
. (3)
AMFs account for enhancements in the optical path length of the slant column due to viewing and sun geometry, albedo, aerosol scattering and the NO2vertical profile (see Sect. 4.3). 4.1 DOAS analysis of the measured spectra
The obtained binned APEX spectra are analysed in the 470–510 nm visible wavelength region by application of
QDOAS spectral fitting (Danckaert et al., 2015)
AMF AMF VCD DSCD
VCD ( ref* ref)
Destriping, smoothing, georeferencing
DSCD + DSCD error + AMF + VCD (NetCDF, .xyz, .shp, GTiff) DSCD + DSCD error + AMF + VCD (NetCDF)
VLIDORT 2.6 RTM for box-AMF (Spurr, 2008)
QGIS for NO2 spatial distribution mapping Cube preprocessing
+ spatial binning
Binned spectra + reference spectra (NetCDF)
DSCD + DSCD error (NetCDF) APEX spectra + geometry + albedo data cubes
BAMF + TotAMF + AMFref (ASCII) Albedo + SZA + VZA + RAA (ASCII)
Lat/long geo-location (NetCDF) Calibration file (ASCII)
Atmospheric profile (ASCII)
AURORA a priori NO2 profiles
(NetCDF )
Figure 7.Flow chart of the APEX NO2VCD retrieval algorithm.
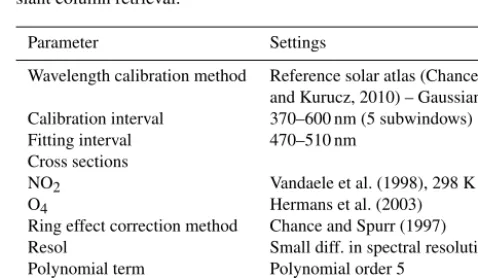
Table 4.Main DOAS spectral fitting analysis parameters for NO2
slant column retrieval.
Parameter Settings
Wavelength calibration method Reference solar atlas (Chance
and Kurucz, 2010) – Gaussian
Calibration interval 370–600 nm (5 subwindows)
Fitting interval 470–510 nm
Cross sections
NO2 Vandaele et al. (1998), 298 K
O4 Hermans et al. (2003)
Ring effect correction method Chance and Spurr (1997)
Resol Small diff. in spectral resolution
Polynomial term Polynomial order 5
Intensity offset correction Polynomial order 1
an adapted version of the QDOAS non-linear least-squares spectral fitting tool, developed at BIRA-IASB (Danckaert et al., 2015). The adapted version allows the spectra of full APEX flight lines to be processed simultaneously, with both the input and output in a network common data form (netCDF) file format. Note that the small 470–510 nm fit-ting window is not considered to provide the highest sen-sitivity to NO2. Instruments specifically designed for NO2
trace gas retrieval usually operate in the 425–490 nm inter-val. This broad window contains more spectral information and strongly structured NO2absorption features, while there
gases, providing optimal sensitivity to NO2. However,
inter-ference with unidentified instrumental artefacts or features prevents us from extending the fitting window to wavelengths lower than 470 nm. Currently, the chosen wavelength interval is considered to be the best trade-off between sensitivity on the one hand and minimum interference with other absorbers and instrumental structures on the other hand.
The basic idea of the DOAS approach is to separate broad-band and narrowbroad-band signals in the spectra and to isolate the narrow molecular absorption structures (widths usually smaller than a few nm). Beside relevant high-pass filtered trace gas laboratory cross sections (NO2and O4), a low-order
polynomial term, a synthetic Ring spectrum and a synthetic-resolution cross section are fitted to the logarithm of the ratio of the observed spectrum and a reference spectrum. They ac-count for respectively (1) smooth broadband variations (e.g. reflection at the Earth’s surface) and Rayleigh and Mie scat-tering; (2) the Ring effect (Grainger and Ring, 1962), i.e. the filling-in of Fraunhofer lines by rotational Raman scattering on air molecules and (3) the impact of small changes in the instrumental resolution. The synthetic-resolution cross sec-tion is based on a linearisasec-tion of the dependence of spectral Frauhofer lines on the slit function width and corresponds to the first derivative of solar reference with respect to the slit function width (Danckaert et al., 2015; Beirle et al., 2017). O3and H2O cross sections were not fitted due to cross
corre-lations and overparameterisation of the small fitting interval. Further details about the main DOAS settings can be found in Table 4.
A typical DOAS fit of an APEX spectrum is illustrated in Fig. 8. The direct output or resulting coefficients of the applied fitting algorithm are NO2differential slant columns.
A NO2 DSCD of 2.61×10¹⁶molec cm−2is retrieved with
an rms on the residuals of 4.03×10⁻⁴. In the absence of systematic structures, the rms is the standard deviation of a Poisson distribution, corresponding to the measured photons. The rms corresponds to a favourable SNR of 2500 and is in line with the obtained signal enhancement after spatial bin-ning, as discussed in Sect. 3.1.
4.2 Background spectrum
In the DOAS analysis, the concentration of NO2 is
deter-mined with respect to an unknown amount of NO2 in a
selected reference spectrum (SCDref). This differential
ap-proach largely reduces the impact of both systematic instru-mental instabilities and the prominent Fraunhofer lines in the spectra, which blur out the much finer trace gas absorption structures. The approach also cancels out the stratospheric NO2 contribution to the signal, making the measurements
only sensitive to tropospheric absorption, under the assump-tion that the stratospheric NO2 field has a negligible
spa-tial and temporal variability in the time between the acqui-sition of the reference spectrum and the measurements. Dur-ing the daytime, the stratospheric NO2 column is
charac-Figure 8.Typical DOAS fit with(a)red line, corresponding to the NO2 molecular cross section, convolved with the instrument slit
function and scaled to the detected absorption in the measured spec-trum (blue line) and(b)the remaining residuals of the spectral fit.
terised by a near-linear slow increase due to the photolysis of N2O5at the midlatitudes. The diurnal increase of the NO2
stratospheric column between 80◦ SZA sunrise and sunset is estimated to be approximately 1×10¹⁴molec cm−2 per hour (Tack et al., 2015) and thus much smaller than the re-trieved VCDs. The latter have mean values of 1.7×10¹⁶and 7.7×10¹⁵molec cm−2 for the Antwerp and Brussels data sets. All flights took place close to local noon, and in gen-eral there was a minor time interval between the acquisition of the spectra and the reference of less than 1 h.
The residual NO2amount in the reference (SCDref)is an
unknown that needs to be estimated, which is a general short-coming of all airborne DOAS pushbroom imagers. Some studies assume that there is no (Schönhardt et al., 2015) or very little (e.g. 1×10¹⁵molec cm−2; Popp et al., 2012), tro-pospheric NO2in a background area. Due to a combination
– The in-flight slit function is affected by environmen-tal conditions during operation of APEX, despite the fact that the instrument is sealed, pressure regulated and temperature regulated. Figure 6 shows that changes in the slit function occur between different flight lines of a single flight. Large spectral shifts can be observed between different flights/campaigns. The unstable slit function can cause misregistrations and spurious resid-uals in the DOAS fit. Even when the latter are small, they can impact the retrievals, considering that very fine absorption structures are analysed. As a consequence, a reference cannot be used to analyse a certain spectrum if the spectral performance deviates too much. Quality parameters of the fit, such as the rms, were carefully checked in order to detect significant changes in the ef-fective slit function between the analysed spectra and reference. in the case of the Brussels data set (day 181), reference data were selected per individual flight line due to the larger instability affecting the slit function. – The nature of the reference area further complicates the
estimation of SCDref. Based on a priori information, a
number of candidate background areas around the cities were covered during the taxi flight between airport and survey area, far from emission sources and with de-creased levels of NO2. Due to the unstable slit
func-tion and its time dependency, unfortunately these ref-erence flight lines could not be used in the analysis in most cases. Instead, the references needed to be selected closer to the city, where the NO2 levels are relatively
high and generally have a strong spatial variability. For both the Antwerp (day 105) and Brussels (day 181) data sets, the references were selected in the south part of the flight lines, upwind of the main sources in the city. The SCDrefwas estimated based on co-located
mobile-DOAS measurements. Following Eq. (2), the retrieved VCD will be overestimated in case the effective SCDref
is lower than the estimated amount. 4.3 Air mass factor calculations
A slant column depends on multiple light paths of backscat-tered solar radiation, contributing to the spectrum observed by the instrument. In order to derive the effective optical path length through the atmosphere and thus to be able to interpret and compare observations, the transfer of radia-tion in the atmosphere needs to be modelled and appropri-ate enhancement factors need to be calculappropri-ated. In this study, NO2box-AMFs (BAMFi)have been calculated with the
lin-earised radiative transfer model (RTM) LIDORT 2.6 (Spurr, 2008). The box-AMFs describe the sensitivity of the mea-surements as a function of altitude, resulting in a height-dependent assessment of the instruments sensitivity (Wag-ner et al., 2007). The radiative transfer equation is solved in a multilayer, multiple scattering atmosphere using the
dis-crete ordinate method. RTM simulations are performed at 490 nm, i.e. the middle of the NO2fitting window. 93
atmo-spheric height layersj are defined from the ground surface to the top of the atmosphere (TOA), the latter determined at 120 km altitude, and for each layer a box-AMF is retrieved. The vertical discretisation consists of 40 layers of 50 m thick-ness, until 2 km and 12 layers of 500 m between 2 and 8 km. Above 8 km, the altitude grid of the US Standard Atmosphere is adopted. A total AMF (TAMFi)can be derived for each
APEX spectrumiby integration of the BAMFj along an a
priori NO2vertical profile:
TAMFi= TOA
P
j=0
BAMFj×VCDj TOA
P
j=0
VCDj
. (4)
In Eq. (4), BAMFj and VCDjrefer to the box-AMF and the
a priori partial NO2 VCD of atmospheric layerj. A mean
TAMF of 1.9 is obtained for the Antwerp and Brussels data set.
4.3.1 RTM parameters
LIDORT numerically reproduces the state of the atmosphere and transfer of the solar radiation through the atmosphere based on a priori information on all parameters that affect the light path, e.g. the surface albedo, sun and observation geometry and atmospheric properties (pressure, temperature, cloud cover, absorber and aerosol vertical profiles). (1) The surface albedo, as well as (2) the sun and viewing geome-try, i.e. SZA, viewing zenith angle (VZA) and relative az-imuth angle (RAA), can be extracted from the observations. These additional (meta)data sets are provided for each ob-served spectrum and are spatially binned accordingly. The surface albedo is approximated by the APEX reflectance value (Level 2 product), which is obtained for each pixel af-ter application of an atmospheric correction algorithm with MODTRAN4 (Berk et al., 1999) on the radiometrically cali-brated level 1 at-sensor radiance product (Biesemans et al., 2007; Sterckx et al., 2016). The viewing and sun geome-try are output products of the APEX orthorectification mod-ule, as described in Sect. 4.4. (3) Pressure and tempera-ture profiles are taken from the AFGL standard atmosphere for midlatitude summer (Anderson et al., 1986). (4) Clouds usually introduce a major uncertainty in atmospheric mod-elling. However, all flights took place under clear-sky con-ditions, avoiding the necessity of a cloud retrieval scheme. (5) A priori NO2 vertical profile shapes are obtained from
out-Table 5.Sensitivity study with varying input parameters in the radiative transfer model based on 73 000 and 96 000 observations for the Antwerp and Brussels data sets, respectively. For the albedo, sun and viewing geometry, each time two scenarios are provided based on the µ±1σ level and corresponding TAMFs are derived by BAMF integration along a mean AURORA NO2profile.
RTM Parameter Parameter TAMF TAMF TAMF parameter µ−1σ µ+1σ µ−1σ µ+1σ variability
Antwerp
Albedo 2 % 8 % 1.3 2.2 65 % RAA 37.1◦ 151.1◦ 1.9 1.9 4 % VZA 4.4◦ 11.5◦ 1.9 1.9 1 % SZA 51.2◦ 58◦ 1.9 2.0 6 %
Brussels
Albedo 2 % 8 % 1.3 2.2 66 % RAA 48◦ 152.6◦ 1.9 1.8 3 % VZA 5.1◦ 11.7◦ 1.8 1.8 1 % SZA 31.9◦ 37.4◦ 1.6 1.7 3 %
put for the time of flight and overpass location was computed. Interpolation on the coupled 3-D model grid provides a local NO2vertical profile for each APEX pixel. The obtained NO2
profile shapes are assessed in the next section. (6) Aerosols can both enhance or reduce the AMF, depending on their ver-tical distribution. Since the latter information was not avail-able and since all flights took place on clear spring/summer days with good visibility, a pure Rayleigh atmosphere was considered to compute the VCDs. The uncertainty related to this assumption is, however, discussed and quantified in the next section.
4.3.2 RTM sensitivity study
To study the impact of the input parameters on the AMF com-putations, sensitivity tests were carried out, based on differ-ent scenarios with varying input in the radiative transfer mod-elling. First, the mean and 1σstandard deviation were calcu-lated for the albedo, RAA, VZA and SZA based on 73 000 pixels/observations of the Antwerp data set. In Table 5, each row corresponds to an RTM parameter for which two scenar-ios are provided: mean±1σ level (68 %). For the study of a certain parameter, the other RTM parameters are assigned a fixed valueµ, which is 5 %, 94.1, 7 and 54.6◦for the albedo, RAA, VZA and SZA respectively. For each scenario, corre-sponding TAMFs are computed.
For the sun and viewing geometries, the TAMF variability is low, i.e. less than 6 % for input within µ±1σ. From the studied input parameters, the surface albedo clearly has the most significant impact on the AMF computations, which is consistent with previous investigations such as Boersma et al. (2004) and Lawrence et al. (2015). The TAMF variability can be up to 65 % for albedo input withinµ±1σ, illustrating the importance of having accurate knowledge of the surface properties in the case of airborne imaging applications. Sim-ilar results were obtained for the Brussels data set and are
Figure 9. (a)APEX true colour composite,(b)APEX albedo level 2 product and(c) computed TAMFs, for flight line eight of the Antwerp data set (15 April 2015). The strong dependency of the AMF on the albedo can be observed.
provided in Table 5. The strong dependency of the TAMF computations to the albedo is illustrated in Fig. 9.
In order to obtain a better understanding of the instrument vertical sensitivity and the impact of the albedo on the radia-tive transfer, BAMFs are plotted as a function of the altitude in Fig. 10 for five different surface albedo scenarios. The sen-sitivity of the instrument is strongly height dependent. The sensor is mostly sensitive to NO2observed directly below the
Table 6.A priori NO2profile shape sensitivity study with four sce-narios: integration along (1) local NO2vertical profilesAinterp,
in-terpolated on the AURORA model grid; (2) a fixed AURORA NO2
profileAharborover a polluted area; (3) a well-mixed NO2box
pro-file of 0.5 km and (4) 1 km height in the lowest layer. TAMFs for the Antwerp data set are calculated based on the four scenarios, as well as the variability between the first scenario and the other three.
NO2profile TAMF TAMF variability
Ainterp 1.9 –
Aharbor 1.8 8 %
Box0.5 km 1.8 7 %
Box1 km 1.9 1 %
Figure 10.BAMF profiles illustrating the vertical sensitivity of the APEX instrument to NO2. The high impact of the surface albedo,
mainly on the lowest atmospheric layers, is shown based on five different scenarios, ranging from low to high albedo. Scenarios are based on the minimum,µ−1σ, mean,µ+1σand maximum albedo in the Antwerp data set.
In the case of high albedo, much of the incident radiance is reflected towards the sensor, increasing its sensitivity to NO2
and thus significantly impacting the air mass factor. The sen-sitivity is about 2.9 directly under the plane and decreases to 0.3 and then to 2.1 at the ground surface for albedos of 0.3 to 8 %. The sensitivity to the atmospheric layers above the sensor is almost constant and relatively low, around 1.7. This is very close to the geometrical AMF (1/cos(SZA)).
While the NO2 horizontal distribution can be mapped,
based on airborne APEX hyperspectral data, the details of the vertical distribution of NO2 in the atmosphere are not
well known. As discussed in Sect. 4.3.1, in this work, a time and space dependent NO2profile is interpolated on the
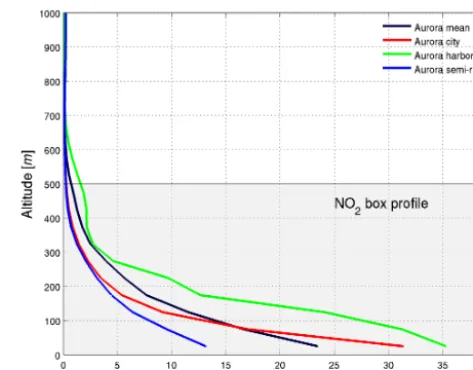
high-resolution AURORA 3-D model grid for each APEX pixel. Then, TAMFs are computed based on integration along the obtained a priori NO2profile. In Fig. 11, the mean AURORA
Figure 11.Representative AURORA a priori NO2profiles used for
the Antwerp data set RTM calculations. A simple NO2box profile
of 500 m height which is well-mixed in the boundary layer is also used in the sensitivity study.
profile is plotted for the Antwerp study area. Three extreme cases of local AURORA profiles are also plotted, i.e. for an urban, industrial and semi-rural site. Over the harbour, with many industrial activities, large NO2concentrations can be
observed for the surface layer. Furthermore, the higher atmo-spheric layers contain relatively more NO2, probably due to
emitting stacks which can be as high as 70 m. Over the city centre, the bulk of the NO2can be related to traffic emissions
at the surface.
The impact of the NO2profile shape on the TAMF
com-putation is reported in Table 6 by comparison of two scenar-ios: integration of the BAMFs along (1) local NO2
verti-cal profilesAinterp, interpolated on the AURORA model grid
and (2) a fixed AURORA NO2profileAharbor, with very high
NO2concentrations for the surface layers, and which can be
assumed to be an extreme case. A scatter plot and linear re-gression analysis for the TAMFs, obtained by both scenar-ios, are shown in Fig. 12. The higher surface concentrations of the Aharbor profile give a larger weight to the relatively
low BAMFs at the surface (see Fig. 10), resulting in a mean TAMF decrease of 7.5 % when compared to the first scenario. This impact reduces to zero at higher TAMF values, which can be related to higher albedo values, which have a much smaller decrease in sensitivity to the surface. In a second sen-sitivity test, the TAMFs obtained by integration along local AURORA NO2 vertical profiles Ainterp are compared with
TAMFs that are computed based on a simple NO2box
pro-file of 0.5 and 1 km height and well-mixed in the boundary layer. In the case of a NO2box profile of 0.5 km, TAMFs are
on average 7 % smaller when compared to local AURORA NO2 profiles, while TAMFs are slightly higher (∼1 %) in
Figure 12.Scatter plot and linear regression analysis for the TAMF computation, based on two scenarios: integration of the BAMFs along (1) local NO2vertical profilesAinterp, interpolated on the
AU-RORA model grid and (2) a fixed AUAU-RORA NO2profileAharbor,
with high NO2concentrations related to industrial sources.
Previous studies (Leitao et al., 2010; Meier et al., 2016) indicate that aerosols can enhance or reduce the AMF, de-pending on their position with respect to the NO2layer, the
optical thickness and the absorption of the aerosol layer. An aerosol optical thickness (AOT) lower than 0.15, at 500 nm, was measured during all flights by a CIMEL sun photome-ter at the AERONET station (Holben et al., 1998) in Uccle (50.78◦N, 4.35◦E, 100 m a.s.l.). Radiative transfer simula-tions with a corresponding well-mixed extinction at the sur-face yield an albedo-dependent aerosol effect of 7 % or less when compared to the AMFs computed based on a Rayleigh atmosphere. However, a relative uncertainty of 10 % is con-sidered for all flights to take into account the AOT variability and because the AERONET station in Uccle was in a semi-polluted area.
4.4 Postprocessing: destriping
After application of the retrieval equation, i.e. Eq. (3), a bias correction is applied to the retrieved NO2VCDs to cope with
the across-track stripe-like pattern in the generated maps. Striping is inherent to pushbroom sensors due to the intrinsic spectral response of each detector which is slightly different from the others (see Sect. 3.2). The applied bias correction is based on the algorithms presented in Boersma et al. (2011), Popp et al. (2012) and Lawrence et al. (2015). For each flight line, the column NO2values are averaged and a third-order
polynomial is fitted to the column averages. The deviation
from the polynomial is treated as a detector-dependent bias and used as a correction factor to be subtracted from the retrieved NO2 columns. The procedure removes the
across-track striping to a great extent, while retaining the NO2
spa-tial patterns. For visualisation purposes, the retrieved NO2
VCD map is convolved by a low-pass filter in the across-track direction, reducing the high frequencies or short-scale variability. The applied Savitzky–Golay filter is based on a least-squares fitting of a second-order polynomial over a span of five pixels (Savitzky and Golay, 1964; Schafer, 2011). 4.5 Spectra geolocation and georeferencing
The APEX sensor is equipped with a high-grade Applanix POS/AV 410 navigation system, which records sensor po-sition (i.e. latitude, longitude and elevation) and orientation (i.e. pitch, roll and heading). Concurrently, Global Position-ing System (GPS) base station data, for differential cor-rection, and data originating from an inertial measurement unit (IMU) are recorded. All telemetry are blended in real-time and logged for postprocessing to allow proper georef-erencing of the spectra (Mostafa and Hutton, 2001). On 14 April, a boresight calibration flight (Mostafa, 2001) was also launched over Oostend, Belgium for accurate georeferenc-ing purposes. The boresight angles account for misalign-ments between the IMU axis and the sensor axis and they are computed every time APEX is mounted in the aircraft. Ground control points (GCPs) selected from orthophotos are identified in the APEX data and, following a Monte Carlo procedure, optimal parameters to compensate for roll, pitch and yaw errors are inferred, greatly reducing geolocation er-rors which are usually lower than 1 unbinned spatial pixel (Vreys et al., 2016b). The orthorectification and georeferenc-ing module receives the sensor interior and exterior orienta-tion, boresight calibration data and digital elevation model (DEM) data as input. The module outputs the position and the complete viewing geometry for each pixel or measured spectrum, allowing a proper mapping of the retrieved NO2
spatial distribution. In Vreys et al. (2016b), the georeferenc-ing module and its qualitative and quantitative assessment is discussed more deeply.
The georeferenced VCDs and intermediate products, e.g. DSCDs and AMFs, are eventually gridded and overlayed onto Google Maps layers in an open-source geographic in-formation system (GIS) environment, QGIS 2.10.1 (QGIS development team, 2009).
4.6 NO2VCD error budget
The overall error on the retrieved NO2VCDs originates from
uncertainties in the calculated DSCDs, SCDref and AMFs.
One assumes that the contributing uncertainties are suffi-ciently uncorrelated as they arise from nearly independent steps. Based on Eq. (2), the overall error of the NO2 VCD
error propagation method:
σVCD2
i =
σ
DSCDi
AMFi
2
+
σ
SCDref
AMFi
2
+
SCD
i
AMFi2
×σAMFi
2
. (5)
i. The error on the DOAS fit (1σ standard deviation), σDSCDiis a direct output of QDOAS for each fit and has
a typical value between 3.4 and 4.4×10¹⁵molec cm−2 on the APEX DSCD retrievals, when spectra are binned 20 by 20 pixels. Note that this is approximately 1 or-der of magnitude higher than for the fixed ground-based stations, e.g. the BIRA-IASB MAX-DOAS instrument (Tack et al., 2015), having a higher SNR and better spec-tral performance. WhereasσDSCDi is a rather minor
er-ror source in the case of ground-based stations, it be-comes a significant contributor to the total error in the case of an airborne imager.
ii. The second error source originates from the estima-tion of the NO2residual amount in the reference
spec-tra,σSCDref. As SCDref is determined from co-located
mobile-DOAS measurements, the overall error on the mobile-DOAS retrievals is taken into account. The mobile-DOAS error estimation is discussed in Mer-laud (2013) and Constantin et al. (2013). The mean overall error for the Antwerp and Brussels data set is 1.8×10¹⁵molec cm−2.
iii. The error in the calculation of the air mass factor σAMFi is caused by the uncertainties in the assumptions
made for the radiative transfer model parameters (See Sect. 4.3.1). The contributing uncertainties can be summed in quadrature to obtain an overall error estimate σAMFi. According to Boersma et al. (2004),
the error budget associated with the computation of the AMF is dominated by the cloud fraction, surface albedo and NO2 profile shape: (1) as flights took
place under clear-sky conditions, cloud fraction is not considered an error source in this case. (2) Sen-sitivity tests, performed in Sect. 4.3.2, indicate that the surface albedo has the most significant impact on the effective light path, thus on the AMF. Within the albedo 1σ interval, the AMF variability can be up to 65 %. However, as absolute radiances can be directly derived from the APEX instrument, the albedo can be determined with relatively high accuracy. For a realistic estimate of the uncertainty, the following study was performed: several albedo types were measured in the field with an ASD FieldSpec-4 spec-trometer (http://www.asdi.com/products-and-services/ fieldspec-spectroradiometers/fieldspec-4-hi-res) and compared to the APEX surface albedo. For the wave-length 490 nm, the average albedo error over all
Figure 13.Overall absolute (black dots) and relative errors (blue dots),σVCD, on the retrieved NO2VCDs, based on the Antwerp
data set.
targets is 10 %, which is assumed to be a realistic estimate of the uncertainty related to the a priori surface albedo. (3) Based on the sensitivity study performed in Sect. 4.3.2, the uncertainty related to the a priori NO2 profile shape is lower than 8 %. (4) According
to the performed simulations, the uncertainty related to the assumption of a pure Rayleigh atmosphere is estimated to be less than 10 %. (5) Both the viewing and sun geometry can be determined with high accuracy, thus the impact on the error in the AMF computation is expected to be small. Moreover, the performed sensitivity study, summarised in Table 5, has revealed that varying input for the viewing/sun geometry has a very low impact on the TAMF variability. Therefore it is assumed that the uncertainties related to RAA, VZA and SZA are less than 1 %. Finally, all error sources contributing to the overall errorσAMFi are summed in
quadrature and an estimate of approximately 15 % is obtained.
The error budget analysis, based on 73 000 observations of the Antwerp data set, is reported in Table 7 and Fig. 13. In Table 7, typical relative and absolute errors are given for dif-ferent classes, depending on the NO2VCD amount. For each
class, the typical errorσ is provided for each individual er-ror source in the retrieval approach, as well as for the overall error on the retrieved VCDs,σVCD.
An overall relative error, σVCD, of 21 % on the
re-trieved NO2 VCDs is reported in Table 7 for the
Table 7. Error budget analysis based on 73 000 retrieved NO2 VCDs of the Antwerp data set. Typical relative errors (percent) and absolute errors (×1015molec cm−2 for σDSCD, σSCDref and σVCD) are provided in column two to four, for small (< 33th
per-centile or < 1.4×10¹⁶molec cm−2), medium (33th to 66th percentile or 1.4 to 2.0×10¹⁶molec cm−2)and high (> 66th percentile or > 2.0×10¹⁶molec cm−2)NO2VCD retrievals, respectively. Column five shows the mean error for all retrieved VCDs.
Error source Small VCDs Medium VCDs High VCDs All VCDs
σDSCD 40 % (3.8) 23 % (3.9) 15 % (3.9) 22 % (3.9)
σSCDref 19 % (1.8) 11 % (1.8) 7 % (1.8) 10 % (1.8)
σTAMF 15 % (0.3) 15 % (0.3) 15 % (0.3) 15 % (0.3)
σVCD 29 % (2.8) 21 % (3.5) 18 % (4.7) 21 % (3.7)
Figure 14.NO2VCD diurnal variation retrieved from the Uccle
MAX-DOAS station on 15 April and 30 June 2015. The blue and red columns indicate the flight times on April 15 over Antwerp and on June 30 over Brussels.
small VCD retrievals (∼29 % for the Antwerp data set). For medium and high VCDs, the overall relative errors decrease to 21 and 18 %. For the latter, the main contributions are from the error on the DOAS fit and the TAMF computation, σTAMF. Relative errors related to the DOAS fit and to the
es-timation of the residual amount,σSCDref, drop in the case of
larger VCDs, while errors originating from the TAMF com-putation are not affected. Of course the overall relative er-ror is dependent on the NO2levels in the covered area. Low
VCD retrievals will produce larger relative errors. The rela-tively low mean NO2VCD and related higher error for the
Brussels data set is due to a combination of the seasonality of NO2,the lack of significant industrial sources in the area
and the fact that a fair amount of semi-rural area around the city was covered (see Sect. 5).
The overall absolute and relative errors are plotted as a function of the retrieved NO2 VCDs in Fig. 13, for the
Antwerp data set. The largest absolute errors are obviously associated with the highest retrievals. The relative errors, on the other hand, which can be up to 100 % in the case
of very low tropospheric contributions, show a steep and rapid drop in the case of increasing VCDs. The relative er-ror is almost constant (∼21 %) for NO2 VCDs larger than
1.5×10¹⁶molec cm−2.
5 Discussion of the retrieval results
The generated NO2 VCD distribution maps are shown in
Figs. 15, 17 and 19 for the Antwerp (day 105), Brussels (day 181) and Liège (day 105) data sets. Meteorological condi-tions and the general flight pattern, both important for inter-preting the observed NO2field, are discussed in Sect. 2.2. In
general, the obtained spectral and spatial resolutions allow us to map the fine-scale NO2horizontal variability and spatial
gradients and to resolve individual emission sources. Patterns of enhanced NO2can be observed that are largely consistent
and transported downwind from the emission sources. The distribution maps show that the NO2concentrations can be
highly variable in urban areas and can exhibit strong gradi-ents. The maps are built from several adjacent flight lines with an approximated acquisition time of 8 to 15 min per flight line. As a dynamic NO2 field is measured, minor
bi-ases can occur between adjacent flight lines.
The NO2 VCD diurnal variation retrieved at the Uccle
MAX-DOAS station on the campaign days, i.e. 15 April and 30 June 2015, are plotted in Fig. 14. The blue and red columns indicate the flight times on April 15 over Antwerp (08:06–09:30 UTC) and on June 30 over Brussels (12:43– 14:04 UTC). Further details of the station are provided in Sect. 6.2 and its location is indicated by a green dot in Fig. 17. Unfortunately there is no MAX-DOAS station so far in the Antwerp area. On both flight days, the Uccle station was upwind of the Brussels city centre, thus in a semi-polluted area. During the 15 April flight, the NO2
VCDs range between 4 and 21×1015molec cm−2, between 80◦ SZA sunrise and sunset, and VCDs increase approxi-mately by 2.5×10¹⁵molec cm−2during flight time. On June 30, NO2VCDs range between 4 and 7×10¹⁵molec cm−2.
There is a slight decrease of 1.5×10¹⁵molec cm−2 during the APEX flight.
Figure 15.Retrieved NO2VCD field for Antwerp (15 April 2015)
(Google, TerraMetrics). Red dots indicate the chimney stacks, emit-ting more than 25 kg of NOx per hour, according to the emission
inventory of the Belgian Interregional Environment Agency. Four industrial sites, which are further discussed in Sect. 5, are indicated by the labels A–D. The red dotted line indicates the plume cross section, plotted in Fig. 5. The blue vertical line indicates an along-track profile, for which the NO2DSCD and VCD time series are
plotted in Fig. 16.
Figure 16. NO2 DSCD and VCD time series for an along-track
profile from north to south taken on flight line eight of the Antwerp data set (15 April 2015). The retrieved NO2VCDs are well above
the detection limit of approximately 1.8 to 2.3×10¹⁵molec cm−2. The profile, crossing the main plume from the harbour and the city centre, is indicated by a dashed (blue) vertical line in Fig. 15.
also to traffic in the south-east part. The port of Antwerp contains the biggest (petro)chemical cluster in Europe with branches of BASF, ExxonMobil, Solvay, Total, etc. The red dots in the NO2VCD distribution map (Fig. 15) represent
the most significant stacks, emitting more than 25 kg of NOx
per hour, according to the emission inventory of the Bel-gian Interregional Environment Agency. The NO2 field
ex-hibits a strong gradient from west to east, consistent with the south-westerly wind direction. In the west, the NO2 levels
are low, around 3 to 7×10¹⁵molec cm−2due to the lack of major contributing sources. Substantial uncertainties can oc-cur in this area as the levels are close to the detection limit. Downwind of the sources, the transported NO2is building up
and patterns of enhanced NO2can be observed with maxima
up to 3.5×10¹⁶molec cm−2. The NO2 VCDs are on
aver-age 1.7±0.4×10¹⁶molec cm−2. The detected plumes are clearly related to and transported from the most contribut-ing stacks in the area. The main central plume with a large extension is a double plume with its main emissions from two chimney stacks at site A, emitting 30 and 95 kg of NOx
per hour at an altitude of 70 m a.g.l. A third stack north-east of it at site B emits 145 kg of NOx per hour at an altitude
of 35 m a.g.l. The plume is approximately 12 km long and is unfortunately not fully covered by the flight plan. There is ac-tually a cluster of 30 to 40 stacks at sites A and B which also contribute to the central plume. However, according to the emission inventory, their emissions are mostly less than 10 kg of NOxper hour. Smaller but clearly confined plumes origin
from sites C and D, which are more isolated. Ship emissions are also expected to contribute to the observed NO2 field;
however these are hard to differentiate in this particular data set.
In the south-eastern part of the NO2 map (Fig. 15), NO2
patterns can be observed which are related to traffic emis-sions from the city of Antwerp, the R1 ring road and the key highways E313 and E19. The two last flight lines are acquired around 11:00–11:30 LT and presumably the air masses containing the emissions from the rush hour are de-tected here, having been transported from the city and ring road R1 and building up due to low wind speeds north-east of the city. In the western part of the data set, an artefact is still present over the H-shaped docks due to too-low retrieved VCDs over the water body and overestimation of the VCDs over the surrounding quays. Such an artefact is not present over other water bodies in the data set. The artefact could not be removed properly by selecting a larger amount of NO2in
Figure 17.Retrieved NO2VCD field for Brussels (30 June 2015)
(Google, TerraMetrics). Blue squares indicate four NO2 VCD hotspots, highlighted in Fig. 18. The green dot is the location of the Uccle MAX-DOAS station.
subsequently the AMF, over the water body and an underes-timation of the albedo and AMF over the quay could explain this artefact.
On flight line eight of the Antwerp data set, an along-track profile is taken (see Fig. 15) from which the NO2DSCD and
VCD time series are plotted from north to south in Fig. 16. Negative DSCDs point to a high amount of NO2in the
refer-ence/background, when compared to the analysed spectrum. The blue-shaded error region on the DSCDs corresponds to the statistical error on the DOAS fit, being also a measure for the detection limit. The 1σslant error of APEX retrievals has a typical value between 3.4 and 4.4×10¹⁵molec cm−2 on the DSCD, corresponding to a detection limit of approx-imately 1.8 and 2.3×10¹⁵molec cm−2on the VCD, assum-ing a typical AMF of 1.9 (See Sect. 4.3). In order for an ab-sorber to be clearly identified, the retrieved column needs to be larger than this threshold.
The NO2 VCD distribution map for the Brussels data
set is shown in Fig. 17. The study area, consisting of the Brussels (sub)urban area and surrounding background, is
Figure 18. Enlargement of four peculiar NO2 VCD hotspots in
the Brussels data set (30 June 2015):(a)major junction between the ring road R0 and the E19, and Brussels international airport;
(b)junction “place Meiser”, close to the city centre;(c)eastern part of the E40 highway;(d)gas turbine Drogenbos power plant. The locations of the four zooms are indicated in Fig. 17 by blue squares (Google, TerraMetrics).
covered by 95833 binned APEX pixels in approximately 80 min. Again a strong gradient can be observed, consis-tent with the south-easterly wind direction, with low NO2
VCDs above the Sonian forest in the south-east and in-creased levels downwind of Brussels city and the ring road R0. The NO2VCDs in the Brussels data set are on average
7.7±2.1×10¹⁵molec cm−2, with minima and maxima of 1 and 20×1015molec cm−2. In general, the NO2levels are
al-most 55 % lower than for the Antwerp data set. This is due to a combination of (1) a lack of significant industrial sources in the Brussels area, (2) the time of flight with respect to the traffic rush hours, and (3) the seasonality of NO2which tends
to show maxima in winter and early spring. The NO2VCD
diurnal variation retrieved at the Uccle MAX-DOAS station (Fig. 14) shows overall larger columns for the flight on 15 April when compared to the flight on 30 June, with mean NO2VCDs of respectively 10 and 5×10¹⁵molec cm−2
be-tween 80◦SZA sunrise and sunset. The seasonal NO 2cycle,
observed at the Uccle station, is discussed in more detail in Blechschmidt et al. (2017).
The NOxsources in Brussels are predominantly related to
Figure 19. Retrieved NO2 VCD field for Liège (15 April 2015)
(Google, TerraMetrics).
can also be observed near the city centre. In Fig. 18, a num-ber of noticeable hotspots of interest in the Brussels data set, indicated by blue, dashed squares in Fig. 17, are highlighted and discussed here:
– Some of the highest emissions can be observed in the north-east where there is a major junction between the ring road R0 and the E19 (Fig. 18a). Besides, there are two other main interchanges and some small industry in Vilvoorde. Strong NOx emissions in this area can also
be related to planes and airport traffic operations at the Brussels international airport. In June 2015, there were in total 22 338 plane movements and on 30 June, ap-proximately 50 planes took off in a north-easterly direc-tion between 15:00 and 18:00 LT. However, due to the proximity of the ring road and interchanges, it is non-trivial to differentiate the contributing sources.
– An increase of the NO2VCDs can be observed at “place
Meiser” with values around 1.2×10¹⁶molec cm−2 (Fig. 18b). It is a busy junction, close to the city cen-tre, where seven major roads merge together.
– Figure 18c zooms in on the eastern part of the E40 way, just past the junction with the ring road. The high-way forms a clear segregation between the NO2levels in
the northern and southern parts. Due to the lack of con-siderable contributing sources, the air masses upwind
Figure 20.APEX and mobile-DOAS NO2 VCD time series for (a)the Antwerp flight (day 105) and(b) the Brussels flight (day 181), respectively. The time offset between APEX and mobile-DOAS observations is plotted in dark grey. The NO2VCDs,
mea-sured by APEX (red dot) and the mini MAX-DOAS (green dot) at the overpass over the Uccle station (13:21 UTC) are indicated on Fig. 20b.
of the highway contain little NO2, while a significant
increase is noticeable downwind of it.
– The gas turbine Drogenbos power plant in the south-west is the only significant industrial source within the covered area, emitting more than 25 kg of NOx
per hour. A confined NO2emission plume, transported
downwind from the double stack close to the chan-nel, can be clearly resolved with a typical VCD around 1.5×10¹⁶molec cm−2(Fig. 18d).
In the Liège data set, the highest NO2emissions are observed
in the north-east, in the industrialised area of Herstal. The NO2levels range between 1 and 32×1015molec cm−2, with
a mean VCD of 13.3±3.1×10¹⁵molec cm−2. The overall
error on the retrieved NO2VCDs is on average 23 %.
6 Correlative data sets
6.1 Mobile-DOAS observations
For Brussels and Antwerp, the APEX NO2 retrievals have
been compared with correlative data sets acquired by a car mobile-DOAS system. The routes strive to have a good spa-tial distribution by covering the city ring road, and transects to the city centre and other main NO2 sources. The