https://doi.org/10.5194/hgss-9-53-2018
© Author(s) 2018. This work is distributed under the Creative Commons Attribution 4.0 License.
The development of the Australian Space
Forecast Centre (ASFC)
Phil Wilkinson1,*, John A. Kennewell2,1,*, and David Cole1,* 1IPS, Bureau of Meteorology, Sydney, Australia
2Australian Space Academy, Perth, Australia
*retired
Correspondence:Phil Wilkinson ([email protected])
Received: 7 February 2018 – Accepted: 9 April 2018 – Published: 4 May 2018
Abstract. The Ionospheric Prediction Service (IPS) was formed in 1947 to provide monthly prediction services for high frequency (HF) radio, in particular to support HF communications with the United Kingdom. It was quickly recognized that to be effective such a service also had to provide advice when ionospheric storms pre-vented HF communications from taking place. With the advent of the International Geophysical Year (IGY), short-term forecasts were also required for research programmes and the task of supplying the Australian input to these was given to Frank Cook, of the IPS, while Jack Turner, also of the IPS, supervised the generation of ionospheric maps to support high latitude HF communications. These two important IGY activities formed the platform on which all future IPS services would be built. This paper reviews the development of the Australian Space Forecast Centre (ASFC), which arose from these early origins.
1 Introduction
During World War II both the prediction of high frequency (HF) conditions and a suitable system for advising when these predictions failed became important operational tools for supporting wartime HF communications. Australia was well placed to contribute in this area (Anduaga, 2009). Post-war, this knowledge became the basis for an ongoing pro-gramme supporting peacetime HF communications.
In Australia, this led to the formation of the Ionospheric Prediction Service (IPS), in late 1947, a government group that provided HF support, ranging from advice on what fre-quencies to use, to what problems were likely to be experi-enced due to geomagnetic storms. This latter service formed the early basis for a short-term forecasting service that even-tually developed into the Australian Space Forecast Cen-tre (ASFC). The early development of the ASFC is closely linked to the development of the IPS as a whole, which had a strong emphasis on supporting customers with HF (iono-spheric) communication problems.
This paper outlines the changes that took place over time as the early forecasting service developed into the current ASFC. The development has been divided into sections. The
cen-tre, which was encouraged to meet the needs of the current users while seeking further customers for its services.
2 The early development of the IPS
During World War II the Radio Research Board (RRB) of the Council for Scientific and Industrial Research (CSIR; in 1949 this became the Commonwealth Scientific and Indus-trial Research Organisation – CSIRO) was tasked with pro-viding HF radio predictions in the Australian region. Similar services were established in Germany, Japan, United King-dom and the United States. These predictions were provided by the Sydney Laboratory of the RRB, in conjunction with the Commonwealth Solar Observatory (CSO) (Frame and Faulkner, 2003) on behalf of the Australian Radio Propaga-tion Committee. While this service continued after the war, it was decided that RRB should return to its main task of radio research and the service role would be split off and trans-ferred to the Commonwealth government. The IPS was es-tablished in late 1947 and transferred to the CSO, since both groups had an interest in solar observations – a tenuous link. The CSO was administered from Mt Stromlo, Canberra, and was part of the Commonwealth government Department of the Interior.
The key staff from this period were Dr Green and Mrs M. (Millie) Harrison, who it is understood had worked on the ionosphere during the war. The first head of the IPS, Dr A. L. F. Green, an Englishman who was previously employed by Amalgamated Wireless (Australasia) (AWA), commenced duty at the IPS on 1 September 1947. In 1949 the staff of the IPS were extracted from CSO and moved to offices in Gar-den Island, Sydney, where they remained in harbour-fronted accommodation for some years. This marked the true begin-ning of the IPS as a separate organization (Jack Turner, oral history, 1979).
Green and Harrison had developed a number of innova-tions in calculating HF predicinnova-tions that provided results that better matched the observations and, probably more impor-tantly, facilitated the production of the predictions by reduc-ing the handlreduc-ing required. Probably Green’s most significant innovation was to introduce the idea of a point-to-point cir-cuit into the IPS HF predictions. Green required all work to be documented and he and Harrison produced the first IPS technical reports, giving an insight into how the early HF predictions were calculated at the IPS.
Returned servicemen who had matriculated were able to enter accelerated university courses and in 1950 two of these people, Frank Cook and Jack Turner, joined the IPS where they remained for the remainder of their careers. Bill El-lis also joined at this time and would eventually become a professor of physics at the University of Tasmania. Richard (Dick) Dowden also joined the IPS in 1956 as an expedi-tioner to Macquarie Island and later became a professor of physics at the University of Otago. Green also employed a
graduate student in 1950, Clarrie McCue, who was the first person to complete a higher degree while working at the IPS (Ellis was the second). McCue rejoined the IPS as its head in 1967.
2.1 Short-term forecasting at the IPS
In the thirties one of Australia’s first ionosondes was installed at Canberra (Anduaga, 2009) and early work on flare pre-diction was carried out by Giovanelli (Frame and Faulkner, 2003). C. W. Allen, at the CSO at Mount Stromlo, started short-term forecasts of geomagnetic disturbances in Aus-tralia in 1944 based mainly on the 27-day recurrence ten-dency, which was very marked at that time – near the mini-mum of the solar cycle. These forecasts were abandoned in 1947 when the increasing activity of solar cycle 18 made re-currence forecasting unreliable.
They were then renewed in 1950 by the IPS on an ex-perimental basis using data from French URSIgram broad-casts and some observations at Mt Stromlo (Cook, 1969). At Mt Stromlo there was a sun telescope (sunspots and white light), the Hale spectrohelioscope (flares,H alpha) and the original 200 MHz solar noise receiver. However, as only one part-time forecaster (Cook) was employed for this work most of the equipment was passed to CSIRO to support their re-search (Cook, unpublished data, 1974). In addition to the data messages, Cook also called on his Morse skills, gained as a wartime radio operator, to include the Japanese Morse code broadcasts, until the navy at HMAS Harman, Canberra, took over the task free of charge in exchange for HF services they received. No data were sent out from Australia except for very occasional cables to Paris of outstanding events ob-served at Mt Stromlo.
The service was sporadic because the Canberra site was unattended for up to 2 weeks at a time and was unmanned over most weekends. The Canberra site was remote or idyllic, depending on your perspective (Fig. 1).
Data were sparse; for instance, almost none were available from regions such as North America and the former USSR, and just prior to the IGY data remained limited (Cook, 1955). The ideal data at the time that could theoretically be obtained came from local and URSIgram sources, e.g.
– solar observations: centres of activity (prominences, flares including locations);
– coronal line intensities and solar noise flux, including outstanding occurrences;
– sudden atmospheric enhancements;
– magneticKindices, crochets and bays;
– ionospheric observations.
Figure 1.Canberra Ionospheric Station, located at Spring Valley below Mt Stromlo, and location of the IPS Disturbance Warning Centre until 1960.
– The URSIgrams were received at Perth because the 7 MHz band was open for 2 h extra over the west coast, but the fixed transmission times together with HF prop-agation conditions could mean missing or garbled mes-sages for several days at a time. (These mesmes-sages were delivered free to IPS in return for HF services.)
– Solar disc observations were made at Paris and would be delayed at least 1 day, and sometimes were 2 or more days old when received.
– Coronal observations were subject to long gaps, espe-cially during the northern winter when the data could be of most use in Australia.
– There was no routine solar observing programme at Mt Stromlo, only occasional sunspot sketches.
– Local (Melbourne and Toolangi)K indices were avail-able weekly, and local, daily magnetic observations were made with an earth-current recorder.
These observations were organized into four categories: daily charts of activity centres; graphs of the coronal green line (far from complete); notes on flares; and 27-dayK in-dex charts; and these were combined with a few statistical relationships to generate a subjective forecast. Probably the two most important relationships were persistence (tomor-row will be the same as today) and recurrence (what hap-pened 27 days ago will happen again). During this early pe-riod of forecasting, there was no feeling of international co-hesion and membership.
The forecasts during this period all appear to have been made by Cook. He observed (Cook, 1955) that “There is no way of forecasting individual flares except to say that they are more likely during the presence on the sun’s disc of suitable centres of activity.” He aimed to correctly predict changes in geomagnetic activity and the likely occurrence of solar flares, which were converted into information about the ionosphere for communicators. The pattern of the sub-sequent ionospheric storm was known to affect the F2 region most, being more severe at high latitudes, during summer and at night. Interestingly, even though the forecaster had very limited resources and forecasts were highly subjective as a result, Cook (1955) offered some early verification of these forecasts providing a performance record of this early fore-casting environment.
Monthly HF predictions were intended to be used under normal or undisturbed conditions and the forecasts supple-mented this information. The targets of these forecasts were Australian communicators using the primary HF circuits, which were found to have different requirements from North-ern Hemisphere circuits. The forecasts were distributed using telephone and telegrams.
3 IGY and beyond
calibre was sought, and finally Dr W. Baker was appointed to the position (1953–1967). His tenure was less success-ful, and documentation from this period is difficult to find. The International Geophysical Year (IGY, 1957–1958) (e.g., Berkner, 1959; Chapman, 1959; Nicolet, 1957, 1983) project took place early in his tenure.
During IGY there were three classes of special days on which research programmes were undertaken. This was to maximize the chance of recording unusual events associated with solar activity during the IGY. There were three kinds of special observations:
– Regular and Priority World Days (RWDs and PRWDs), which were pre-programmed well in advance of IGY;
– Regional Warning Centre (RWC) alerts, to be in effect whenever there was unusually high solar activity;
– Special World Intervals (SWIs), declared prior to the commencement of outstanding geomagnetic distur-bances.
To ensure these periods were recognized internationally, the IGY World Days and Communications was established (Shapley, 1959a), and it drew on both regional and national centres, many of which had long experience as members of the Permanent Committee on URSIgrams.
As with other similar organizations, the IGY was a major event for the IPS. The IGY organization initially created four RWCs and two associate RWCs (ARWCs), supplemented by an increasing number of national centres, thereby developing a global network from existing resources that could collect and assess data for forecasting. The RWC handled communi-cations for one of four global regions, the ARWC supported a RWC, and national centres communicated directly with their local stations. The reporting centre was the US RWC, called the World Warning Agency (WWA), at Ft Belvoir, Virginia, United States. Most centres invited to join the network were already engaged in some type of service, although often in a locally oriented fashion. When the Australian Academy of Science was asked if they could provide a service in their re-gion, Cook was asked to take up the task, thereby broadening the IPS experimental service.
Data exchanged from the previous 24 h included K in-dices, solar flare occurrence (class II and greater), solar ra-dio emissions and fade-outs (SIDs). Codes suitable for rapid transmission were standardized for this purpose (Shapley, 1959b). For the first time, the IPS ARWC made regular daily forecasts for the next day, based on these data. Also, for the first time, data from the American and USSR sectors became available in Australia for forecasting, and data from CSIRO and the IPS were distributed internationally.
Forecasts were exchanged between RWCs using the AD-VICE codes. The Australian ADAD-VICE forecasts were issued at 07:00 UT for the next UT day. The final WWA forecast, based on all the RWC ADVICE forecasts, was issued at 16:00 UT for the next UT day.
The IPS ARWC at Canberra was made a full-time activ-ity and became operational by late 1956. It was operated by Cook, who was appointed the Australian IGY reporter for World Days and Communications and was a member of the IGY subcommittee for Solar Activity. Throughout the IGY, starting in January 1957 (the beginning of the trial period), he was the sole Australian forecaster for most of the IGY and during the first 18-month period provided forecasts 7 days a week.
The first CSAGI (Comité Spécial de l’Année Géophysique Internationale; Special Committee for the IGY) Antarctic Conference in 1955 (Nicolet, 1959a, b) recommended long-term predictions should be obtained for the purposes of HF communications in and to Antarctica, and the IPS was ap-proached to prepare these predictions. At the second confer-ence the offer to provide this service was acknowledged and the third noted these data could be obtained on request from the IPS. This was a substantial task (Harrison and Turner, 1956). There were only a few suitable data-gathering stations to work with. Harrison took on the task using polar projec-tions and the first thing they found was that one could not use 6-month time-shifted Arctic data. At the South Pole there is a diurnal variation, which had to be included. This was found from a meagre amount of data and may have been the first time it was recorded. They also found the diurnal curve was inverted at some sites at some times of the year but it is believed that in the United Kingdom, Roy Piggott recog-nized that earlier (Jack Turner, oral history, 1979). Locally, this consolidated confidence in the IPS HF predictions that now had international recognition.
The World Days and Communications RWC programme was a great success. It was not until the IGY that there was more or less continuous coverage of solar data, although it could still arrive with a 1- or 2-day delay. While this was not significant for geomagnetic forecasts, the delay was too long for flares. Far more successful SWIs were declared than were expected by chance (Nason, 1961), which endorsed the fore-casting techniques used and showed conclusively what could be achieved with 24 h data access. Shapley (1958) presented an assessment of the RWC forecasts for the January 1957 through July 1958 period to CSAGI at their Moscow meet-ing. Cook had ranked best in successes (called a correct SWI forA >30 on the next day), overestimates (called a SWI for A <30) and misses (failed to call a SWI forA >30). This established Cook as the chief forecaster in the IPS, a role he held until he retired in 1981. The IGY programme also formalized conventions and processes that were adopted for use in the IPS and have in some cases been sustained to the current day.
with the local administrative unit. From this time onwards, the ARWC development was closely linked to that of the IPS. In the post-IGY period the IPS Disturbance Warning Sec-tion (its name during IGY and adopted subsequently) con-tinued to operate from Mt Stromlo, Canberra. The separa-tion of the ARWC from the Sydney Head Office meant that it was unlikely to grow, and against Cook’s judgment on this point, Turner insisted on moving the activity to Syd-ney. Turner argued that more people needed to be exposed to both the main work of the IPS as well as Cook’s skill as a forecaster. A number of other issues influenced this decision: changing communications including telex; the logistics and cost of managing remote staff; and possibly the solar research programmes in Sydney (University of Sydney, CSIRO – the old CSIR) compared with Canberra. The move took place in March 1960. This proved difficult until the Balmoral Geo-physical Station (a short distance from the centre of Sydney) was set up with a fluxgate H-component magnetometer and some propagation monitors, which were connected to chart recorders in the IPS Sydney office.
The data flow to the ARWC was still inadequate. In November 1963 Cook presented a paper (lost) at a Solar Symposium on Plans for the Next Solar Cycle outlining the current services and problems experienced due to the obser-vation and data problem. The feelings at the meeting were summed up by Kiepenheuer, who said that in relation to plans for research observations, that “any obligation to pro-vide routine daily data degrades the observations”. The im-plication was that research instrumentation should be able to change and develop and that the resulting science would im-prove forecasting (Cook, unpublished data, 1974). This natu-rally shifted the emphasis of making the routine observations from the researchers, with whom IPS had excellent relations, to the ARWC. It was evident that the ARWC should be re-sponsible for the simpler day-to-day observations: sunspots, flares, active regions and radio fluxes. All the data would need to be stored on permanent media and saved for later research. In 1963 this objective could not be achieved and thus, friendly, ad hoc, local data exchanges continued.
The Federation of Astronomical and Geophysical Services (FAGS) was formed in 1956 and the International World Day Service (IWDS) and the URSI Central Committee on UR-SIgrams were merged to form the International URSIgram and World Days Service (IUWDS) in 1962. IUWDS then joined FAGS. The IUWDS Steering Committee meeting in Belgrade in August 1966 proposed that the Sydney ARWC (still formally attached to the RWC at Tokyo but with di-rect links to WWA) should become the RWC for Australa-sia (which therefore included New Zealand) and Antarctica. This was agreed to at the London (1967) meeting and took effect from l July 1968.
Prior to this, in 1965, NASA/ESSA proposed setting up a solar observatory at Carnarvon, Western Australia. This formed part of the Solar Proton Alert Network (SPAN) that consisted of three stations (Boulder, United States;
Ca-nary Islands, Spain; Carnarvon, Australia) spaced around the globe to allow continuous solar observations with radio and optical telescopes (Canarvon on Tracking Station booklet, 1973). Data from the SPAN network were used primarily to detect the occurrence of solar proton events. The network was a major source of real-time information for the NASA Manned Spacecraft Center on radiation hazards to the as-tronauts during Apollo missions. Under a series of local ar-rangements, the Australian Department of Supply supervised the building of the observatory; IPS was invited to join and was funded under an Umbrella Agreement to attach one, and then two observers to the observatory. When Carnarvon was functional all observations were made by the two IPS ob-servers with technical and logistic support provided by the contractor, AWA.
4 Transition
In early 1966 IPS joined the Bureau of Meteorology, initially for a trial period, the amalgamation becoming official on 11 May 1967. Baker retired in 1967 and in September 1967 Clarrie McCue returned as the head of the IPS. The official title was Assistant Director, IPS, or ADI. McCue held strong views about how the IPS should operate and the type of ad-vanced services it should offer. Many of his opinions were developed during his time working in the defence sector on classified projects, and changes that took place over the next decade were driven from within the IPS although the pace of technology change was also increasing.
McCue encouraged the development of a HF field-strength prediction service that complemented the frequency– availability predictions. Around 1968 there was a burst of publication activity in the IPS documenting current and past work and by 1970 McCue had started employing recent grad-uates to head up a research programme within the IPS. By 1971 McCue had reorganized IPS into the Prediction Branch (containing four sections – Analysis and Application, Ob-servations, High Latitude and Low Latitude), the Warning Branch (headed by Cook and containing the RWC and IPS SPAN Staff) and the Engineering Section headed by Gil Webster. All three branches reported to Turner, the Principal Physicist. Other notable appointments from this time were Dr Leo McNamara (1970), who was originally recruited to work at Canarvon but remained in the IPS Sydney Office to head the Low Latitude Ionosphere Section (one person) and Dr David Cole (1971) who headed the Prediction Branch of the IPS. When Mrs Harrison retired in 1973, Dr Phil Wilkinson replaced her in 1974 as head of the Analysis and Application Section. By 1974 the RWC had a staff of three, one of whom was Peter Davies who had commenced his employment with IPS in 1966 as the Chief Observer for SPAN at Carnarvon.
warn-ings. The HF predictions provided a recommendation of fre-quencies to use throughout the 24 h of the day for a month and were provided 10 weeks in advance (Turner, 1968). To make these predictions, a forecast of the ionospheric condi-tions was required. By the late sixties a weekly HF predic-tion service had also been established and a predicpredic-tion for 6 days in advance was made. These forecasts were compiled by staff of the Disturbance Section (Warning Branch) and the Application and Analysis Section, which was responsi-ble for running the computer programs that produced and distributed the predictions. All these HF predictions were based on the IPS ionosphericT index, developed by Turner (Turner, 1968). To make the weekly prediction, data were collected from all the existing ionosonde stations using a HF radio communications network. In addition to providing a current estimate of ionospheric conditions it had the even more valuable effect of ensuring all ionosonde station opera-tors checked the quality of their film records at least weekly. During the sixties, CSIRO solar research increased at Cul-goora, near Narrabri, NSW, with the installation of the wide-band, radio spectrograph (ranging from 6 to 3800 MHz), a radio heliograph (3 km diameter ring of 96 13.7 m dish an-tennas operating on 43, 80 and 160 MHz) and optical solar observations. For some years before 1971, under an agree-ment with CSIRO, NOAA had been supporting theH alpha (flare) patrol at Culgoora. In July 1971 an IPS physicist was appointed to Culgoora under this agreement, and for the en-tire duration of Project Skylab, a second IPS physicist was funded at Culgoora.
In December 1972 the IPS was transferred from the Bu-reau of Meteorology to the Department of Science and be-came a separate section in it. The IPS remained in this depart-ment for 15 years while the departdepart-ment changed its names and gained different ministers and administrations. Through-out this period, although separate from the Bureau of Me-teorology, the two groups cooperated closely. Strangely, al-though there were strong similarities between the two bodies, this was not seen as the basis for strong synergy. However, Cook (unpublished data, 1974) did refer to the Warning Ser-vice as something that “could be expected to play a major part in any weather service for the space environment”.
At Fleurs, on the outskirts of Sydney, Prof W. N. Chris-tiansen, of the University of Sydney, made solar observations with a synthesis radio interferometer, and an IPS technician (Eugene Molineaux) maintained the equipment and provided data to the RWC. Meanwhile, noise levels were increasing at the Balmoral site so the equipment was moved to Camden, also just outside Sydney, and the Balmoral site was returned to the navy on 1 May 1973.
As 1974 approached, arrangements were in train to close SPAN at the end of the Skylab Mission and transfer the equipment to IPS. North West Cape (Exmouth W.A.) and Culgoora were both suggested as destinations for the equip-ment, and Culgoora was chosen by the IPS because it was the more convenient site. NOAA (US National Oceanic and
Figure 2.Dave Johns standing by the Razdow telescope installed at Culgoora. The IPS now had ownership of solar optical images.
Atmospheric Administration) agreed to assist in the instal-lation costs and supply at least one observer. When Canar-von closed, the NASA/Razdow optical telescope (Fig. 2) was moved to Culgoora and the radio equipment went to Fleurs to join the other radio observations made there. CSIRO rec-ognized the importance of the flare patrols, but did not wish to continue carrying them out, so were happy to pass this re-sponsibility to IPS. By early 1974 all equipment had been transferred and McCue had proposed that a building should be built at Culgoora adjacent to the CSIRO buildings to house the IPS staff and equipment. The building was opened in 1978.
changes seen at Fleurs); and telex (the bulk of all incoming non-Australian data and outgoing data messages and URSI-grams). This latter channel was congested and incoming data could prevent data preparation and outgoing data commu-nications. There was also a significant data-decoding task. While regular forecasters (Cook and Davies) could read telex tapes, more recent forecasters found the task onerous. At this time it was difficult for individual sections of the government to buy computers, but a data processor was a somewhat easier purchase.
In 1976 a PDP-11 processor running a single-user oper-ating system called RT-11 was purchased to process all data coming into the RWC. It was immediately converted into a clumsy, general-purpose computing environment for the IPS, replacing the transportation by road of computer programs between Sydney and Melbourne with an average turnaround of 3 days and occasional 12-day disasters. The only advan-tage the RWC gained from the PDP-11 was that all telex tapes were now converted into text messages by reading the telex tape into the computer.
The main international data sources at this time, where the bulk of the non-Australian observations came from, were France, Japan and the United States.
In 1975 discussions commenced with the USAF and the IPS for the establishment of a new solar observatory at Lear-month, North West Cape. Two IPS physicists would provide the Australian presence at this site. Learmonth was commis-sioned in 1979, adding a further important stream of solar data to the RWC.
Cook and McCue (1975) published a prize-winning paper on the ionospheric forecasting environment. This surveyed the knowledge and observations available to the forecaster of that period, highlighting all the relationships considered im-portant in casting a forecast. The extensive literature reviews in this and Cook (1955) provide useful snapshots of what in-fluenced the forecasters of this era.
In 1968 the possibility of providing warnings for super-sonic aircraft was addressed (Cook, 1968) although no se-rious attempt was made to forecast solar proton events and polar cap absorption due to staff limitations and the lack of adequate solar data. With the opening of the USAF-IPS Lear-month Solar Observatory, near Exmouth W.A. (1979), data flows improved with solar radio observations and in 1979 optical data. This was sufficient to reconsider supersonic air-craft warnings as Concorde was expected to soon commence flights to Australia. However, these flights did not eventuate and no dedicated solar proton service was developed.
By 1978 microprocessor controllers (M6800, M6809) converted local data to a computer-accessible digital signal. This led to a major innovation: the local Camden ionosonde (the experimental 4C) provided ionograms on call in the Syd-ney RWC. Past ionograms could be recalled, but not manip-ulated, and all digital data could be displayed with assorted exploratory betaware. The new forecasting environment was dawning. However, it would be a further 20 years before any
other real-time ionograms reached the RWC. Because the hardware was virtually obsolete and microprocessors were limited, the exercise was regarded as an engineering explo-ration rather than a serious RWC forecasting tool. Further-more, in the RWC the real-time ionosphere was still seen as a by-product of the geomagnetic storm and intrinsically less important for forecasting purposes.
The 4C ionosonde and the earlier 4A and 4B ionosondes were developed at the IPS, and a commercial version of the 4B, the IPS-42 and later versions, were developed at KEL Aerospace Pty Ltd, which was operated by Terry Kelly. By the early nineties, close to 100 of these ionosondes were de-ployed worldwide for ionospheric monitoring although few could provide real-time observations. Titheridge (1994) de-veloped hardware and software modifications for the IPS-42 to replace film recordings with digital recordings, but by that time most IPS-42 ionosondes were gradually being replaced by more versatile ionosondes.
The main services offered to the RWC customers were a warning (of a possible disturbance) and an alert (about a dis-turbance that had commenced). These were given for geo-magnetic storms due to flare activity on the sun and followed the flare by 1 to 3 days; 17 h was considered the shortest likely delay. Flares could also produce solar proton events with delays of hours to minutes. There were also storms un-related to any specific events that recurred every 27 days – the recurrent storms.
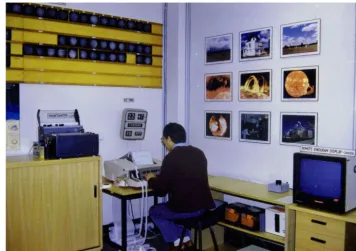
The range of customers for the RWC services increased over this period. In addition to HF communicators and broad-casters there was a growing interest in geomagnetic storms. By the mid-seventies, few, if any customers were contacted by telephone; telegrams had been discontinued and the ings were distributed by telex. Figure 3 shows the IPS warn-ing centre, part of the Disturbance Warnwarn-ing Section, and Fig. 4 shows the staff of this section around 1978. For a de-tailed description, see Cook and Davies (1979).
A key problem encountered around this time was how to be certain of sending the warning to the most suitable distri-bution point in a customer group. Although group addressing was possible, it took a substantial amount of time to send out a warning to all customers. The service was offered 7 days a week during working hours on weekdays and for most of the morning on weekends. This model has continued to the present day.
Figure 3.A partial view of the warning centre showing the central communications system – the telex.
IPS. Generally, forecasts were made for geomagnetic distur-bances and all subsequent forecasts were derived from this top-level forecast. By definition, a geomagnetic storm cor-responded to Ap>20. However, recurrent storms were low-level storms that could lead to regional ionospheric effects but did not necessarily do so. A minor (30>Ap>20) recur-rent storm might have no impact on the local ionosphere, or it could have a severe effect. More confusing, the local iono-sphere could become highly disturbed, clearly showing storm effects, while no accompanying local geomagnetic effect was observed. With no other observations available it appeared that cause and effect had come undone and Cook, in partic-ular, was very uncomfortable issuing an ionospheric storm alert at these times. He argued that just because the Sydney ionosphere was disturbed it did not mean this was typical of all of Australia and it was completely arbitrary to issue a storm alert when there was no clear cause for the storm. His argument did not carry the day and an important principle was downgraded: cause and effect does count. As a compro-mise, to some extent ionospheric alerts became disconnected from geomagnetic forecasts.
5 The modern era
In 1978 McCue left IPS to become the Director of the Aus-tralian Antarctic Division and Dr David Cole became the head of the IPS. The official title at that time for the head of the IPS was Assistant Secretary, IPS, and later Director, IPS. There were far greater changes over the next 3 decades than were experienced in the previous 3. The available data
exploded to cover, if sparsely, all the domains of importance for a forecaster, while the advent of the Internet expanded both the availability of these data and also the range of cus-tomers who could access IPS services, which by the mid-nineties were predominantly worldwide web services. At the same time, data agreements fragmented and customers, al-though numerous, were often IP addresses at best. Preceding this huge computer driven change was the government direc-tive to charge for services. This had the potential to distort the service profile, focusing attention on areas where revenue was possible. The RWC did not fit into this model as it was reliant on international data flows, and viewed data exchange as payment for what it received.
The 1970s closed with the first Solar Prediction Workshop, in Boulder, Colorado, 1979. Around the same time coronal holes were recognized as the source of high-speed solar-wind streams responsible for recurrent storms; the mysteri-ous, magneticM regions had been conclusively identified. Importantly, the science of forecasting was becoming main-stream and gradually the statistical relationships would be replaced by more direct observations, often from satellites, a process that continues to this day. By broadening the range of forecasters to include most scientists working in the IPS, the RWC became an important training environment for the IPS.
di-Figure 4.Disturbance Warning Section Sydney staff (1978): Eugene Molineaux, Fleurs technician, Dr Carl Ling, Peter Davies and Frank Cook (Head).
vision was committed to supplying heliograph and spectro-graph data to NASA. They therefore transferred the radio spectrograph to IPS, moving the hardware physically to the IPS buildings at Culgoora and relocating the antennas to the side of the IPS building – a massive exercise, the aging elec-tronics alone filling an entire room. The IPS RWC took over responsibility for all the equipment after 1984, with con-tinuing assistance from CSIRO Radiophysics. Subsequently, the spectrograph was completely rebuilt and remains opera-tional.
The telex data bottleneck persisted into the late eighties. Meanwhile, the entire computing environment at the IPS evolved. RT-11 had been replaced by a multi-user environ-ment called TSX, which was amazingly unstable, and was then replaced by the RSX operating system. While that multi-user environment was far more stable, it was still too expen-sive and complicated for the IPS to use it to control external equipment. By 1984 the decision was made to seek funds to upgrade the entire computing system from a PDP-based sys-tem to a VAX running UNIX. This transition was managed by Hamish Reid (computing) and Gil Webster (engineering). Once the change was made, IPS rapidly developed a com-puting section, directed in the initial years by Craig Bevins and later by Colin Yuile, and a more structured approach was adopted for all operational software.
As a minor adjunct to this change a telex interface was obtained to run with UNIX, and the apocryphal words “be-cause the interface is so complex, the software will be very simple” were written down. Much time was spent solving the problems that came with this simple software and many
hours were spent discussing its shortcomings. Nevertheless, it finally removed the telex data bottleneck. Meanwhile, telex was gradually fading from existence in Australia, and ulti-mately the IPS, and a very small number of its customers, were among the last groups to give up using it.
In 1989 IPS hosted the third Solar Prediction Workshop, which was attended by many key people who would go on to develop the growing field of space weather (Fig. 5). This workshop and those preceding it highlight the rapid develop-ment and improvedevelop-ments in our understanding of the science of space weather compared with the more subjective con-cepts that typified the early development of space weather forecasting.
Figure 5.Attendees of the third Solar Prediction Workshop (1989) hosted by the IPS at Leura, in the Blue Mountains to the west of Sydney (are you there?).
The flow of data into IPS increased ever more dramatically after 1995. With the advent of satellite observations of the sun and the sun–earth environment, many solar data streams became globally available, some in near-real time. The data from such seminal satellite observatories as SOHO (1995), ACE (1997) and Stereo (2006) immensely changed the phi-losophy of space weather forecasting. They also highlighted the increasing global reliance on space technology. This gave rise to the Australian Space Weather Plan proposed by the IPS in 2003 which recognized the increasing need for space weather forecasts. The main objective of the RWC, develop-ing at this time, was to convert data streams into computer regulated services. In around 1997 IPS commenced devel-oping a magnetometer network. This added an extra stream of services, initially supporting the aeromagnetic industry in Australia, and opened the way to later develop pipeline and power line services in the mid-2000s to late 2000s. The real-time geomagnetic data also confirmed services based on in-coming solar wind data.
Over this period the IPS RWC became the hub for streams of solar, geomagnetic and ionospheric data. The intersection of real-time satellite observations and improving global digi-tal communications underlined the vidigi-tal importance of global data exchange and its use by regional analysts for regional purposes.
In 2007, David Cole retired and in 2008 IPS rejoined the Bureau of Meteorology. Wilkinson became the new head of the IPS, with the title Assistant Director, and when he re-tired IPS was split into two functions: Space Weather Ser-vices (SWS), which contained all the serSer-vices, including the RWC, and the Observations Section, which now maintains the extensive network of operational equipment that forms an essential part of any modern space weather enterprise.
6 Conclusions
foreshadowed by Shapley and anticipated by many working in the space environment during its formative years. It is fair to say that their dreams are now being realized as part of the modern space weather forecasting operational environment.
This paper has outlined aspects in the development of one such government agency that, for now, can carry out these ac-tivities and provide space weather services to Australia, and nearby regions, as well as participate in the growing interna-tional activity of space weather.
Data availability. No formal data sets were used in this research.
Competing interests. All the authors participated in the history reported here from about 1970 onwards. Other staff members have read earlier drafts of the paper and one retired staff member, Richard Thompson, was a referee for the paper.
Special issue statement. This article is part of the special issue “History of regional warning centers”. It is not associated with a conference.
Acknowledgements. The authors would like to thank Richard Thompson and an anonymous reviewer for their helpful sug-gestions. We would also like to thank other ex-staff of IPS who commented on earlier versions of this paper.
Edited by: Kristian Schlegel
Reviewed by: Richard Thompson and one anonymous referee
References
Anduaga, A: Wireless and Empire, Oxford Uni-versity Press, ISBN 978–0–19–956272–5, https://doi.org/10.1093/acprof:oso/9780199562725.001.1, 2009.
Berkner, L. V.: The International Geophysical Year (1959), Proceedings of the IRE, 47, p. 133, https://doi.org/10.1109/JRPROC.1959.287256, 1959.
Carnarvon Tracking Station booklet: available at: https: //www.honeysucklecreek.net/images/other_stations/carnarvon/ Carnarvon_booklet_Dept_Supply.pdf, 1973.
Chapman, S.: The Histories of the International Polar Years and the Inception and Development of the International Geophysical Year, Annals of the International Geophysical Year, 1, 1959.
Cook, F. E.: Forecasting of geomagnetic disturbances, IPS Report R6, 1955.
Cook, F. E.: Notes on solar flare warning for supersonic transport aircraft, IPS Report R10, 1968.
Cook, F. E.: Notes on the IUWDS Regional Warning Centre at IPSD Sydney (December 1968), IPS Report. X-2, 1969.
Cook, F. E. and Davies, P.: A Review of the Operation of the IUWDS Regional Warning Centre at the Ionospheric Prediction Service, Sydney, in: International Solar-Terrestrial Predictions Proceedings & Workshop Program, 1979.
Cook, F. E. and McCue, C. G.: Solar-terrestrial relations and short-term ionospheric forecasting, J. I. Electron. Rad. Eng., 45, p. 11, https://doi.org/10.1049/ree.1975.0004, 1975.
Frame, T. and Faulkner, D.: Stromlo: An Australian Observatory, Allen & Unwin, 2003.
Harrison, M. and Turner, J. F.: The Antarctic Prediction Project, Technical Report – IPS Report R7, 1956.
International URSIgram and World Day Services IUWDS Synoptic codes for solar and geophysical data, July, 1973.
Nason, M. E.: Evaluation of the special world interval program during the IGY, J. Geophys. Res. 66, 3597, https://doi.org/10.1029/JZ066i010p03597, 1961.
Nicolet, M.: The International Geophysical Year, Nature, 180, p. 7, https://doi.org/10.1038/180007a0, 1957.
Nicolet, M.: The International Geophysical Year Meetings, Annals of the International Geophysical Year, V11B, 1959a.
Nicolet, M.: The International Geophysical Year (1957–1958) – Great achievements and minor obstacles, GeoJournal, 8, p. 303, 1959b.
Nicolet, M.: Historical Aspects of the IGY, Eos, 64, p. 369, https://doi.org/10.1029/EO064i019p00369-01, 1983.
Shapley, A. H.: Fifth CSAGI Meeting – RWC Advice analysis re-sults (Memorandum RWC-56), 1958.
Shapley, A. H.: The Day-to-Day Coordination of IGY Observations, Proceedings of the IRE Vol 47, p.323, https://doi.org/10.1109/JRPROC.1959.287301, 1959a.
Shapley, A. H.: World Days and Communications, Annals of the International Geophysical Year VII pt1, available at: http://nsidc.org/arc/archives-catalog/index.php?p=core/ search&subjectid=10 (last access: 28 April 2018), 1959b. Titheridge, J. T.: Computer Control of an IPS-42 INAG (Ionosonde,
Ionosonde Network Advisory Group) Bulletin, 60, avail-able at: http://www.sws.bom.gov.au/IPSHosted/INAG/, http://pandora.nla.gov.au/pan/128603/20171228-0001/www. sws.bom.gov.au/IPSHosted/INAG/web-60/digion.htm(last access: 28 April 2018), 1994.