www.atmos-meas-tech.net/7/3623/2014/ doi:10.5194/amt-7-3623-2014
© Author(s) 2014. CC Attribution 3.0 License.
The MOPITT Version 6 product:
algorithm enhancements and validation
M. N. Deeter1, S. Martínez-Alonso1, D. P. Edwards1, L. K. Emmons1, J. C. Gille1, H. M. Worden1, C. Sweeney2,
J. V. Pittman3, B. C. Daube3, and S. C. Wofsy3
1Atmospheric Chemistry Division, National Center for Atmospheric Research, Boulder, CO, USA 2Global Monitoring Division, NOAA/ESRL, Boulder, CO, USA
3Department of Earth and Planetary Sciences, Harvard University, Cambridge, MA, USA
Correspondence to: M. N. Deeter ([email protected])
Received: 15 May 2014 – Published in Atmos. Meas. Tech. Discuss.: 18 June 2014
Revised: 11 September 2014 – Accepted: 26 September 2014 – Published: 5 November 2014
Abstract. The Measurements of Pollution in the
Tropo-sphere (MOPITT) Version 6 (V6) product for carbon monox-ide (CO) incorporates several enhancements which will ben-efit many users of MOPITT data. V6 algorithm improve-ments are described in detail, and V6 validation results are presented. First, a geolocation bias related to the orienta-tion of the MOPITT instrument relative to the TERRA plat-form was characterized and eliminated. Second, the variable a priori for CO concentrations for V6 is based on simula-tions performed with the chemical transport model Commu-nity Atmosphere Model with Chemistry (CAM-chem) for the years 2000–2009 instead of the model-derived climatol-ogy for 1997–2004 used for V5. Third, meteorological fields required for V6 retrieval processing are extracted from the MERRA (Modern-Era Retrospective Analysis For Research And Applications) reanalysis. Finally, a significant latitude-dependent retrieval bias in the upper troposphere in Version 5 products has been substantially reduced.
1 Introduction
Measurements of Pollution in the Troposphere (MOPITT) is an instrument on the NASA Terra platform designed to permit retrievals of tropospheric profiles of carbon monox-ide (CO) using both thermal-infrared (TIR) and near-infrared (NIR) observations. Satellite measurements of CO enable air quality forecasts as well as a variety of studies of pollu-tion sources, transport, and atmospheric chemistry (Shindell et al., 2006). The MOPITT instrument has been operating
nearly continuously since 2000 (Drummond et al., 2010). MOPITT retrieval products have improved continuously as the result of accumulated knowledge regarding the instru-ment, forward modeling methods, and geophysical variables. The history of retrieval algorithm development for the MO-PITT mission was recently summarized in Worden et al. (2014).
2 V6 algorithm features
2.1 Geolocation bias correction
Geolocation data (i.e., latitude and longitude values) reported in previous (V3, V4, and V5) MOPITT Level 1 and Level 2 products appear to be biased due to a misalignment be-tween the MOPITT reference frame and the Terra platform. As described in a technical report available on the MOPITT website (Deeter, 2012), a method was developed to quan-tify the angular misalignment from observations of latitudi-nal and longitudilatitudi-nal biases in daytime overpasses. The es-timated along-track viewing angle bias was 0.59◦while the estimated cross-track viewing angle bias was 2.61◦. The cor-responding uncertainty in these viewing angle corrections was estimated as 0.4◦. An experimental Level 1 processor (i.e., the processing software which generates the MOPITT Level 1 radiance product) which explicitly corrects for the viewing angle bias was developed and used to validate the correction method. Comparisons of MOPITT radiances and retrieval products in various geographical regions before and after the geolocation correction indicate that the method es-sentially eliminates the geolocation bias. The resulting im-provement in geolocation is illustrated in Fig. 1, where grid-ded NIR (Channel 6) clear-sky radiances are shown for all daytime overpasses of Baja California during 2002. The left and right panels present V5 (uncorrected) and V6 (corrected) gridded radiances, respectively. The coastline separating the low-albedo ocean and high-albedo land is clearly positioned more accurately in the V6 data.
2.2 CO a priori
Like the V4 and V5 products (Deeter et al., 2010, 2013), the V6 products rely on variable a priori to represent the geographical and seasonal variability of “background” con-centrations of CO. Whereas for earlier products CO a pri-ori concentrations were based on monthly climatologies for the years 1997–2004 (Deeter et al., 2010) and was simu-lated with the Model for OZone and Resimu-lated chemical Trac-ers (MOZART) (Emmons et al., 2010), for V6 the a priori CO is based on monthly climatologies for the years 2000– 2009 simulated with the Community Atmosphere Model with Chemistry (CAM-chem) model (Lamarque et al., 2012). MOPITT a priori volume mixing ratio (VMR) values vary by month, but do not vary from year to year; this simplifies the interpretation of long-term trends in the data. A potential ad-vantage of the new a priori is that it should represent mean global CO concentrations during the actual MOPITT mis-sion (2000 to present) better than the V5 a priori. Like the previous MOZART-based climatology, the new CAM-chem-based climatology is gridded at 1◦ (latitude/longitude) hor-izontal resolution and monthly temporal resolution. Spatial and temporal interpolation are used to generate a priori val-ues at a specific location and day.
2.3 Meteorological data
For each CO retrieval, the MOPITT retrieval algorithm re-quires temperature and water vapor profiles as well as a priori surface temperature values. In previous operational processors, relevant meteorological data were extracted from NCEP (National Center for Environmental Prediction) GDAS (Global Data Assimilation System) forecast products and then interpolated spatially and temporally to each MO-PITT observation. For V6 processing, meteorological pro-files are interpolated from the NASA MERRA (Modern-Era Retrospective Analysis For Research And Applica-tions) reanalysis product (http://gmao.gsfc.nasa.gov/merra/) (Rienecker et al., 2011). Several benefits are anticipated as a result of using MERRA products rather than NCEP. First, generally higher-quality retrieval results are expected due to higher-quality water vapor profiles; unphysical values in NCEP water vapor profiles (Deeter et al., 2013) were previ-ously found to sometimes cause anomalous surface-level CO concentrations over the ocean offshore the state of Califor-nia. Also, higher-quality retrieval results should be achieved over land due to the use of hourly resolved MERRA sur-face skin temperatures instead of 6-hourly NCEP sursur-face- surface-level air temperatures; skin temperature more closely rep-resents the radiative surface temperature to which MOPITT thermal-channel radiances respond. Higher-quality retrieval results are also expected due to higher horizontal and verti-cal spatial resolution in the meteorologiverti-cal fields; MERRA is produced at 1/2 by 2/3◦(latitude/longitude) horizontal res-olution on a 42-level pressure grid, whereas NCEP GDAS products are produced at 1◦ horizontal resolution on a 26-level pressure grid. Finally, we expect improved long-term stability of MOPITT retrieval products as the result of the use of climate-quality reanalysis instead of output from a mete-orological forecasting system. MERRA reanalysis products are typically released 1 month at a time, with a data latency of about 2 to 3 weeks. This leads to data latencies for MO-PITT V6 products of 1 to 2 months and prevents their use in near-realtime applications. However, a non-operational V6 processing system for near-realtime applications has been developed exploiting the GEOS-5 forecast products instead of MERRA. Results from this alternative processing system have not been thoroughly evaluated.
2.4 Radiance bias corrections
Figure 1. Gridded Channel 6 “Average” (6A) NIR radiances for daytime MOPITT overpasses of Baja California during 2002. NIR radiances are generally larger over land than over ocean because of higher albedo. V5 radiances in the left panel clearly exhibit a lateral shift (or geolocation bias) between the true coastline and the coastline indicated by the radiances. This bias is greatly reduced in the V6 radiances presented in the right panel.
and geophysical errors. They were first introduced to com-pensate for observed biases in Channel 5 radiances (Deeter et al., 2004), but are useful for compensating for biases in both Channel 5 and 7 (TIR) radiances. No significant radi-ance bias was observed for the MOPITT Channel 6 (NIR) radiances in Version 5 products; hence, radiance bias correc-tion has so far only been employed for the TIR radiances. Prior to releasing new MOPITT products, final correction factors are determined iteratively, using retrieval validation results for CO retrieved profiles and total column as indica-tors of radiance bias. The number of iterations employed in this process is however limited because of the large compu-tational expense.
Validation results for both the V5 TIR-only and TIR/NIR products indicated a substantial bias at 200 hPa (Deeter et al., 2013). Specifically, for the V5 TIR-only product, the ob-served overall bias at 200 hPa was 7.9 % using the NOAA in situ profiles, mainly representing North America, and 10 % using the HIAPER (High-performance Instrumented Airborne Platform for Environmental Research) Pole-to-Pole Observations (HIPPO) field campaign profiles over the Pa-cific Ocean (described below). However, analysis of the V5 HIPPO validation results revealed that the bias at 200 hPa was strongly latitude dependent, with biases in the tropics reaching roughly 20–30 % and much smaller biases in mid-latitude and polar regions. For V6, the radiance correction factors for radiances 5A, 5D, and 7D were revised in order to reduce the large retrieval bias at 200 hPa without severely de-grading the retrieval biases at other retrieval levels. For V5, radiance correction factors for the TIR radiances 5A, 5D, and 7D were respectively set to 0.99680, 0.98570, and 0.97000. For V6 processing, radiance correction factors were revised to 0.99685, 0.98565, and 0.90000. The significant change in
the 7D radiance correction factor reflects the primary role of the 7D radiance on retrieved CO concentrations in the upper troposphere (Deeter et al., 2004).
3 V6 validation results
Retrieval validation involves statistical comparisons of MOPITT retrieval products (CO VMR profiles and total columns) with in situ measurements. For this purpose, we consider the in situ measurements to be exact and assume that the in situ vertical profiles are representative horizon-tally over an extended region around the sampling location. A collocation radius of 50 km was employed for the NOAA profiles and 200 km for the HIPPO profiles. The larger accep-tance radius for the HIPPO profiles is justified by the expec-tation that CO vertical and horizontal gradients in the vicinity of the HIPPO profiles should generally be much weaker than for the NOAA aircraft profiles, because of the remoteness of these profiles relative to CO source regions. This choice has consequences for the effects of random retrieval errors, as de-scribed in Sect. 3.2.1. Because of the coarseness of the radi-ance weighting functions (or “Jacobians”) and the undercon-strained nature of the retrieval process, retrieval products ob-tained with optimal estimation-type retrieval algorithms are constrained by a priori information as well as the measure-ments (Pan et al., 1998; Rodgers, 2000). A priori information is represented by (1) an a priori profilexaand (2) an a priori covariance matrix, which determines the strength of the a pri-ori constraint. The relationship between the true profilextrue,
xa, and retrieved profilexrtvis expressed by the equation
xrtv=xa+A(xtrue−xa), (1)
Table 1. NOAA validation site locations.
NOAA validation site Latitude Longitude Observational period
Poker Flat, Alaska 65.07◦N 147.29◦W 17/4/00–26/4/13
East Trout Lake, Saskatchewan 54.35◦N 104.98◦W 14/8/06–21/9/13
Dahlen, North Dakota 47.50◦N 99.24◦W 14/4/05–13/9/13
Worcester, Massachusetts 42.95◦N 70.63◦W 31/3/05–22/8/13
Harvard Forest, Massachusetts 42.54◦N 72.17◦W 27/2/01–18/11/07
West Branch, Iowa 41.72◦N 91.35◦W 7/11/04–10/12/13
Trinidad Head, California 41.05◦N 124.15◦W 2/9/03–11/12/13
Beaver Crossing, Nebraska 40.80◦N 97.18◦W 2/11/04–21/6/10
Briggsdale, Colorado 40.37◦N 104.3◦W 2/5/00–30/12/13
Homer, Illinois 40.07◦N 87.91◦W 15/12/04–21/11/12
Cape May, New Jersey 38.83◦N 74.32◦W 17/8/05–13/12/13
Norfolk, Virginia 36.70◦N 75.50◦W 8/6/05–29/4/07
Charleston, South Carolina 32.77◦N 79.55◦W 16/2/04–9/11/11
Sinton, Texas 27.73◦N 96.86◦W 1/10/03–22/6/13
Molokai, Hawaii 21.23◦N 158.95◦W 12/12/00–15/4/08
Rarotonga, Cook Islands 21.25◦S 159.83◦W 22/3/01–27/6/13
0 50 100 150 200
Retrieved CO Mixing Ratio (ppbv) 1000
100
Pressure (mb)
1000 700 400
-0.2 0.0 0.2 0.4 0.6
CO Averaging Kernels 1000
100
Pressure (hPa)
1000 700 400
Surface
800 600 400
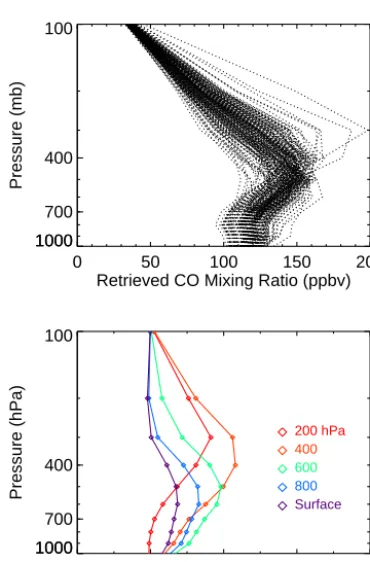
200 hPa
Figure 2. V6 TIR-only retrieved CO profiles (top) and associ-ated mean averaging kernels (bottom) for observations obtained on 10 April 2010 between 20 and 24◦N, 160 and 156◦W.
3.1 Results based on NOAA aircraft profiles
In situ measurements of CO concentrations acquired through NOAA’s flask sampling program have served as the foun-dation for previous MOPITT valifoun-dation efforts (Emmons et
al., 2009; Deeter et al., 2013). Flask samples obtained on aircraft are processed by the Global Monitoring Division of NOAA’s Earth System Research Laboratory (ESRL). NOAA stations used for MOPITT validation are primarily located in North America and are listed in Table 1. Aircraft profiles ac-quired through the end of 2013 were exploited to validate the MOPITT V6 product. Flask samples are typically ac-quired from near the surface up to about 350–400 hPa. Typ-ical in situ profiles are derived from approximately 12 flask samples. In order to obtain a complete validation profile for comparison with MOPITT retrievals, each in situ profile is extended vertically above the highest in situ measurement using the chemical transport CAM-chem (to be consistent with the new V6 a priori) and then resampled to the stan-dard pressure grid used for the MOPITT operational radiative transfer model (Emmons et al., 2004). The entire database of NOAA aircraft profiles (http://www.esrl.noaa.gov/gmd/ ccgg/aircraft/index.html) acquired during the MOPITT mis-sion currently includes more than 2000 CO profiles.
3.1.1 V6 TIR-only
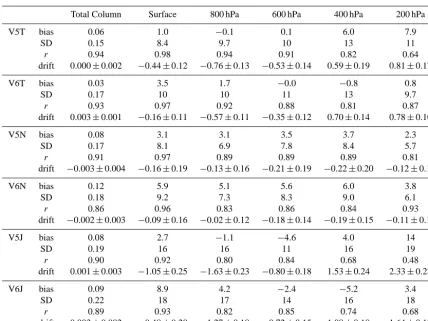
Table 2. Summarized validation results for V5 and V6 TIR-only (V5T and V6T), NIR-only (V5N and V6N), and TIR/NIR (V5J and V6J) products based on in situ data from NOAA validation sites. Bias and standard deviation statistics for the total column are in units of 1018mol cm−2. Bias and standard deviations for retrieval levels are expressed in %. Total column drift is in units of 1018mol cm−2yr−1. Drift for the retrieval levels is expressed in % yr−1.
Total Column Surface 800 hPa 600 hPa 400 hPa 200 hPa
V5T bias 0.06 1.0 −0.1 0.1 6.0 7.9
SD 0.15 8.4 9.7 10 13 11
r 0.94 0.98 0.94 0.91 0.82 0.64
drift 0.000±0.002 −0.44±0.12 −0.76±0.13 −0.53±0.14 0.59±0.19 0.81±0.17
V6T bias 0.03 3.5 1.7 −0.0 −0.8 0.8
SD 0.17 10 10 11 13 9.7
r 0.93 0.97 0.92 0.88 0.81 0.87
drift 0.003±0.001 −0.16±0.11 −0.57±0.11 −0.35±0.12 0.70±0.14 0.78±0.10
V5N bias 0.08 3.1 3.1 3.5 3.7 2.3
SD 0.17 8.1 6.9 7.8 8.4 5.7
r 0.91 0.97 0.89 0.89 0.89 0.81
drift −0.003±0.004 −0.16±0.19 −0.13±0.16 −0.21±0.19 −0.22±0.20 −0.12±0.14
V6N bias 0.12 5.9 5.1 5.6 6.0 3.8
SD 0.18 9.2 7.3 8.3 9.0 6.1
r 0.86 0.96 0.83 0.86 0.84 0.93
drift −0.002±0.003 −0.09±0.16 −0.02±0.12 −0.18±0.14 −0.19±0.15 −0.11±0.10
V5J bias 0.08 2.7 −1.1 −4.6 4.0 14
SD 0.19 16 16 11 16 19
r 0.90 0.92 0.80 0.84 0.68 0.48
drift 0.001±0.003 −1.05±0.25 −1.63±0.23 −0.80±0.18 1.53±0.24 2.33±0.28
V6J bias 0.09 8.9 4.2 −2.4 −5.2 3.4
SD 0.22 18 17 14 16 18
r 0.89 0.93 0.82 0.85 0.74 0.68
drift 0.003±0.002 −0.48±0.20 −1.27±0.18 −0.72±0.15 1.08±0.18 1.64±0.19
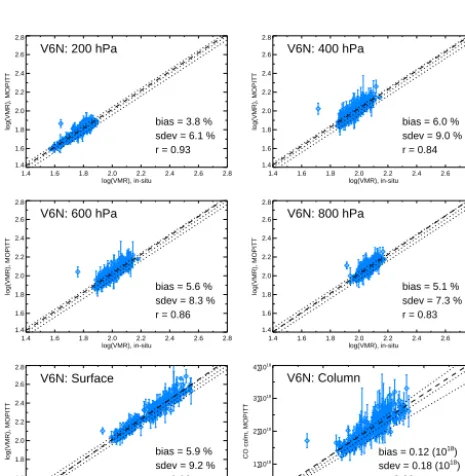
3.1.2 V6 NIR-only
NIR-only retrievals are mainly useful for constraining CO total column; these retrievals are based solely on the ratio of the Channel 6 “Difference” and “Average” signals (Deeter et al., 2009) and contain no useful information about the CO vertical distribution. Thus, the shape of MOPITT NIR-only retrieved profiles only reflects a priori information. V6 NIR-only retrieval results are compared with corresponding sim-ulated retrievals in Fig. 4 and are summarized in Table 2. V6 NIR-only validation results indicate a positive bias at all lev-els ranging from about 4 to 6 % which is a slight increase compared to V5 NIR-only products.
3.1.3 V6 TIR/NIR
V6 TIR/NIR validation results shown in Fig. 5 and summa-rized in Table 2 reveal biases ranging from about −5 % at 400 hPa to 9 % at the surface. Compared to the V5 product, the bias is substantially smaller at 200 hPa (decreasing from 14 to 3.4 %) but somewhat larger at the surface (increasing from 2.7 to 8.9 %). Qualitatively, the opposing changes in
1.4 1.6 1.8 2.0 2.2 2.4 2.6 2.8 log(VMR), in-situ 1.4 1.6 1.8 2.0 2.2 2.4 2.6 2.8 log(VMR), MOPITT
V6T: 200 hPa
r = 0.87 bias = 0.8 % sdev = 9.7 %
1.4 1.6 1.8 2.0 2.2 2.4 2.6 2.8 log(VMR), in-situ 1.4 1.6 1.8 2.0 2.2 2.4 2.6 2.8 log(VMR), MOPITT
V6T: 400 hPa
r = 0.81 bias = -0.8 % sdev = 13. %
1.4 1.6 1.8 2.0 2.2 2.4 2.6 2.8 log(VMR), in-situ 1.4 1.6 1.8 2.0 2.2 2.4 2.6 2.8 log(VMR), MOPITT
V6T: 600 hPa
r = 0.88 bias = -0.0 % sdev = 11. %
1.4 1.6 1.8 2.0 2.2 2.4 2.6 2.8 log(VMR), in-situ 1.4 1.6 1.8 2.0 2.2 2.4 2.6 2.8 log(VMR), MOPITT
V6T: 800 hPa
r = 0.92 bias = 1.7 % sdev = 10. %
1.4 1.6 1.8 2.0 2.2 2.4 2.6 2.8 log(VMR), in-situ 1.4 1.6 1.8 2.0 2.2 2.4 2.6 2.8 log(VMR), MOPITT V6T: Surface
r = 0.97 bias = 3.5 % sdev = 10. %
0 1•1018 2•1018 3•1018 4•1018
CO total column, in-situ 0
1•1018
2•1018
3•1018
4•1018
CO colm, MOPITT
V6T: Column
r = 0.93 bias = 0.03 (1018)
sdev = 0.17 (1018)
Figure 3. Scatterplots showing V6 TIR-only (V6T) validation re-sults based on NOAA profiles. CO total column values in the bottom right panel are reported in units of mol cm−2. Dotted lines in each panel indicate the ideal one-to-one dependence and±10 % error boundaries. Error bars attached to each data point indicate the asso-ciated standard deviation of the retrieved log(VMR) values for each overpass. The dashed line in each panel shows the least-squares best fit.
1.4 1.6 1.8 2.0 2.2 2.4 2.6 2.8 log(VMR), in-situ 1.4 1.6 1.8 2.0 2.2 2.4 2.6 2.8 log(VMR), MOPITT
V6N: 200 hPa
r = 0.93 bias = 3.8 % sdev = 6.1 %
1.4 1.6 1.8 2.0 2.2 2.4 2.6 2.8 log(VMR), in-situ 1.4 1.6 1.8 2.0 2.2 2.4 2.6 2.8 log(VMR), MOPITT
V6N: 400 hPa
r = 0.84 bias = 6.0 % sdev = 9.0 %
1.4 1.6 1.8 2.0 2.2 2.4 2.6 2.8 log(VMR), in-situ 1.4 1.6 1.8 2.0 2.2 2.4 2.6 2.8 log(VMR), MOPITT
V6N: 600 hPa
r = 0.86 bias = 5.6 % sdev = 8.3 %
1.4 1.6 1.8 2.0 2.2 2.4 2.6 2.8 log(VMR), in-situ 1.4 1.6 1.8 2.0 2.2 2.4 2.6 2.8 log(VMR), MOPITT
V6N: 800 hPa
r = 0.83 bias = 5.1 % sdev = 7.3 %
1.4 1.6 1.8 2.0 2.2 2.4 2.6 2.8 log(VMR), in-situ 1.4 1.6 1.8 2.0 2.2 2.4 2.6 2.8 log(VMR), MOPITT V6N: Surface
r = 0.96 bias = 5.9 % sdev = 9.2 %
0 1•1018 2•1018 3•1018 4•1018
CO total column, in-situ 0
1•1018
2•1018
3•1018
4•1018
CO colm, MOPITT
V6N: Column
r = 0.86 bias = 0.12 (1018)
sdev = 0.18 (1018)
Figure 4. Scatterplots showing V6 NIR-only (V6N) validation re-sults based on NOAA profiles. See caption to Fig. 3.
1.4 1.6 1.8 2.0 2.2 2.4 2.6 2.8 log(VMR), in-situ 1.4 1.6 1.8 2.0 2.2 2.4 2.6 2.8 log(VMR), MOPITT
V6J: 200 hPa
r = 0.68 bias = 3.4 % sdev = 18. %
1.4 1.6 1.8 2.0 2.2 2.4 2.6 2.8 log(VMR), in-situ 1.4 1.6 1.8 2.0 2.2 2.4 2.6 2.8 log(VMR), MOPITT
V6J: 400 hPa
r = 0.74 bias = -5.2 % sdev = 16. %
1.4 1.6 1.8 2.0 2.2 2.4 2.6 2.8 log(VMR), in-situ 1.4 1.6 1.8 2.0 2.2 2.4 2.6 2.8 log(VMR), MOPITT
V6J: 600 hPa
r = 0.85 bias = -2.4 % sdev = 14. %
1.4 1.6 1.8 2.0 2.2 2.4 2.6 2.8 log(VMR), in-situ 1.4 1.6 1.8 2.0 2.2 2.4 2.6 2.8 log(VMR), MOPITT
V6J: 800 hPa
r = 0.82 bias = 4.2 % sdev = 17. %
1.4 1.6 1.8 2.0 2.2 2.4 2.6 2.8 log(VMR), in-situ 1.4 1.6 1.8 2.0 2.2 2.4 2.6 2.8 log(VMR), MOPITT V6J: Surface
r = 0.93 bias = 8.9 % sdev = 18. %
0 1•1018 2•1018 3•1018 4•1018
CO total column, in-situ 0
1•1018
2•1018
3•1018
4•1018
CO colm, MOPITT
V6J: Column
r = 0.89 bias = 0.09 (1018)
sdev = 0.22 (1018)
Figure 5. Scatterplots showing V6 TIR/NIR (V6J) validation results based on NOAA profiles. See caption to Fig. 3.
3.2 Results based on HIPPO profiles
Table 3. Summarized validation results for V5T and V6T products based on in situ data from HIPPO field campaign. See caption to Table 2.
Total column Surface 800 hPa 600 hPa 400 hPa 200 hPa
V5T bias 0.00 0.7 −1.7 −2.1 4.7 10
SD 0.08 7.7 9.6 9.9 10 12
r 0.97 0.97 0.96 0.95 0.94 0.88
V6T bias −0.02 0.7 −2.0 −4.8 −3.8 1.5
SD 0.10 7.9 9.9 11 9.7 7.7
r 0.96 0.97 0.95 0.93 0.94 0.97
1.4 1.6 1.8 2.0 2.2 2.4 2.6 2.8 log(VMR), in-situ 1.4 1.6 1.8 2.0 2.2 2.4 2.6 2.8 log(VMR), MOPITT
V6T: 200 hPa H1 H2 H3 H4 H5
r = 0.97 bias = 1.5 % sdev = 7.7 %
1.4 1.6 1.8 2.0 2.2 2.4 2.6 2.8 log(VMR), in-situ 1.4 1.6 1.8 2.0 2.2 2.4 2.6 2.8 log(VMR), MOPITT
V6T: 400 hPa
r = 0.94 bias = -3.8 % sdev = 9.7 %
1.4 1.6 1.8 2.0 2.2 2.4 2.6 2.8 log(VMR), in-situ 1.4 1.6 1.8 2.0 2.2 2.4 2.6 2.8 log(VMR), MOPITT
V6T: 600 hPa
r = 0.93 bias = -4.8 % sdev = 11. %
1.4 1.6 1.8 2.0 2.2 2.4 2.6 2.8 log(VMR), in-situ 1.4 1.6 1.8 2.0 2.2 2.4 2.6 2.8 log(VMR), MOPITT
V6T: 800 hPa
r = 0.95 bias = -2.0 % sdev = 9.9 %
1.4 1.6 1.8 2.0 2.2 2.4 2.6 2.8 log(VMR), in-situ 1.4 1.6 1.8 2.0 2.2 2.4 2.6 2.8 log(VMR), MOPITT V6T: Surface
r = 0.97 bias = 0.7 % sdev = 7.9 %
0 1•1018 2•1018 3•1018 4•1018
CO total column, in-situ 0
1•1018
2•1018
3•1018
4•1018
CO colm, MOPITT
V6T: Column
r = 0.96 bias = -0.02 (1018
) sdev = 0.10 (1018
)
Figure 6. Scatterplots showing V6 TIR-only (V6T) validation re-sults based on HIPPO profiles. See caption to Fig. 3. Rere-sults for each of the five phases of HIPPO are color-coded as indicated in the top left panel.
3.2.1 V6 TIR-only
Figure 6 presents V6 TIR-only validation results for the HIPPO profiles. Results are also summarized in Table 3. Compared to the V5 TIR-only results, a clear improvement occurs at 200 hPa, where the bias decreased from 10 to 1.5 % and the correlation coefficient increased from 0.88 to 0.97. This improvement mirrors the comparison of V5 and V6 TIR-only products based on the NOAA aircraft profiles. In other respects, V6 TIR-only validation results are similar to V5. As indicated by the standard deviation values, ran-dom retrieval errors for the HIPPO validation profiles are generally smaller than for the NOAA profiles, especially for retrieved total column. This is likely the result of both greater CO homogeneity within the acceptance radius for the HIPPO profiles (due to the large distances between the oceanic locations of the in situ data and continental sources)
2000 2002 2004 2006 2008 2010 2012 2014 -0.4 -0.2 0.0 0.2 0.4 log(VMR) bias
Bias Drift = 0.78 +/- 0.10 %/yr V6T: 200 hPa
2000 2002 2004 2006 2008 2010 2012 2014 -0.4 -0.2 0.0 0.2 0.4 log(VMR) bias
Bias Drift = 0.70 +/- 0.14 %/yr V6T: 400 hPa
2000 2002 2004 2006 2008 2010 2012 2014 -0.4 -0.2 0.0 0.2 0.4 log(VMR) bias
Bias Drift = -0.35 +/- 0.12 %/yr V6T: 600 hPa
2000 2002 2004 2006 2008 2010 2012 2014 -0.4 -0.2 0.0 0.2 0.4 log(VMR) bias
Bias Drift = -0.57 +/- 0.11 %/yr V6T: 800 hPa
2000 2002 2004 2006 2008 2010 2012 2014 -0.4 -0.2 0.0 0.2 0.4 log(VMR) bias
Bias Drift = -0.16 +/- 0.11 %/yr V6T: Surface
2000 2002 2004 2006 2008 2010 2012 2014 -1.0
-0.5 0.0 0.5 1.0
CO total column bias
Drift = 0.003 +/- 0.001 (1018) mol/cm2/yr
V6T: Column
Figure 7. Time series plot showing V6 TIR-only (V6T) bias trends based on NOAA profiles.
and the statistical benefit of averaging many more individual retrievals for each overpass (due to the fourfold increase in acceptance radius).
4 Analysis
4.1 Long-term stability
2000 2002 2004 2006 2008 2010 2012 2014 -0.4 -0.2 0.0 0.2 0.4 log(VMR) bias
Bias Drift = -0.11 +/- 0.10 %/yr V6N: 200 hPa
2000 2002 2004 2006 2008 2010 2012 2014 -0.4 -0.2 0.0 0.2 0.4 log(VMR) bias
Bias Drift = -0.19 +/- 0.15 %/yr V6N: 400 hPa
2000 2002 2004 2006 2008 2010 2012 2014 -0.4 -0.2 0.0 0.2 0.4 log(VMR) bias
Bias Drift = -0.18 +/- 0.14 %/yr V6N: 600 hPa
2000 2002 2004 2006 2008 2010 2012 2014 -0.4 -0.2 0.0 0.2 0.4 log(VMR) bias
Bias Drift = -0.02 +/- 0.12 %/yr V6N: 800 hPa
2000 2002 2004 2006 2008 2010 2012 2014 -0.4 -0.2 0.0 0.2 0.4 log(VMR) bias
Bias Drift = -0.09 +/- 0.16 %/yr V6N: Surface
2000 2002 2004 2006 2008 2010 2012 2014 -1.0
-0.5 0.0 0.5 1.0
CO total column bias
Drift = -0.002 +/- 0.003 (1018) mol/cm2/yr
V6N: Column
Figure 8. Time series plot showing V6 NIR-only (V6N) bias trends based on NOAA profiles.
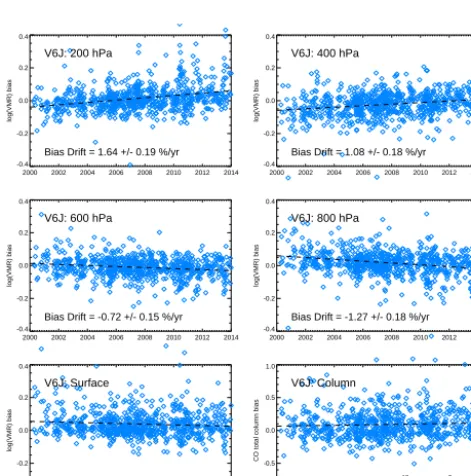
2000 2002 2004 2006 2008 2010 2012 2014 -0.4 -0.2 0.0 0.2 0.4 log(VMR) bias
Bias Drift = 1.64 +/- 0.19 %/yr V6J: 200 hPa
2000 2002 2004 2006 2008 2010 2012 2014 -0.4 -0.2 0.0 0.2 0.4 log(VMR) bias
Bias Drift = 1.08 +/- 0.18 %/yr V6J: 400 hPa
2000 2002 2004 2006 2008 2010 2012 2014 -0.4 -0.2 0.0 0.2 0.4 log(VMR) bias
Bias Drift = -0.72 +/- 0.15 %/yr V6J: 600 hPa
2000 2002 2004 2006 2008 2010 2012 2014 -0.4 -0.2 0.0 0.2 0.4 log(VMR) bias
Bias Drift = -1.27 +/- 0.18 %/yr V6J: 800 hPa
2000 2002 2004 2006 2008 2010 2012 2014 -0.4 -0.2 0.0 0.2 0.4 log(VMR) bias
Bias Drift = -0.48 +/- 0.20 %/yr V6J: Surface
2000 2002 2004 2006 2008 2010 2012 2014 -1.0
-0.5 0.0 0.5 1.0
CO total column bias
Drift = 0.003 +/- 0.002 (1018) mol/cm2/yr
V6J: Column
Figure 9. Time series plot showing V6 TIR/NIR (V6J) bias trends based on NOAA profiles.
and is listed in each panel and in Table 2, along with bias drift results for the V5 TIR-only product. Bias drift results for the V6 TIR-only product are mostly similar to V5 results. For both products, statistically significant positive bias drifts (i.e., bias drift values greater than the 1σ uncertainty) are evident in the upper troposphere and opposing negative bias drifts are observed in the middle troposphere. Bias drifts are
-0.3 -0.2 -0.1 0.0 0.1 0.2 0.3 log(VMR) Error -90 -60 -30 0 30 60 90 Latitude
V6T: 200 hPa H1 H2 H3 H4 H5
-0.3 -0.2 -0.1 0.0 0.1 0.2 0.3 log(VMR) Error -90 -60 -30 0 30 60 90 Latitude
V6T: 400 hPa
-0.3 -0.2 -0.1 0.0 0.1 0.2 0.3 log(VMR) Error -90 -60 -30 0 30 60 90 Latitude
V6T: 600 hPa
-0.3 -0.2 -0.1 0.0 0.1 0.2 0.3 log(VMR) Error -90 -60 -30 0 30 60 90 Latitude
V6T: 800 hPa
-0.3 -0.2 -0.1 0.0 0.1 0.2 0.3 log(VMR) Error -90 -60 -30 0 30 60 90 Latitude V6T: Surface
-6•1017 -4•1017 -2•1017 0 2•1017 4•1017 6•1017
Total Column Error -90 -60 -30 0 30 60 90 Latitude V6T: Column
Figure 10. Latitudinal dependence of MOPITT V6 TIR-only (V6T) retrieval biases based on HIPPO profiles. Large black diamonds and error bars indicate mean biases and standard deviations within each 30◦wide latitudinal zone.
slightly smaller (in absolute value) for V6 compared to V5, except at the surface, where the V6 bias drift is almost negli-gible. Total column bias drift is nearly negligible for both the V5 and V6 TIR-only products.
Bias drift time series for the V6 NIR-only and TIR/NIR products are shown in Figs. 8 and 9 and summarized in Ta-ble 2. For the V6 NIR-only product, the bias drift is less than 0.2 % yr−1at all levels; this is similar to the bias drift for the V5 NIR-only product. Bias drift for the V6 TIR/NIR product varies from−1.3 % yr−1at 800 hPa to 1.6 % yr−1at 200 hPa. Compared to the V5 TIR/NIR product, the bias drift is im-proved at 200 and 400hPa but is otherwise similar. Total col-umn bias drift for both the V5 and V6 TIR/NIR products is nearly negligible.
Since bias drift is significant in both the lower and upper troposphere, analyses of long-term CO trends at these levels should explicitly account for bias drift. Bias drift evident in V5 and V6 products could be the result of some type of in-strumental degradation, changing biases in the meteorolog-ical data (NCEP and MERRA), both, or neither. Since bias drift has only been analyzed using the NOAA profile set, it is unknown whether the bias drift varies geographically.
4.2 Geographical variability
biases (retrieved values minus simulated values) calculated with the HIPPO in situ profiles are plotted versus latitude in Fig. 10. The large black diamonds and error bars in each panel indicate bias statistics (mean and standard deviation) calculated over each 30◦ wide latitudinal zone. As noted above, V5 TIR-only validation results exhibited a strong lat-itude dependence in the retrieval bias at 200hPa, with bi-ases of about 25 % in the tropics. In contrast, the maximum retrieval bias in log(VMR) at 200 hPa in the V6 results is less than 0.04, which is equivalent to about 10 %. V6 re-sults for other retrieval levels are similar to V5 rere-sults, with log(VMR) biases at all levels and all latitudes generally less than 0.05. Possible causes of the latitude dependence of the retrieval bias have not been investigated.
5 Conclusions
The new features incorporated into the MOPITT V6 product will be relevant to some but likely not all users of MOPITT products. The improved geolocation data will clearly bene-fit analyses of CO variability on fine spatial scales, including studies of urban pollution. The reduced retrieval bias in the upper troposphere should aid studies of trace gas variability in the UTLS (upper troposphere/lower stratosphere) region. The use of a new CO climatology based on CAM-chem sim-ulations for 2000–2009 should result in better background CO concentrations, especially near source regions. Finally, V6 retrieval processing exploits MERRA reanalysis as the source of meteorological data, offering improved spatial res-olution for atmospheric variables and a more physically ap-propriate source for surface skin temperature.
Acknowledgements. Matthieu Pommier, at the Air Quality Re-search Division of Environment Canada (and now at the Pierre Simon Laplace Institute), was instrumental in helping to identify and correct the geolocation bias. The NCAR MOPITT project is supported by the National Aeronautics and Space Administration (NASA) Earth Observing System (EOS) Program. The National Center for Atmospheric Research (NCAR) is sponsored by the National Science Foundation.
Edited by: J.-L. Attie
References
Deeter, M. N.: MOPITT Geolocation Bias Analysis and Cor-rections, National Center for Atmospheric Research, Boulder, Colorado, United States, available at: http://web3.acd.ucar.edu/ mopitt/GeolocationBiasReport.pdf (last access: 7 June 2012), 2012.
Deeter, M. N., Emmons, L. K., Francis, G. L., Edwards, D. P., Gille, J. C., Warner, J. X., Khattatov, B., Ziskin, D., Lamarque, J.-F., Ho, S.-P., Yudin, V., Attie, J.-L., Packman, D., Chen, J., Mao, D., Drummond, J. R., Novelli, P., and Sachse, G.: Evaluation of op-erational radiances for the Measurements of Pollution in the
Tro-posphere (MOPITT) instrument CO thermal band channels, J. Geophys. Res., 109, D03308, doi:10.1029/2003JD003970, 2004. Deeter, M. N., Edwards, D. P., and Gille, J. C.: Retrievals of carbon monoxide profiles from MOPITT observations using lognormal a priori statistics, J. Geophys. Res., 112, D11311, doi:10.1029/2006JD007999, 2007.
Deeter, M. N., Edwards, D. P., Gille, J. C., and Drummond, J. C.: CO retrievals based on MOPITT near-infrared observations, J. Geophys. Res., 114, D04303, doi:10.1029/2008JD010872, 2009. Deeter,M. N., Edwards, D. P., Gille, J. C., Emmons, L. K., Francis, G., Ho, S.-P., Mao, D., Masters, D., Worden, H., Drummond, J. R., and Novelli, P. C.: The MOPITT version 4 CO product: Algorithm enhancements, validation, and long-term stability, J. Geophys. Res., 115, D07306, doi:10.1029/2009JD013005, 2010. Deeter, M. N., Martínez-Alonso, S., Edwards, D. P., Emmons, L. K., Gille, J. C., Worden, H. M., Pittman, J. V., Daube, B. C., and Wofsy, S. C.: Validation of MOPITT Version 5 thermal-infrared, near-thermal-infrared, and multispectral carbon monoxide pro-file retrievals for 2000–2011, J. Geophys. Res., 118, 6710–6725, doi:10.1002/jgrd.50272, 2013.
James R. Drummond, J. Zou, F. Nichitiu, J. Kar, R. Descham-baut, and J. Hackett,: A review of 9-year performance and oper-ation of the MOPITT instrument, Adv. Space Res., 45, 760–774, doi:10.1016/j.asr.2009.11.019, 2010.
Emmons,L. K., Deeter, M. N., Gille, J. C., Edwards, D. P., At-tié, J.-L., Warner, J., Ziskin, D., Francis, G., Khattatov, B., Yudin, V., Lamarque, J.-F., Ho, S.-P., Mao, D., Chen, J. S., Drummond, J., Novelli, P., Sachse, G., Coffey, M. T., Hanni-gan, J. W., Gerbig, C., Kawakami, S., Kondo, Y., Takegawa, N., Schlager, H., Baehr, J., and Ziereis, H.: Validation of Measure-ments of Pollution in the Troposphere (MOPITT) CO retrievals with aircraft in situ profiles, J. Geophys. Res., 109, D03309, doi:10.1029/2003JD004101, 2004.
Emmons, L. K., Edwards, D. P., Deeter, M. N., Gille, J. C., Cam-pos, T., Nédélec, P., Novelli, P., and Sachse, G.: Measurements of Pollution In The Troposphere (MOPITT) validation through 2006, Atmos. Chem. Phys., 9, 1795–1803, doi:10.5194/acp-9-1795-2009, 2009.
Emmons, L. K., Walters, S., Hess, P. G., Lamarque, J.-F., Pfister, G. G., Fillmore, D., Granier, C., Guenther, A., Kinnison, D., Laepple, T., Orlando, J., Tie, X., Tyndall, G., Wiedinmyer, C., Baughcum, S. L., and Kloster, S.: Description and evaluation of the Model for Ozone and Related chemical Tracers, version 4 (MOZART-4), Geosci. Model Dev., 3, 43–67, doi:10.5194/gmd-3-43-2010, 2010.
Lamarque, J.-F., Emmons, L. K., Hess, P. G., Kinnison, D. E., Tilmes, S., Vitt, F., Heald, C. L., Holland, E. A., Lauritzen, P. H., Neu, J., Orlando, J. J., Rasch, P. J., and Tyndall, G. K.: CAM-chem: description and evaluation of interactive at-mospheric chemistry in the Community Earth System Model, Geosci. Model Dev., 5, 369–411, doi:10.5194/gmd-5-369-2012, 2012.
Pan, L., Gille, J., Edwards, D. P., Bailey, P. L., and Rodgers, C. D.: Retrieval of tropospheric carbon monoxide for the MOPITT instrument, J. Geophys. Res., 103, 32277–32290, 1998. Rienecker, M. M., Suarez, M. J., Gelaro, R., Todling, R.,
A., Owens, T., Pawson, S., Pegion, P., Redder, C. R., Reichle, R., Robertson, F. R., Ruddick, A. G., Sienkiewicz, M., and Woollen, J.: MERRA: NASA’s Modern-Era Retrospective Anal-ysis for Research and Applications, J. Climate, 24, 3624–3648, doi:10.1175/JCLI-D-11-00015.1, 2011.
Rodgers, C. D.: Inverse Methods for Atmospheric Sounding, The-ory and Practice, World Scientific, Singapore, 2000.
Santoni, G. W., Daube, B. C., Kort, E. A., Jiménez, R., Park, S., Pittman, J. V., Gottlieb, E., Xiang, B., Zahniser, M. S., Nelson, D. D., McManus, J. B., Peischl, J., Ryerson, T. B., Holloway, J. S., Andrews, A. E., Sweeney, C., Hall, B., Hintsa, E. J., Moore, F. L., Elkins, J. W., Hurst, D. F., Stephens, B. B., Bent, J., and Wofsy, S. C.: Evaluation of the airborne quantum cascade laser spectrometer (QCLS) measurements of the carbon and green-house gas suite – CO2, CH4, N2O, and CO – during the
Cal-Nex and HIPPO campaigns, Atmos. Meas. Tech., 7, 1509–1526, doi:10.5194/amt-7-1509-2014, 2014.
Shindell,D. T., Faluvegi, G., Stevenson, D. S., Krol, M. C., Em-mons, L. K., Lamarque, J.-F., Pétron, G., Dentener, F. J., Ellingsen, K., Schultz, M. G., Wild, O., Amann, M., Atherton, C. S., Bergmann, D. J., Bey, I., Butler, T., Cofala, J., Collins, W. J., Derwent, R. G., Doherty, R. M., Drevet, J., Eskes, H. J., Fiore, A. M., Gauss, M., Hauglustaine, D. A., Horowitz, L. W., Isaksen, I. S. A., Lawrence, M. G., Montanaro, V., Müller, J.-F., Pitari, G., Prather, M. J., Pyle, J. A., Rast, S., Rodriguez, J. M., Sanderson, M. G., Savage, N. H., Strahan, S. E., Sudo, K., Szopa, S., Unger, N., van Noije, T. P. C., and Zeng, G.: Multimodel sim-ulations of carbon monoxide: Comparison with observations and projected near-future changes, J. Geophys. Res., 111, D19306, doi:10.1029/2006JD007100, 2006.
Wofsy, S. C. and the HIPPO Science Team and Cooperating Mod-ellers and Satellite Teams: HIAPER Pole-to-Pole Observations (HIPPO): fine-grained, global-scale measurements of climati-cally important atmospheric gases and aerosols, Philos. T. Roy. Soc. A, 369, 2073–2086, doi:10.1098/rsta.2010.0313, 2011. Worden, H. M., Deeter, M. N., Frankenberg, C., George, M.,
Nichi-tiu, F., Worden, J., Aben, I., Bowman, K. W., Clerbaux, C., Co-heur, P. F., de Laat, A. T. J., Detweiler, R., Drummond, J. R., Edwards, D. P., Gille, J. C., Hurtmans, D., Luo, M., Martínez-Alonso, S., Massie, S., Pfister, G., and Warner, J. X.: Decadal record of satellite carbon monoxide observations, Atmos. Chem. Phys., 13, 837–850, doi:10.5194/acp-13-837-2013, 2013. Worden, H. M., Deeter, M. N., Edwards, D. P., Gille, J., Drummond,