www.solid-earth.net/3/375/2012/ doi:10.5194/se-3-375-2012
© Author(s) 2012. CC Attribution 3.0 License.
Solid Earth
Organic carbon stocks in Mediterranean soil types under different
land uses (Southern Spain)
M. Mu ˜noz-Rojas1,2,*, A. Jord´an2, L. M. Zavala2, D. De la Rosa3, S. K. Abd-Elmabod3,4, and M. Anaya-Romero1
1Evenor-Tech, CSIC Spin-off, Instituto de Recursos Naturales y Agrobiolog´ıa de Sevilla (CSIC), Seville, Spain 2MED Soil Research Group. Dpto. de Cristalograf´ıa, Mineralog´ıa y Qu´ımica Agr´ıcola, Facultad de Qu´ımica
(Universidad de Sevilla), Seville, Spain
3Instituto de Recursos Naturales y Agrobiolog´ıa de Sevilla (CSIC), Seville, Spain 4Department of Soil and Water Use. National Research Centre, Cairo, Egypt
*Invited contribution by M. Mu˜noz-Rojas, recipient of the EGU Outstanding Student Poster (OSP) Award 2012.
Correspondence to: M. Mu˜noz-Rojas (miriammunozrojas@gmail.com)
Received: 18 July 2012 – Published in Solid Earth Discuss.: 21 August 2012
Revised: 30 October 2012 – Accepted: 31 October 2012 – Published: 23 November 2012
Abstract. Soil C sequestration through changes in land use and management is one of the sustainable and long-term strategies to mitigate climate change. This research explores and quantifies the role of soil and land use as determinants of the ability of soils to store C along Mediterranean systems. Detailed studies of soil organic C (SOC) dynamics are nec-essary in order to identify factors determining fluctuations and intensity of changes. In this study, SOC contents from different soil and land use types have been investigated in Andalusia (Southern Spain). We have used soil information from different databases, as well as land use digital maps, climate databases and digital elevation models. The aver-age SOC content for each soil control section (0–25, 25–50 and 50–75 cm) was determined and SOC stocks were cal-culated for each combination of soil and land use type, us-ing soil and land cover maps. The total organic C stocks in soils of Andalusia is 415 Tg for the upper 75 cm, with av-erage values ranging from 15.9 Mg C ha−1 (Solonchaks
un-der “arable land”) to 107.6 Mg C ha−1(Fluvisols from
“wet-lands”). Up to 55 % of SOC accumulates in the top 25 cm of soil (229.7 Tg). This research constitutes a preliminary as-sessment for modelling SOC stock under scenarios of land use and climate change.
1 Introduction
Soil organic C (SOC) plays an important role in the global C cycle. It is generally assumed that soils are the largest C sinks in terrestrial ecosystems. Soils act as a source or a sink of at-mospheric CO2and contain approximately twice the amount
of C in the atmosphere, and about three times the amount in vegetation (IPCC, 2000, 2007; Lal, 2004). Soils have the ability to store C for long periods of time; thus, changes in the size of the soil C pool could significantly modify the atmo-spheric CO2 concentration. Additionally, an adequate level
of SOC stock is essential to decrease erosion and degrada-tion risks, hold water and nutrients and improve soil structure (Lal, 2004).
Carbon sequestration is a crucial strategy for reduc-ing atmospheric CO2 concentration, contributing to climate
change mitigation (Lal, 2003). Globally, soil C pools con-tain approximately 1550 Gt of organic C in the top 1 m (from a total of approximately 2500 Gt C), and SOC sequestration is estimated at 0.4 to 1.2 Pg C yr−1, equivalent to 6–20 % of
the annual release from fossil fuel combustion (Lal, 2004; Houghton, 2005).
increased due to the importance of SOC stocks for sustain-able use of natural resources.
In addition to the present concern about environmental problems, such as soil degradation and soil contamination, information on SOC stocks is necessary to assess the poten-tial role of soils as CO2sinks. Reports of national
invento-ries of C stocks are required under the Kyoto Protocol by the United Nations Framework Convention on Climate Change (e.g. MARM, 2011), to estimate C emissions to the atmo-sphere, which requires accurate and reliable estimates of cur-rent C stocks. Carbon inventories and analysis of SOC distri-bution constitute an essential tool for modelling the effects of different factors involved in SOC sequestration potential.
SOC pools at global scales are difficult to assess due to high spatial variability and different factors affecting soil C dynamics. Among these factors, land use has a strong influ-ence on SOC stocks (Liebens and VanMolle, 2003; Meers-mans et al., 2008; Smith, 2008), altering the balance between C losses and sequestration (Ostle et al., 2009). Nevertheless, there are further determinants influencing SOC variability, such as climate and topography (Schulp et al., 2008; Pha-chomphon et al., 2010). Consequently, SOC estimates are commonly uncertain in areas with heterogeneous land uses and a high variety of climate and site patterns (Leifield et al., 2005) such as the Mediterranean environments. At the same time, soil depth has an important influence on SOC stocks (Gr¨uneberg et al., 2010). Most studies on SOC are restricted to the topsoil, although vertical processes have a consider-able effect on SOC variability (VandenBygaart, 2006). The few existing studies that compare the dynamics of SOC in the upper horizons and the subsurface, suggest a variation in depth of factors controlling SOC dynamics, a hypothesis that has not yet been thoroughly investigated (Salome et al., 2010; Albadalejo et al., 2011). Vertical distribution is one of the features of the organic C pool that is not clearly understood together with the relationships with climate and vegetation (Jobb´agy and Jackson, 2000).
Several studies have estimated SOC stocks on a large scale by using national and global soil maps and a certain amount of representative soil profiles, or by combining soil and land cover spatial data sets (Batjes, 1996, 2005; Batjes and Dijk-shoorn, 1999; Arrouays et al., 2001; Morisada et al., 2004; Bradley et al., 2005; Leifeld et al., 2005). Commonly, inven-tories are based on a combination of soil land use mapping units and assignment of mean SOC values from soil profiles, which makes it possible to determine patterns in SOC vari-ability related to soil and land use features. However, the re-liability of these estimates depends upon the quality and res-olution of the land use and soil spatial databases. Moreover, due to the large spatial variability of SOC within the map units, an elevated density of soil sampling points is required to achieve accurate estimates (Liebens and VanMolle, 2003; Martin et al., 2011).
According to Bahn et al. (2009), a key item in future re-search in the terrestrial C cycle is an accurate assessment of
SOC pool in ecosystems and regions that have so far been heavily under-represented. Whereas the SOC pool has been studied at global, continental (Eswaran et al., 1993; Liski et al., 2002; Smith, 2004) or regional scales in humid forest systems (Batjes and Dijkshoorn, 1999; Schwartz and Namri, 2002), there is a lack of information on Mediterranean sys-tems. In addition, estimates of SOC stocks may be partic-ularly inaccurate in areas with diverse land use patterns, such as Mediterranean landscapes. In Spain, for example, Rodr´ıguez-Murillo (2001) assessed organic C contents under different types of land use and soil. Nevertheless, there are few studies providing accurate regional SOC estimates based on combined studies of soil land cover data. In general, there is a lack of national-scale studies on soil spatial variability in Spain (Ib´a˜nez et al., 2005) and therefore detailed studies on SOC distribution in soils are necessary (Flores et al., 2007). Future studies on SOC pools need to be carried out in a com-parable way, and the access to data sets needs to be facilitated (Bahn et al., 2009). This study comes to fill a gap in SOC as-sessment in Mediterranean soils.
The objectives of this study are (1) to quantify current SOC contents and SOC stocks in Andalusia (Southern Spain) for each land use and soil type at different soil depths, (2) to assess possible relationships between SOC stocks and envi-ronmental variables, and (3) to elaborate a SOC map of the studied area.
This research is part of a global project for developing a land evaluation tool for predicting SOC pool under scenarios of land use and climate change, as a new component of the MicroLEIS Decision Support System (Anaya-Romero et al., 2011; De la Rosa et al., 2004).
The Mediterranean area represents an important challenge to scientists and land managers because of its size, physical complexity, geological and anthropological history (Blondel and Aronson, 1995). The information generated in this study will be a useful basis for modelling SOC processes and de-signing of management strategies for stabilizing the increas-ing atmospheric CO2 concentrations by preservation of C
stocks and sequestration in other Mediterranean regions.
2 Materials and methods 2.1 Study area
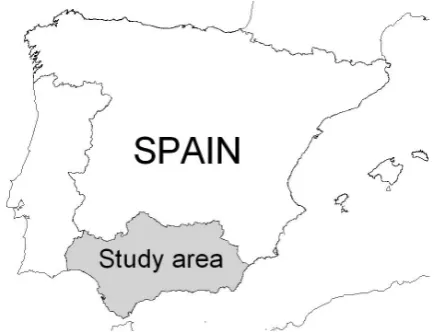
Fig. 1. Study area.
Peak). According to CSIC-IARA (1989), the main soil ref-erence groups are Cambisols, Leptosols, Luvisols, Regosols, and Vertisols.
Most of the natural vegetation is Mediterranean forest, pre-dominantly evergreen trees such as oaks, pines and firs, with dense riparian forests and Mediterranean shrubland. Cur-rently, 45.7 % and 9.6 % of soil is dedicated to farm uses and grasslands, respectively. Agriculture in Andalusia has traditionally been based on wheat crops, olive trees and vine-yards. In recent decades, traditional crops have been substi-tuted with intensive and extensive crops (e.g. rice, sugar beet, cotton and sunflower). Likewise, intensive greenhouse crops under plastic have spread through some areas. In the coastal area the decline of traditional crops has been imposed mainly by massive urbanisation and tourist infrastructures.
2.2 Origin of data and treatment 2.2.1 Soil data
Data from 1479 geo-referenced selected soil profiles re-ported and described by Jord´an and Zavala (2009) and the SEISnet soil database (http://www.evenor-tech.com/banco/ seisnet/seisnet.htm) distributed through the study area have been used to estimate SOC content. These databases contain descriptive and analytical data, including site characteristics, horizon description, chemical and physical analysis. Selec-tion of soil profiles was carried out considering homogeneous sampling and analysis methods.
Variables used in this study were soil depth (cm), organic C content (g 100 g−1soil), bulk density (g cm−3)and coarse fragments (mineral particles>2 mm in diameter; g 100 g−1). Soil types were described and classified according to FAO (2006). Organic C was determined by dichromate oxidation using the Walkley-Black method (Walkley and Black, 1934). Bulk density was measured by the core method (Blake and Hartge, 1986).
In order to normalise information from soil profiles, data were re-coded and imported to the SDBm Plus Multilingual Soil Profile Database, a geo-referenced soil attribute database that contains a large number of descriptive and analytical data fields (De la Rosa et al., 2002). As soil profiles showed a range of depths, data were homogenised and re-sampled for 0–25, 25–50 and 50–75 cm. The SDBM Plus database incor-porates a “control section” function, which allows determin-ing the thickness of the layer to be analysed within the soil profile. This function allows calculating the weighted aver-age value for each variable in standard control sections.
The spatialisation of soil data was carried out following the spatial distribution of soil classes from the Soil Map of An-dalusia (CSIC-IARA, 1989) at scale 1 : 400 000, which con-tains 2707 polygons classified in 64 soil map units, accord-ing to the legend of the soil map of the world (IUSS Workaccord-ing Group WRB, 2006).
2.2.2 Climate data
Climate data were obtained from the time series of the CLIMA subsystem of the Environmental Information Net-work of Andalusia (REDIAM, Andalusian Regional Govern-ment) which integrates several databases from a set of over 2200 observatories since 1971. Selected variables were mean monthly temperature and mean annual precipitation. 2.2.3 Elevation and slope
Elevation and slope data were extracted from the 100 m res-olution digital elevation model (DEM) of Andalusia (ICA, 1999) derived from the topographic map of Andalusia (S 1 : 10 000).
2.2.4 Land use and land cover data
Land use classification and land cover data for this study were taken from the Land Use and Land Cover Map of An-dalusia (LULCMA) for 2007 at scale 1 : 25 000 and min-imum map unit 0.5 ha (Moreira, 2007). This digital spa-tial data set, obtained after the analysis of satellite images (Landsat TM, IRS/PAN and SPOT-5) and digital aerial pho-tographs, is a result of the Coordination of Information on the Environment (CORINE) programme, promoted by the Euro-pean Commission in 1985 for the assessment of environmen-tal quality in Europe.
standard nomenclatures, in order to make the methodology available for other CORINE programme member countries and obtain easily comparable results (Mu˜noz-Rojas et al., 2011).
The standard CLC nomenclature includes 44 land cover classes, grouped in a three-level hierarchy. The 5 main classes (level 1) describe land patterns for use on a planet scale, comprising the following categories: (1) “Artificial surfaces”, (2) “Agricultural areas”, (3) “forests” and semi-natural areas”, (4) “Wetlands”, and (5) “Water bodies” (Hey-mann et al., 1994). Level 2 (15 classes) corresponds to physical and physiognomic entities at scales 1 : 500 000 and 1 : 1 000 000 (“Urban zones”, “forests”, “Lakes”, etc.). Fi-nally, level 3 is composed of acutely defined 44 classes for use on scale 1 : 100 000 and higher (“Residential areas”, “Airport”, “Commercial areas”, etc.). All national working groups adopted this standard nomenclature, although it has been improved over the years by introducing local sub-classes.
2.3 Soil organic C stock calculation
For each soil layer (0–25, 25–50 and 50–75 cm) of the 1479 soil profiles, soil organic C content (SOCC) was estimated as follows:
SOCC=SOC×BD×D×(1−G) (1)
where SOCC is soil organic C content (Mg ha−1), SOC is soil organic C percentage (g 100−1g−1), BD is bulk den-sity (g cm−3),D is the thickness of the studied layer (cm)
and G is the proportion in volume of coarse fragments (g 100 g−1). Equivalent approaches at different scales were
used by Rodr´ıguez-Murillo (2001) in peninsular Spain and by Boix-Fayos et al. (2009) in Murcia (SE Spain). Soil pro-files were classified according to original soil profile descrip-tions, into 10 soil reference groups (IUSS Working Group WRB, 2006): Arenosols, Calcisols, Cambisols, Fluvisols, Leptosols, Luvisols, Planosols, Regosols, Solonchaks and Vertisols, and 7 land use types (following CLC nomencla-ture at level 2: “arable land”, “permanent crops”, “heteroge-neous agricultural areas”, “forest”, “scrub and/or vegetation associations”, “open spaces with little or no vegetation”, and “maritime wetlands”).
Data analysis was performed using SPSS (SPSS, 2009) and ArcGIS (ESRI, 2006) software packs. To determine SOC for each soil class within every land cover type, the study area was divided into “land use soil association units” (land-scape units) using a topological intersection of the LULCMA for 2007 and the Soil Map of Andalusia. The overlay of both maps resulted in 85 492 new polygons, defined by 1 soil class (dominant unit) and one aggregated land cover type.
Mean values of SOCC of each land use soil class was as-signed to all the new polygons. Soil organic C stocks for each soil class were determined by multiplying SOCC mean
val-ues by the area occupied by the land use soil unit in the over-lay map.
2.4 Relationships between soil organic C content and environmental variables
In order to identify the influence of environmental fac-tors (climate and site facfac-tors) on SOC, correlation analyses were performed using Statistica (StatSoft, 2001). The fol-lowing variables were considered: mean annual precipita-tion (mm), mean winter (December–February) and summer (June–August), temperature, elevation and slope. Analyses were carried out for the total set of soil profiles, and for different soil types and land use classes. A number of soil profiles, classified as Planosols, Solonchaks and soils from “maritime wetlands” were not considered in the analysis be-cause of the absence of SOC variation with environmental variables.
Elevation and slope data for each profile were extracted from the DEM, and climate variables (mean annual rainfall and mean summer and winter temperature), were obtained from the climate spatial data sets in raster format. Data anal-ysis was performed using ArcGIS spatial analyst extension tool (ESRI, 2006).
3 Results
3.1 Soil organic C contents from main land use and soil types
The total area of soils under “arable land”, “permanent crops”, “heterogeneous agricultural area”, “forest”, “scrub and/or vegetation associations”, “open spaces with little or no vegetation”, and “maritime wetlands”, identified using the Soil Map of Andalusia and LULCMA, was 83 686.74 km2 (Table 1). Ten major soil groups occur in the study area. Cambisols (42.7 % of the studied area) and Regosols (19.7 %) are most common, followed by Vertisols (8.8 %), Leptosols (8.6 %), and Luvisols (8.3 %). These five major groups account for about 73 744.74 km2(88.1 % of the stud-ied area).
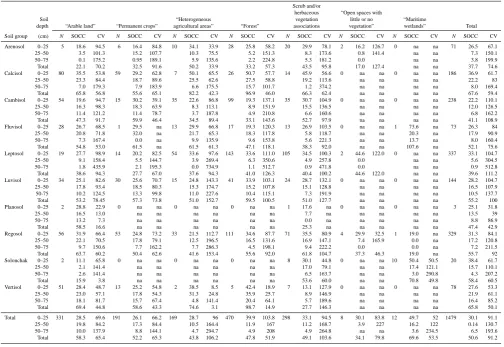
Soil organic C content (SOCC) and coefficient of varia-tion (CV) were calculated for each land use and soil type combination/association in the study area (Table 2). Values are shown for 0–25, 25–50, 50–75 and 0–75 cm depths.
On average, Calcisols, Regosols and Solonchaks have the highest SOCC values, above 55 Mg C ha−1while Arenosols
and Leptosols show the lowest amounts, below 40 Mg C ha−1
(Table 2, Fig. 2). Likewise, SOCC is considerably lower in “open spaces with little or no vegetation” compared to the other land use types, and “maritime wetlands” have the high-est SOCC of all land use classes (Table 2, Fig. 3).
Table 1. Area (km2) and SOC stocks (SOC stock, Tg) under main land uses types and soil groups.
Scrub and/or
herbaceous “Open spaces with
“Heterogeneous vegetation little or no “Maritime
“Arable land” “Permanent crops” agricultural areas” “Forest” associations vegetation” wetlands” Total
Soil group Area SOCS Area SOCS Area SOCS Area SOCS Area SOCS Area SOCS Area SOCS Area SOCS
Arenosol 75.00 0.22 19.23 0.06 17.66 0.09 158.95 0.53 150.77 0.66 12.40 0.02 43.10 0.00 477.12 1.57 Calcisol 418.44 2.75 118.92 0.66 323.62 2.66 35.34 0.34 823.90 5.46 15.52 0.00 1.66 0.00 1737.40 11.88 Cambisol 4513.96 21.33 7296.52 43.69 6351.18 21.93 7990.29 26.41 9352.92 49.30 205.01 0.00 16.21 0.00 35726.09 162.66 Fluvisol 1454.13 7.97 961.37 5.91 613.15 3.77 435.89 2.05 775.91 2.97 23.49 0.00 65.62 0.71 4329.57 23.39 Leptosol 255.75 0.99 542.77 1.50 352.12 1.32 1755.01 7.19 4175.28 16.87 91.67 0.41 0.00 0.00 7172.58 28.29 Luvisol 1522.38 8.09 2389.15 13.69 866.75 4.42 982.42 5.84 1193.73 6.09 20.50 0.00 8.81 0.00 6983.74 38.13 Planosol 722.15 4.22 416.67 0.00 171.06 0.00 374.67 0.00 206.29 0.52 9.20 0.00 16.15 0.00 1916.20 4.74 Regosol 2040.71 12.99 3888.70 19.58 1637.16 6.81 3616.00 20.09 5150.77 31.85 152.03 0.57 32.81 0.06 16518.18 91.95 Solonchak 923.80 1.46 11.89 0.00 80.23 0.00 42.91 0.00 64.12 0.34 17.39 0.00 341.36 2.42 1481.70 4.22 Vertisol 3542.16 24.57 1630.43 9.55 973.77 7.26 519.88 5.13 668.29 1.85 8.23 0.00 1.39 0.00 7344.15 48.37 Total 15468.49 84.59 17275.66 94.65 11386.70 48.27 15911.37 67.60 22561.98 115.92 555.43 1.00 527.12 3.19 83686.74 415.21
Table 2. Carbon stocks for land use soil combinations at different soil depths (0–25, 25–50 and 0–75 m) (Mg ha−1).N: number of values, SOCC: Soil organic C content, CV: coefficient of variation, na: insufficient number of samples to provide statistics (not available).
Scrub and/or
herbaceous “Open spaces with
Soil “Heterogeneous vegetation little or no “Maritime
depth “Arable land” “Permanent crops” agricultural areas” “Forest” associations vegetation” wetlands” Total
Soil group (cm) N SOCC CV N SOCC CV N SOCC CV N SOCC CV N SOCC CV N SOCC CV N SOCC CV N SOCC CV Arenosol 0–25 5 18.6 94.5 6 16.4 84.8 10 34.1 33.9 28 25.8 58.2 20 29.9 78.1 2 16.2 126.7 0 na na 71 26.5 67.1 25–50 3.5 101.3 15.2 107.7 10.3 75.5 5.2 151.3 8.3 173.6 0.8 141.4 na na 7.3 150.1 50–75 0.1 175.2 0.95 189.1 5.9 135.6 2.2 224.8 5.3 181.2 0.0 na na 3.8 199.9 Total 22.1 70.2 32.5 91.6 50.2 33.9 33.2 57.3 43.5 95.8 17.0 127.4 na na 37.7 74.6 Calcisol 0–25 80 35.5 53.8 59 29.2 62.8 7 50.1 65.5 26 50.7 57.7 14 45.9 56.6 0 na na 0 na na 186 36.9 61.7 25–50 23.3 84.4 18.7 89.6 25.5 62.6 27.5 58.8 19.2 113.6 na na na na 22.2 83 50–75 7.0 179.3 7.9 183.9 6.6 175.5 15.7 101.7 1.2 374.2 na na na na 8.0 169.4 Total 65.8 56.8 55.6 65.1 82.2 42.3 96.9 46.0 66.3 62.4 na na na na 67.6 59.4 Cambisol 0–25 54 19.6 94.7 15 30.2 39.1 35 22.6 86.8 99 19.3 137.1 35 30.7 104.9 0 na na 0 na na 238 22.2 110.1 25–50 16.3 98.3 18.3 63.9 8.3 113.1 8.9 151.9 15.5 136.5 na na na na 12.0 126.5 50–75 11.4 121.2 11.4 78.7 3.7 187.8 4.9 210.8 6.6 160.6 na na na na 6.8 162.2 Total 47.3 91.7 59.9 46.4 34.5 89.4 33.1 143.6 52.7 97.9 na na na na 41.1 108.9 Fluvisol 0–25 28 26.7 68.5 1 29.5 na 13 29.9 66.8 17 19.3 120.3 13 26.9 103.5 0 na na 1 73.6 na 73 26.3 84 25–50 20.8 71.8 32.0 na 21.7 65.3 18.3 117.8 5.8 118.7 na na 20.3 na 17.9 90.9 50–75 7.3 167.4 0.0 na 9.9 135.9 9.6 153.8 5.6 221.3 na na 13.7 na 8.0 160.4 Total 54.8 53.0 61.5 na 61.5 61.3 47.1 118.1 38.3 92.0 na na 107.6 na 52.1 75.6 Leptosol 0–25 19 27.7 98.9 14 20.2 82.5 54 33.6 97.6 143 33.6 111.0 105 34.5 100.3 2 44.6 122.0 0 na na 337 33.1 104.7 25–50 9.1 158.4 5.5 144.7 3.9 269.4 6.3 350.6 4.9 257.8 0.0 na na 5.6 304.5 50–75 1.8 435.9 2.1 195.3 0.0 734.9 1.1 512.7 0.9 471.8 0.0 na na 0.9 512.8 Total 38.6 94.3 27.7 67.0 37.6 94.3 41.0 126.3 40.4 100.2 44.6 122.0 na na 39.6 111.2 Luvisol 0–25 34 25.1 82.6 30 25.6 70.7 15 24.8 143.3 41 33.9 103.1 24 28.7 132.1 0 na na 0 na na 144 28.2 104.7 25–50 17.8 93.4 18.5 80.3 15.3 174.7 15.2 107.8 15.1 128.8 na na na na 16.5 107.9 50-75 10.2 124.5 13.3 99.8 11.0 227.6 10.4 115.1 7.3 191.9 na na na na 10.5 137.7 Total 53.2 78.45 57.3 73.8 51.0 152.7 59.5 100.5 51.0 127.7 na na na na 55.2 100 Planosol 0–25 2 28.8 22.9 0 na na 0 na na 0 na na 1 17.6 na 0 na na 0 na na 3 25.1 31.8 25–50 16.5 13.0 na na na na na na 7.7 na na na na na 13.5 39 50–75 13.2 7.3 na na na na na na 0.0 na na na na na 8.8 86.9 Total 58.5 16.6 na na na na na na 25.3 na na na na na 47.4 42.9 Regosol 0–25 56 31.9 66.4 53 24.8 73.2 33 21.5 112.7 111 34.6 87.7 71 35.5 80.9 4 29.9 32.5 1 19.0 na 329 31.3 84.1 25–50 22.1 70.5 17.8 79.1 12.5 196.5 16.5 131.6 16.9 147.1 7.4 165.9 0.0 na 17.2 120.8 50–75 9.7 150.6 7.7 162.2 7.7 286.3 4.5 198.1 9.4 222.2 0.0 0.0 na 7.2 211.5 Total 63.7 60.2 50.4 62.6 41.6 153.4 55.6 92.0 61.8 104.7 37.3 46.3 19.0 na 55.7 92 Solonchak 0–25 2 11.1 65.8 0 na na 0 na na 0 na na 8 30.1 44.8 0 na na 10 50.4 50.5 20 38.4 61.7 25–50 2.1 141.4 na na na na na na 17.0 79.1 na na 17.4 121.1 15.7 110.1 50–75 2.6 141.4 na na na na na na 6.5 163.7 na na 3.0 290.8 4.3 207.2 Total 15.9 3.8 na na na na na na 53.6 60.0 na na 70.8 49.8 58.4 60.5 Vertisol 0–25 51 28.4 48.7 13 25.2 54.8 2 38.5 8.5 5 42.4 18.9 7 13.1 127.9 0 na na 0 na na 78 27.6 53.3 25–50 23.0 57.1 17.8 54.3 31.3 24.8 35.9 25.7 8.9 146.9 na na na na 21.9 61.1 50–75 18.1 81.7 15.7 67.4 4.8 141.4 20.4 64.1 5.7 189.6 na na na na 16.4 85.2 Total 69.4 44.8 58.6 43.3 74.6 3.1 98.7 14.9 27.7 146.3 na na na na 65.8 50.1
Total 0–25 331 28.5 69.6 191 26.1 66.2 169 28.7 96 470 39.9 103.8 298 33.1 94.5 8 30.1 83.8 12 49.7 52 1479 30.1 91.1 25–50 19.8 84.2 17.3 84.4 10.5 164.4 11.9 167 11.2 168.7 3.9 227 16.2 122 0.14 130.7 50–75 10.0 137.9 8.8 144.1 4.7 294.7 4.9 208 4.9 264.8 na na 3.6 234.5 6.5 193.6 Total 58.3 65.4 52.2 65.3 43.8 106.2 47.8 51.9 49.1 103.6 34.1 79.8 69.6 53.5 50.6 91.2
Calcisols under “heterogeneous agricultural areas” and “for-est” stored 50.1 and 50.7 Mg C ha−1, respectively. Solon-chaks under “arable land” and Vertisols under “Scrub and/or herbaceous vegetation associations”, have the lowest SOCC values, storing less than 14 Mg C ha−1. The average SOCC distribution with depth is similar in all land use soil class
Fig. 2. Soil organic carbon content (SOCC) for the major soil
groups in the study area. SD: standard deviation (0–75 cm).
Fig. 3. Soil organic carbon content (SOCC) for each land use type.
SD: standard deviation (0–75 cm).
soil groups with SOCC values above 27 Mg C ha−1 and 15 Mg C ha−1in the layers 25–50 cm and 50–75 cm.
Values of SOCC in the entire depth down to 75 cm range between 107.6 Mg C ha−1 for Fluvisols under
“mar-itime wetlands” and 15.9 Mg C ha−1 for Solonchaks under
“arable land”. A large variation in SOC exists within each land use soil class association with CV ranging between 3.8 % for Solonchaks under “arable land” and 152.7 % for Luvisols under “heterogeneous agricultural areas”.
3.2 SOC stocks from main land use and soil types Total stocks per land use class and soil type (in abso-lute terms) are given in Table 1. “Scrub and /or vege-tation associations” contain 115.92 Tg C in 22 561.98 km2, “permanent crops” 94.65 Tg C in 17 275.66 km2, “arable land” 84.59 Tg C in 15 468.49 km2 and “forest” 67.60 Tg C in 15 911.37 km2. Soils with the largest SOC stock are Cambisols (162.66 Tg), Regosols (91.95 Tg) and Vertisols (48.37 Tg).
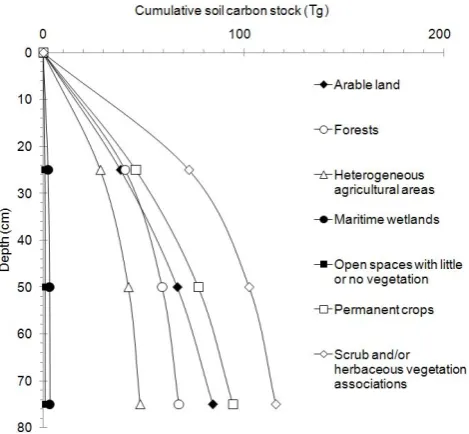
The estimated SOC stock in the upper 75 cm is 415 Tg (Ta-ble 1). Accumulated C stocks for each soil type and land use
Fig. 4. Cumulative soil organic carbon stock in depth for each soil
class.
Fig. 5. Cumulative soil organic carbon stock in depth for each land
use type.
class are shown in Figs. 4 and 5, respectively. All soil groups store more than 50 % of total C in the first 25 cm, except Vertisols which accumulates less than 45 %. The proportion of SOC stock in the 0–25 cm layer is on average about 55 % (229.69 Tg) of the total SOC stock in the upper 75 cm, around 30 % (122.89 Tg) in the 25–50 cm layer and 15 % (62.62 Tg) in the deepest layer (50–75 cm) (Figs. 4 and 5). Among all land use types, agricultural uses such as “arable land” and “permanent crops” show low percentages of SOC stock in the first layer (below 50 %).
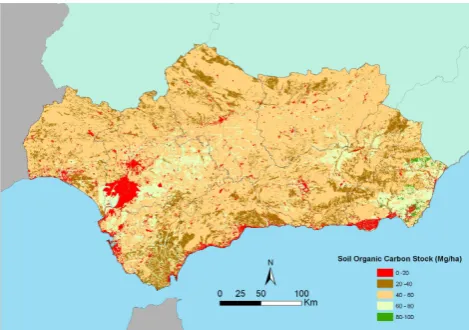
Fig. 6. Map of soil organic carbon content (0–75 cm) in Andalusia.
3.3 Relationships between SOC and environmental data
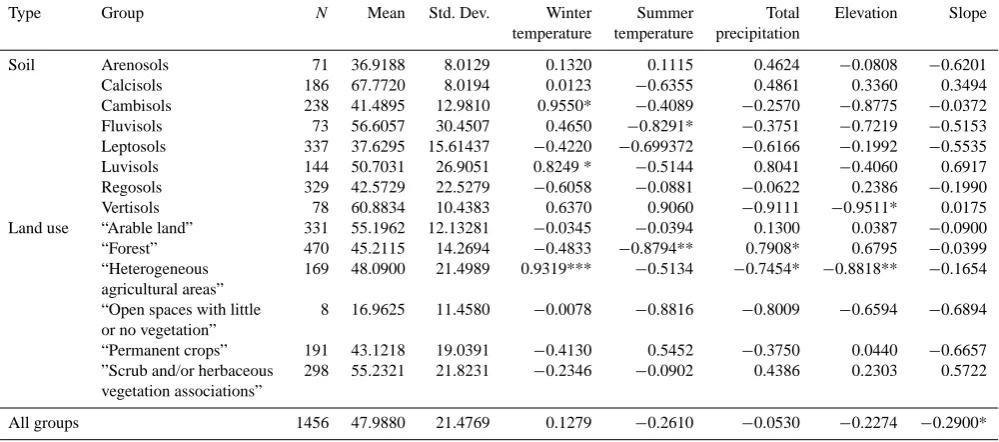
Statistical analysis of correlations between SOC contents and environmental factors is shown in Table 3. Mean values, standard deviation and correlation coefficients have been ob-tained for each variable and SOC in the total data set and land use/soil type groups.
Considering all the soil profiles, SOC was negatively cor-related with slope (r= −0.2900). The analysis did not show significant correlations with other variables.
SOC was positively correlated with winter temperature in Cambisols and Luvisols (r=0.9550 and r=0.8249) and negatively correlated with summer temperature (r= −0.8291) in Fluvisols. In Vertisols, a significant negative correlation was found with elevation (r= −0.9511).
Among land uses, SOC showed a positive correlation with winter temperature in “heterogeneous agricultural ar-eas” (r=0.9319) and a negative correlation with summer temperature in “forest” (r= −0.8794). Elevation is also well correlated with SOC in “heterogeneous agricultural areas” (r= −0.8818)
In both natural land use types (“heterogeneous agricultural areas” and “forest”), significant correlations were found with SOC and annual precipitation. However, whereas in “forest” the correlation was positive (r=0.7908), in “heterogeneous agricultural areas” SOC was negatively correlated with pre-cipitation (r= −0.7454).
4 Discussion 4.1 Soil C stocks
Studies on the spatial distribution of SOC in relation with soil types have been carried out by many authors. Liebens and VanMolle (2003), for example, evaluated different method-ologies for assessing SOC stock in Flanders, Belgium, in
which SOC densities were assigned to polygons on the dig-ital soil map of Flanders. For the total area of Belgium, Let-tens et al. (2005) used a topological intersection of CLC geo-data sets and a digitized soil association map and soil C data from different data sets to plot the distribution of soil C stocks in the country. Also, in France, Arraouays et al. (2001) took into account both forest soil types and vege-tation cover. Then C densities were determined by soil land use category using a combination of geo-referenced soil and CORINE land use databases. The same approach was used in Great Britain by Howard et al. (1995), who mapped the geographical distribution of SOC with estimates based on the dominant soil series and land cover class for 1 km×1 km blocks.
Nevertheless, studies concerning both soil type and land use combined data are scarce, especially in Mediterranean areas. Different soil types show a range of capacities for C sequestration due to soil inherent potential (based on texture, mineralogy, etc.) to retain organic C (Gibson et al., 2002) and therefore, both soil and land use data should be used in determining soil C stocks.
A number of studies have been carried out in different re-gions of Spain concerning SOC stocks under main land uses and/or soil types (Boix-Fayos et al., 2009; D´ıaz-Hern´andez et al., 2003; Ganuza and Almendros, 2003; Jord´an L´opez et al., 2007). One of the most complete is the work conducted by Rodr´ıguez-Murillo (2001), in which stock and spatial dis-tribution of SOC in peninsular Spain was determined using soil profile descriptions available in literature.
Our estimates are in agreement with the results obtained in Mediterranean areas by other authors. Among the major soil types, the largest average SOCC is found in Calcisols, and Vertisols (Fig. 2). Most of Calcisols occur under “Scrub and/or herbaceous associations” and values of SOC stocks for Calcisols obtained in this research are generally larger than those found by several authors (e.g. Rodr´ıguez-Murillo, 2001). However, determined SOCCs are similar to those esti-mated by D´ıaz-Hern´andez et al. (2003) in southeastern Spain, with 52 Mg C ha−1 at 0.5 m depth and 70 Mg C ha−1at 1 m depth.
A high SOC content in Vertisols, which are naturally fertile soils, may be explained by its high clay content and consequently high moisture storage capacity. Simi-lar values of SOCCs for Vertisols were reported in Spain by Rodr´ıguez-Murillo (2001), 68.9 Mg C ha−1, and in Jor-dan by Batjes (2006), 37 Mg C ha−1 at 0.3 m depth and
75 Mg C ha−1 at 1 m depth with 59 Mg C ha−1 for “arable
land” and 68 Mg C,ha−1for “forest” at 1 m depth. Moreover,
in Tunisia, Brahim et al. (2010) estimated 45.6 Mg C ha−1 at 30 cm depth and 109.7 Mg C ha−1 at 1 m depth. Higher values were found in Central and Eastern Europe by Bat-jes (2002), with 82 Mg C ha−1at 0.3 m and 236 Mg C ha−1 at 1 m depth.
Table 3. Mean soil organic carbon content (Mg ha−1) and standard deviation for each soil and land use type and correlation coefficients between soil organic carbon content and environmental variables. (*)p≤0.05; (**)p≤0.01; (***)p≤0.001. Non-significant correlation coefficients are not marked.
Type Group N Mean Std. Dev. Winter Summer Total Elevation Slope
temperature temperature precipitation
Soil Arenosols 71 36.9188 8.0129 0.1320 0.1115 0.4624 −0.0808 −0.6201
Calcisols 186 67.7720 8.0194 0.0123 −0.6355 0.4861 0.3360 0.3494
Cambisols 238 41.4895 12.9810 0.9550* −0.4089 −0.2570 −0.8775 −0.0372 Fluvisols 73 56.6057 30.4507 0.4650 −0.8291* −0.3751 −0.7219 −0.5153 Leptosols 337 37.6295 15.61437 −0.4220 −0.699372 −0.6166 −0.1992 −0.5535
Luvisols 144 50.7031 26.9051 0.8249 * −0.5144 0.8041 −0.4060 0.6917
Regosols 329 42.5729 22.5279 −0.6058 −0.0881 −0.0622 0.2386 −0.1990
Vertisols 78 60.8834 10.4383 0.6370 0.9060 −0.9111 −0.9511* 0.0175
Land use “Arable land” 331 55.1962 12.13281 −0.0345 −0.0394 0.1300 0.0387 −0.0900 “Forest” 470 45.2115 14.2694 −0.4833 −0.8794** 0.7908* 0.6795 −0.0399 “Heterogeneous 169 48.0900 21.4989 0.9319*** −0.5134 −0.7454* −0.8818** −0.1654 agricultural areas”
“Open spaces with little 8 16.9625 11.4580 −0.0078 −0.8816 −0.8009 −0.6594 −0.6894 or no vegetation”
“Permanent crops” 191 43.1218 19.0391 −0.4130 0.5452 −0.3750 0.0440 −0.6657 ”Scrub and/or herbaceous 298 55.2321 21.8231 −0.2346 −0.0902 0.4386 0.2303 0.5722 vegetation associations”
All groups 1456 47.9880 21.4769 0.1279 −0.2610 −0.0530 −0.2274 −0.2900*
are above those calculated by Rodr´ıguez-Murillo (2001) and Batjes (2006), who estimated SOCCs of 22.2 Mg C ha−1 in Spain and 20.0 Mg C ha−1in Jordan, respectively. Neverthe-less, calculations for SOC stocks estimated for Arenosols in this research are similar to values reported in France by Ar-rouays et al. (2001) which range between 28 Mg C ha−1
un-der “arable land” to 44 Mg C ha−1under “forest”.
Cambisols are the most predominant soil type in the study area together with Regosols (Table 2). Cambisols are spread in a wide range of environments around the world and un-der all types of vegetation. Most of the European Regosols are found in the Mediterranean region and are particularly common in arid areas. In the study area of this research, both soil types are used for agriculture and show high values of SOCCs under agricultural land uses.
We obtained lower SOCCs for Cambisols than those esti-mated by other authors in other Mediterranean areas such as Spain and Tunisia. In these areas, Rodr´ıguez-Murillo (2001) and Brahim et al. (2010) calculations were 71.4 Mg C ha−1
and 101.8 Mg C ha−1, respectively, at depth of 1 m. Larger
values were obtained in Germany (114 Mg C ha−1)and
Cen-tral Europe (118 Mg C ha−1) by Neufeldt (2005) and Bat-jes (2002). On the other hand, values of SOCCs for Cam-bisols lie between those proposed by Arrouays et al. (2001) ranging from 30 Mg C ha−1 for “permanent crops” and 121 Mg C ha−1 for moors and heathlands. Moreover, Bat-jes (2006) found similar estimations in Jordan for Cam-bisols, with values of 23 Mg C ha−1 at 0.3 m depth and 45 Mg C ha−1at 1 m depth.
Soil organic C content for Regosols in this study is larger than values reported by other authors in Spain and other Mediterranean regions. Rodr´ıguez-Murillo estimated 48.7 Mg C ha−1 and D´ıaz-Hern´andez et al. (2003) obtained
35 Mg C ha−1at 0.5 cm depth and 52 Mg C ha−1at 1 m depth
and in Jordan, Batjes (2006) reported 8 Mg C ha−1.
Com-pared to France, SOCCs of Regosols under “forest” are sim-ilar, around 50 Mg C ha−1(Arrouays et al., 2001) but we es-timated larger values under “permanent crops”.
We found similar SOCCs in Luvisols and Fluvisols, al-though larger values for Fluvisols were encountered un-der agricultural uses opposite to Luvisols which presented higher SOCCs under “forest” and scrubs. The highest val-ues among all soil classes and land use types in this study were those obtained for Fluvisols under “maritime wetlands” (107.64 Mg C ha−1)at 1 m depth. Fluvisols are fertile soils and frequently occur under rice crops in wetlands. Most of the area covered by Luvisols, which have a great poten-tial for a large number of crops when drainage is adequate, is under “permanent crops” and “arable land”. Rodr´ıguez-Murillo (2001) reported higher values for both Fluvisols and Luvisols in Spain, 75.8 Mg C ha−1 and 66 Mg C ha−1, re-spectively, nonetheless our estimations are within the val-ues propose in France (Arrouays et al., 2001). They esti-mated SOCCs ranging from 27 Mg C ha−1 under “perma-nent crops” to 102 Mg C ha−1 under Pastures for Fluvisols and 29 Mg C ha−1Mg C ha−1 under “permanent crops” to 84 Mg C ha−1under Pastures.
Planosols are frequently used for grazing, nevertheless, under specific management they can be used for cultiva-tion. Solonchaks are widespread in the arid and semi-arid climatic zones and land uses are limited by the salt con-tent. Thus, in the study area low values are found under “arable land” and relatively large under “maritime wetlands” (15.85 Mg C ha−1and 70.80 Mg C ha−1, respectively). These results are in agreement with those estimated in Spain by Rodr´ıguez-Murillo (2001), with 76.3 Mg C ha−1.
Generally, SOC contents are larger in the surface layer de-clining with depth. This is in agreement with previous stud-ies (e.g. Batjes, 1996; Salome et al., 2010). In arid soils from SE Spain, for example, Albadalejo et al. (2011) found that SOC from different soil types showed significant ations within the first 30 cm, and suggested that these vari-ations were caused mainly by land use and precipitation. Nevertheless, the distribution of SOC with depth is likely to vary with different soil types (Schrumpf et al., 2008). More than 50 % of the organic C of all studied soil groups was stored in subsoil horizons (0–25 cm), the layer more sus-ceptible to change upon land use change especially agricul-tural and “forest” management. These results are in line with Sch¨oning et al. (2006) and Gr¨uneberg et al. (2010). In partic-ular, Leptosols, which are commonly shallow soils with lim-ited soil development, accumulate 83.9 % in the first 0.25 m (with 97.4 % of the SOC content in the first 0.5 m). Most of the Leptosols are under scrub and/or herbaceous associations and “forest”, and SOCCs obtained in this research for Lep-tosols were lower than values reported by other areas in sim-ilar regions (Rodr´ıguez-Murillo, 2001; Batjes, 2006). SOCC under “forest” is below other land uses with similar areas, as “arable land” or “permanent crops”. This may be explained as a consequence of the low degree of development of forest soils, where Cambisols, Leptosols and Regosols are domi-nant. Leptosols under “forest”, for example, occupy an area 6.9 and 3.2 times larger than under “arable land” and “per-manent crops”, respectively.
4.2 Relationship between SOCC and environmental variables
It is critical to determine the different factors explaining SOC stocks at different scales (Dai and Huang, 2006; Rodeghiero et al., 2010). According to Jenny (1941), climate is the main factor that influences the soil organic matter content through its effect on inputs (related to biomass production) and out-puts produced by the microbial metabolism (influenced in turn by the climate and water availability). Natural or an-thropic processes favouring increased biomass production (such as soil fertility, photosynthetic efficiency, fertilisation, etc.) should be favourable to the decrease in atmospheric C content, by fixation in biomass or in soil (Mac´ıas et al., 2004).
The correlation between SOC content and winter tempera-ture was positive for most soil types, although significant
cor-relation coefficients were only observed for Cambisols and Luvisols. Correlation coefficients between SOC content and summer temperature were mostly negative, but significant correlations were only observed for Fluvisols. Other authors have reported negative correlations between temperature and SOC content (Hontoria et al., 1999; Ganuza and Almendros 2003; Dai and Huang, 2006). Concentrations of organic C are usually higher in cold environments, where decomposition rates are low (Paustian, 2002). However, the range of temper-atures in the studied area is not as wide as those observed in broad scale studies (e.g. Dai and Huang, 2006), and local pro-cesses can be significant. Our results suggest that extremely low winter and extremely high summer mean temperatures in the study area contribute to a decrease in SOC content.
Significant correlation coefficients were observed for pre-cipitation and SOC content from “forest” (r=0.7908) and “heterogeneous agricultural areas” (r= −0.7454), but con-tradictory results exist and a clear trend was not observed. Weak and no significant correlation was found when all soil profiles were considered. This is in contrast with results from other authors in Spain (Hontoria et al., 1999; Rodr´ıguez-Murillo, 2001). Hontoria et al. (1999) obtainedr=0.55 for the whole country and Ganuza and Almendros (2003) es-timated r=0.5675 in the Basque Country (North Spain). Job´aggy and Jackson (2000) analysed a large amount of soil profiles in the United States and elsewhere reporting values ofr=0.5 for 1 m depth. In a recent research, Ruiz Sinoga et al. (2012) have found that SOC sequestration in Mediter-ranean rangelands from southern Spain is reduced one order of magnitude from soil profiles under humid (59.9 Mg ha−1) to semiarid (11.6 Mg ha−1)climatic conditions.
High and significant negative correlations were observed between SOC content and elevation for Vertisols. Also, high (but non-significant) correlations were observed for Cam-bisols (r= −0.8775) and Fluvisols (r= −0.7219). Other soils showed weak and non-significant correlations. For LU types, elevation was significantly correlated to SOC con-tent only in “heterogeneous agricultural areas”. When all groups were considered, weak and no significant correla-tions were observed between SOC and elevation, in contrast with other studies by Hontoria et al. (1999) and Rodr´ıguez-Murillo (2001), although these authors considered soil data from the Iberian Peninsula.
4.3 Limitations of the methodology
Spain, for example, Rodr´ıguez-Murillo (2001) reported CVs between 49.3 and 136.0 % for SOC concentrations under the main land use types. Relatively high CV are usual for re-gional or national scale studies and the IPCC assume that there are uncertainties on absolute stock values calculations and therefore high quality data sets should be used to reduce estimation uncertainty. It is necessary to assume some uncer-tainty when using average values with high CV in small scale studies (as in national or regional inventories).
All soil types are not homogenously distributed. Cam-bisols, Fluvisols, Leptosols, Luvisols, Regosols, and Ver-tisols account for 93.29 % of the study area, whereas Arenosols, Calcisols, Planosols and Solonchaks correspond to 6.71 %. Consequently, when these soils are subdivided per LU class, the number of soil profiles per soil-LU combination is sometimes low. However, these combinations are represen-tative of small areas which do not alter significantly global estimations.
Many empirical models have been proposed for explain-ing the relationship between SOC content and climatic fac-tors. Global data show that organic C content increases in soils under high rainfall and low temperature (Oades, 1988). At detailed scales, anthropic transformation of ecosystems may strongly affect SOC content. Intensification of agricul-tural management, silviculture or afforestation, for example, may buffer the impact of climate on SOC. As a consequence, regional or local-scale studies may not show strong depen-dence between SOC content and climatic variables. Also, in the context of global change, other SOC redistribution or se-questration processes might be considered, as the increing frequency of wildfires. At wide scale, wildfires are as-sumed to increase the organic C stock in soils, as reported by Gonz´alez-P´erez et al. (2004). At local scale, redistribution processes of soil organic matter by water erosion processes following wildfires may be substantial. It has been reported that erosion and the subsequent deposition after forest fires constitute a sink for C-rich sediments at the valley bottoms. In addition, C losses by soil erosion at the hillslopes may be replaced by the production of new biomass (Novara et al., 2011).
5 Conclusions
This study comprises the first comprehensive analysis of cur-rent organic C stocks for each soil type under present land use types in Andalusia, Southern Spain. In this research soil organic C pools and their distribution within the soil profile, are estimated under existing land uses, providing baseline in-formation to assess the potential of the different soil types for SOC sequestration.
Soil organic C stocks are estimated at different depths (0– 25, 25–50 and 50–75 cm) under different land use/soil type associations. Cambisols and Regosols are the most common soil types in Andalusia, but Calcisols and Vertisols show the
highest SOCC values, above 65 Mg C ha−1. In total, SOC
stock is 415 Tg in the upper 75 cm and on average, with 55 % stored in the first layer (0–25 cm). The amount of SOC in the first 75 cm was significantly correlated with annual mean temperature, annual mean precipitation and elevation in nat-ural areas.
Regional studies for assessing soil organic C stocks are needed and should include information about LU/LC and soil class.
Nevertheless, large uncertainties in estimates of SOC stock prevail. These uncertainties can be also attributed to gaps in our understanding of both future land C content and quantifi-cation of the response of C sequestration according to land use change. Therefore, the role of future land use change in C stocks is considered in further research.
Acknowledgements. This research has been partly funded by the
Ministry of Economy, Innovation and Science (Research Project 851238) and the Regional Ministry of Environment (Research Project 0501/0268) of the Andalusian Government. Ozren Bog-danovi´c (Andalusian Centre of Developmental Biology, CABD) proofread a previous version of the manuscript.
Edited by: A. Cerd`a
References
Albadalejo, J., Mart´ınez-Mena, M., Garc´ıa Franco, N., Almagro, M., and Ortiz Silla, R.: Sensibilidad del carbono org´anico del suelo al cambio global: influencia de la profundidad, in: Control de la degradaci´on y uso sostenible del suelo, edited by: Ortiz Silla, A. and S´anchez Navarro, A., University of Murcia, Murcia, 577–580, 2011.
Anaya-Romero, M., Pino, R., Moreira, J. M., Mu˜noz-Rojas, M., and de la Rosa, D.: Analysis of soil capability versus land use change by using CORINE land cover and MicroLEIS, Int. Agrophys., 25, 395–398, 2011.
Arrouays, D., Deslais, W., and Badeau, V.: The carbon content of topsoil and its geographical distribution in France, Soil Use Man-age., 17, 7–11, 2001.
Bahn, M., Kutsch, W. L., Heinemeyer, A.: Synthesis: emerging is-sues and challenges for an integrated understanding of soil car-bon fluxes, in: Soil Carcar-bon Dynamics, An Integrated Methodol-ogy, edited by: Kutsch, W. L., Bahn, M., and Heinemeyer, A., Cambridge, Universty Press Cambridge, 257–271, 2009. Batjes, N. H.: Total carbon and nitrogen in the soils of the world,
Eur. J. Soil Sci., 47, 151–163, 1996.
Batjes, N. H.: Carbon and nitrogen stocks in the soils of Central and Eastern Europe, Soil Use Manage., 18, 324–329, 2002. Batjes, N. H.: Organic carbon stocks in the soils of Brazil, Soil Use
Manage. 21, 22–24, 2005.
Batjes N. H.: Soil carbon stocks of Jordan and projected changes upon improved management of croplands, Geoderma, 132, 361– 371, 2006.
Blake, G. R. and Hartge, K. H.: Bulk density, in: Methods of Soil Analysis-Part 1, Physical and Mineralogical Methods, 2nd edn., edited by: Klute, A., American Society of Agronomy, Madison, 1986.
Blondel, J. and Aronson, J.: Biodiversity and ecosystem function in the Mediterranean basin: human and non-human determinants, in: Mediterranean-Type Ecosystems, edited by: Davis, G. W. and Richardson, D. M., Springer, New York, 42–20, 1995.
Boix-Fayos, C., de Vente, J., Albaladejo, J., and Mart´ınez-Mena, M.: Soil carbon erosion and stock as affected by land use changes at the catchment scale in Mediterranean ecosystems, Agr. Ecosyst. Environ., 133, 75–85, 2009.
Bradley, R. I., Milne, R., Bell, J., Lilly, A., Jordan, C., and Higgins, A.: A soil carbon and land use database for the United Kingdom, Soil Use Manage., 21, 363–369, 2005.
Brahim, N., Bernoux, M., Blavet, D., and Gallali, T.: Tunisian soil organic carbon stocks, Int. J. Soil Sci., 5, 34–40, 2010.
CSIC-IARA: Mapa de suelos de Andaluc´ıa, Instituto Andaluz de la Reforma Agraria (Junta de Andaluc´ıa), Sevilla, Consejo Superior de Investigaciones Cient´ıficas, Madrid, 1989.
Dai, W. and Huang, Y.: Relation of soil organic matter concentration to climate and altitude in zonal soils of China, Catena, 65, 87–94, 2006.
De la Rosa, D., Mayol, F., Moreno, F., Cabrera, F., Diaz-Pereira, E., and Antoine, J.: A multilingual soil profile database (SDBm Plus) as an essential part of land resources information systems, Environ. Modell. Softw., 17, 721–730, 2002.
De la Rosa, D., Mayol, F., Diaz-Pereira, E., Fern´andez M., and de la Rosa Jr, D.: A Land Evaluation Decision support System (Mi-croLEIS DSS) for Agricultural Soil Protection, Environ. Modell. Softw., 19, 929–942, 2004.
D´ıaz-Hern´andez, J. L., Barahona Fern´adez, E., and Linares Gonz´alez, J.: Organic and inorganic carbon in soils of semiarid regions: a case study from the Guadix–Baza basin (Southeast Spain), Geoderma, 114, 65–80, 2003.
Don, A., Scholten T., and Schulze, E. D.: Conversion of cropland into grassland: Implications for soil organic-carbon stocks in two soils with different texture, J. Plant Nutr. Soil Sci., 172, 53–62, 2009.
ESRI: ArcGIS, 9.2., Environmental Scientific Research Institute, Redlands, CA, 2006.
Eswaran, H., Van der Berg, E., and Reich, P.: Organic carbon in soils of the world, Soil Sci. Soc. Am. J., 57, 192–194, 1993. FAO: Guidelines for soil description, 4th edition, Food and
Agricul-ture Organization of the United Nations, Rome, 2006.
Flores, M. V., Ferrer, F., Jim´enez, G., Valera, A., and Goberna, M.: Distribuci´on del contenido de carbono org´anico en los suelos del norte de Castell´on, in: Control de la degradaci´on de suelos y la desertificaci´on, edited by: Rodr´ıguez Rodr´ıguez, A. and Arbel´o, C. D., University of La Laguna, La Laguna, 207–208, 2007. Ganuza, A. and Almendros, G.: Organic carbon storage in soils
of representative ecosystems in the Basque Country (Northern Spain) as related to climate, vegetation type and edaphic vari-ables, Biol. Fert. Soils, 37, 154–162, 2003.
Gibson, T. S., Chan, K. Y., Sharma, G., and Shearman, R.: Soil carbon sequestration utilising recycled organics. A review of the scientific literature, Project 00/01R-3.2.6A.2002, Organic Waste Recycling Unit, NSW Agriculture, NSW Agriculture, Sydney, 2002.
Gonz´alez-P´erez, J., Gonz´alez-Vila, F. J., Almendros, G., and Knicker, H.: The effect of fire on soil organic matter – a review, Environ. Int., 30, 855–870, 2004.
Gr¨uneberg, E., Sch¨oning, I., Kalko, E. K. V., and Weisser, W. W.: Regional organic carbon stock variability: A comparison be-tween depth increments and soil horizons, Geoderma, 155, 426– 433, 2010.
Heymann, Y., Steenmans, Ch., Croissille, G., and Bossard, M.: Corine Land Cover technical guide, Office for Official Publica-tions of the European Communities, Luxembourg, 1994. Hontoria, C., Rodr´ıguez-Murillo, J. C., and Saa, A.: Relationships
between soil organic carbon and site characteristics in peninsular Spain, Soil Sci. Soc. Am. J., 63, 617–621, 1999.
Houghton, R. A.: The contemporary carbon cycle, in: Biogeochem-istry, edited by: Schlesinger, W. H., Elsevier-Pergamon, Oxford, 473–513, 2005.
Howard, P. J. A., Loveland, P. J., Bradley, R. I., Dry, F. T., Howard, D. M., and Howard, D. C.: The carbon content of soil and its geographical distribution in Great Britain, Soil Use Manage., 11, 9–15, 1995.
Ib´a˜nez, J. J., S´anchez, J., de Alba, S., L´opez, M., and Boixadera, J.: Collection of soil information in Spain: a review, in: Soil re-sources of Europe: 2nd ESB Research Report No. 9, edited by: Jones, R. J. A., Houskova, B., Bullock, P., and Montanarella, L., Luxembourg, Office for Official Publications of the European Communities, 2005.
ICA: Modelo Digital de Elevaciones, 100 m, CD-ROM: Instituto de Cartograf´ıa de Andaluc´ıa, Consejer´ıa de Obras P´ublicas y Trans-portes (Junta de Andaluc´ıa), Sevilla, 1999.
IPCC: Special report on emissions scenarios – a special report of working group III of the Intergovernmental Panel on Climate Change, Cambridge University Press, Cambridge, 2000. IPCC: Climate Change 2007, The Physical Science Basis,
Cam-bridge University Press, CamCam-bridge/New York, 2007.
IUSS Working Group WRB: World reference base for soil resources 2006, World Soil Resources Reports No. 103, Food and Agricul-ture Organization of the United Nations, Rome, 2006.
Jenny, H.: Factors of soil formation: a system of quantitative pedol-ogy, Mc Graw-Hill, London, 1941.
Jobb´agy, E. G. and Jackson, R. B.: The vertical distribution of soil organic carbon and its relation to climate and vegetation, Ecol. Appl., 104, 423–436, 2000.
Jord´an, A. and Zavala, L. M.: Obtenci´on de Indicadores a partir de la Base de Perfiles de Suelo para su aplicaci´on a la Mod-elizaci´on Clim´atica, Technical report 0501/0268, Consejer´ıa de Medio Ambiente (Junta de Andaluc´ıa), Sevilla, 2009.
Jord´an L´opez, A., Mart´ınez-Zavala, L., and Bellinfante Crocci, N.: Reserva de Carbono en Suelos Forestales Mediterr´aneos, in: Ten-dencias Actuales de la Ciencia del Suelo, edited by: Bellinfante, N. and Jord´an, A., Universidad de Sevilla, 638–647, 2007. Lal, R.: Global potential of soil C sequestration to mitigate the
greenhouse effect, Crc. Cr. Rev. Plant Sci., 22, 151–184, 2003. Lal, R.: Soil carbon sequestration to mitigate climate change,
Geo-derma, 123, 1–22, 2004.
Leifeld, J., Bassin, S., and Fuhrer, J.: Carbon stocks in Swiss agri-cultural soils predicted by land-use, soil characteristics, and alti-tude, Agr. Ecosyst. Environ., 105, 255–266, 2005.
units in Belgium derived from heterogeneous data sets for 1990 and 2000, Geoderma, 127, 11–23, 2005.
Liebens, J. and VanMolle, M.: Influence of estimation procedure on soil organic carbon stock assessment in Flanders, Belgium, Soil Use Manage., 19, 364–371, 2003.
Liski, J., Perruchoud, D., and Karjalainen, T.: Increasing carbon stocks in the forest soils of western EUROPE, Forest Ecol. Manag., 169, 159–175, 2002.
Mac´ıas, F., Calvo de Anta, R., Rodr´ıguez Lado, L., Verde, R., Pena P´erez, X., and Camps Arbestain, M.: El sumidero de carbono de los suelos de Galicia, Edafolog´ıa, 11, 341–376, 2004.
MARM: Inventario de emisiones de gases de efecto invernadero de Espa˜na e informaci´on adicional, a˜nos 1990–2009, Comunicaci´on a la secretar´ıa del convenio marco sobre cambio clim´atico y Pro-tocolo de Kioto, Ministerio de Medio Ambiente, Medio Rural y Marino, Madrid, 2011.
Martin, M. P., Wattenbach, M., Smith, P., Meersmans, J., Jolivet, C., Boulonne, L., and Arrouays, D.: Spatial distribution of soil organic carbon stocks in France, Biogeosciences, 8, 1053–1065, doi:10.5194/bg-8-1053-2011, 2011.
Meersmans, J., De Ridder, F., Canters, F., De Baets, S., and Van Molle, M.: A multiple regression approach to assess the spatial distribution of soil organic carbon (SOC) at the regional scale (Flanders, Belgium), Geoderma, 143, 1–13, 2008.
Moreira, J. M.: Mapas de usos y coberturas vegetales del suelo de Andaluc´ıa, Escala 1/25,000, Gu´ıa T´ecnica, Consejer´ıa de Medio Ambiente (Junta de Andaluc´ıa), Sevilla, 2007.
Morisada, K., Ono, K., and Kanomata, H.: Organic carbon stock in forest soils in Japan, Geoderma, 119, 21–32, 2004.
Mu˜noz-Rojas, M., De la Rosa, D., Zavala, L. M., Jord´an, A., and Anaya-Romero M.: Changes in land cover and vegetation car-bon stocks in Andalusia, Southern Spain (1956–2007), Sci. Total Environ., 409, 2796–2806, 2011.
Neufeldt, H.: Carbon stocks and sequestration potentials of agricul-tural soils in the federal state of Baden-W¨urttemberg, SW Ger-many, J. Plant Nutr. Soil Sci., 168, 202–211, 2005.
Novara, A., Gristina, L., Bod`ı, M. B., and Cerd`a, A.: The impact of fire on redistribution of soil organic matter on a Mediterranean hillslope under maquia vegetation type, Land Degrad. Dev., 22, 530–536, 2011.
Oades, J. M.: The retention of organic matter in soils, Biogeochem-istry, 5, 35–70, 1988.
Ostle, N. J., Levy, P. B., Evans, C. D., and Smith, P.: UK land use and soil carbon sequestration, Land Use Policy, 26, 274–283, 2009.
Paustian, K.: Organic matter and global cycle, in: Encyclopedia of Soil Science, edited by: Lal, R., Marcel Dekker Inc., NY, 895– 898, 2002.
Phachomphon, K., Dlamini, P., and Chaplot, V.: Estimating carbon stocks at a regional level using soil information and easily acces-sible auxiliary variables, Geoderma, 155, 372–380, 2010. Rodeghiero, M., Tonolli, S., Vescovo, L., Gianelle, D., Cescatti, A.,
and Sottocornola, M.: INFOCARB: a regional scale forest car-bon inventory (Provincia Autonoma di Trento, Southern Italian Alps), Forest Ecol. Manag., 259, 1093–1101, 2010.
Rodr´ıguez-Murillo, J. C.: Organic carbon content under different types of land use and soil in peninsular Spain, Biol. Fert. Soils, 33, 53–61, 2001.
Ruiz Sinoga, J. D., Pariente, S., Romero Diaz, A., and Martinez Murillo, J. F.: Variability of relationships between soil organic carbon and some soil properties in Mediterranean rangelands un-der different climatic conditions (South of Spain), Catena, 94, 17–25, 2012.
Salome, C., Nunan, N., Pouteau, V., Lerch, T. Z., and Chenu, C.: Carbon dynamics in topsoil and in subsoil may be controlated by different regulatory mechanisms, Glob. Change Biol., 16, 416– 426, 2010.
Sch¨oning, I., Totsche, K. U., and K¨ogel-Knabner, I.: Small scale spatial variability of organic carbon stocks in litter and solum of a forested Luvisol, Geoderma, 136, 631–642, 2006.
Schrumpf, M., Schumacher, J., Sch¨oning, I., and Schulze, E. D.: Monitoring carbon stock changes in European soils: process un-derstanding and sampling strategies, in: The Continental-Scale Greenhouse Gas Balance of Europe, edited by: Dolman, A. J., Freibauer, A., and Valentini, R., Springer, NY, 2008.
Schulp, C. J. E, Nabuurs, G. J., and Verburg, P. H.: Future carbon sequestration in Europe-Effects of land use change, Agr. Ecosyst. Environ., 127, 251–264, 2008.
Schwartz, D. and Namri, M.: Mapping the total organic carbon in the soils of the Congo, Global Planet. Change, 33, 77–93, 2002. Smith, P.: Carbon sequestration in croplands: the potential in Eu-rope and the global context, Eur. J. Agron., 20, 229–236, 2004. Smith, P.: Land use change and soil organic carbon dynamics, Nutr.
Cycl. Agroecosys., 81, 169–178, 2008.
SPSS: PASW Statistics 18.0. SPSS, Inc., Chicago, 2009.
StatSoft: STATISTICA (data analysis software system), version 6. Statsoft, Inc., Tulsa, 2001
VandenBygaart, A. J.: Monitoring soil organic carbon stock changes in agricultural landscapes: issues and a proposed approach, Can. J. Soil Sci., 86, 451–463, 2006.