2002 Annual Statistics
Report
Primary Education
Division of Policy and Planning Services Department of Education
Prim ary Schools
0 10 20 30 40 50 60 70
Torba Sanma Malampa Penama Shef a Taf ea
nu
m
be
r
Acknowledgement
It is indeed my great pleasure to submit the 2002 Primary School Annual Statistical Report. This report has been successfully published in collaboration with the head teachers and teachers. The school radio program by Mr. Enoch Léon has played significant role in this part.
The Division of Policy and Planning Services wishes to thank the other divisions of the department of Education for assisting during the collection exercise. The primary school data collection in this regard is crucial as it determines the financial grant from the government to the provincial education offices, consequently it is paramount for the teachers to prioritize data collection as it also assist in the annual budgeting of the Ministry of Education.
The data compiled would provide to all users and public at large information on statistics of each primary school. The data is compiled using tables and graphical illustrations and a brief analysis of the data.
Intentionally, this report is produced to meet short and long term demands of all particularly planners of government and non-government organizations, and specifically the Ministry of Education and students to name a few.
Thank you all again who have contributed in one way or another and I look forward to your cooperation in similar future exercises.
Yours Sincerely
Jesse Dick Director
Table of Content
ACKNOWLEDGEMENT
INTRODUCTION
SECTION 1: SCHOOL INFORMATION ... 5
TABLE 1:NUMBER OF SCHOOLS BY PROVINCE AND BY MEDIUM OF INSTRUCTION ... 5
GRAPH 1:PRIMARY BY MEDIUM OF INSTRUCTION ... 5
TABLE 2:NUMBER OF ANGLOPHONE AND FRANCOPHONE SCHOOLS BY ADMINISTRATION ... 6
GRAPH 2:DISSAGGREGATION OF ANGLOPHONE PRIMARY SCHOOLS IN THE COUNTRY. ... 6
GRAPH 2.1:DISAGGREGATION OF FRANCOPHONE PRIMARY SCHOOLS IN THE COUNTRY. ... 6
TABLE 3:URBAN PRIMARY SCHOOLS BY TYPE OF ADMINISTRATION ... 7
GRAPH 3:URBAN PRIMARY SCHOOLS BY TYPE OF ADMINISTRATION ... 7
TABLE 4:NUMBER OF CLASSES BY PROVINCES AND BY YEAR,(CLASSES 1-6) ... 7
GRAPH 4:CLASSROOMS TREND BY YEAR LEVEL ... 8
SECTION II: STUDENT INFORMATION ... 9
TABLE 1:NUMBER OF PRIMARY SCHOOL STUDENTS BY PROVINCE,2002 ... 9
GRAPH 1:BAR GRAPH SHOWING THE TOTAL NUMBER OF PRIMARY SCHOOL STUDENT BY ... 10
PROVINCE,2001 AND 2002. ... 10
TABLE 2:TOTAL NUMBER OF PRIMARY SCHOOL STUDENTS BY MEDIUM OF INSTRUCTION ... 10
AND BY PROVINCE. ... 10
GRAPH 2:PRIMARY STUDENT PERCENTAGE BY GENDER AND BY LANGUAGE,2002. ... 11
TABLE 3:TOTAL PRIMARY ENROLMENT BY AGE AND BY YEAR LEVEL,2002 ... 11
GRAPH 3:PRIMARY ENROLMENT –OFFICIAL AND UNOFFICIAL AGES ... 12
TABLE 4:TOTAL NUMBER OF STUDENT BY SCHOOL ADMINISTRATION ... 12
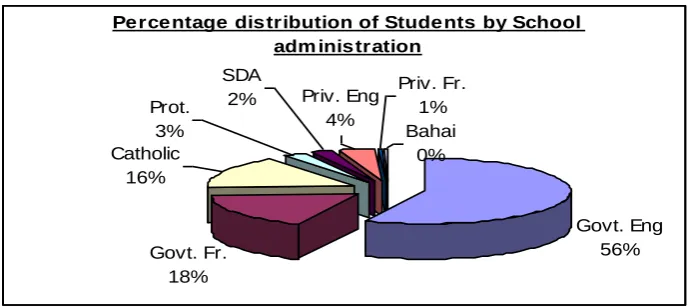
GRAPH 4:PERCENTAGE DISTRIBUTION OF STUDENT BY SCHOOL ADMINISTRATION ... 12
TABLE 5:TOTAL NUMBER OF PRIMARY SCHOOL STUDENT IN PORT-VILA AND LUGANVILLE. ... 13
GRAPH 5:PERCENTAGE DISTRIBUTION OF STUDENTS IN BOTH URBAN AND RURAL SCHOOLS ... 13
TABLE 6:ENROLMENT TREND FROM 1992-2002 ... 14
GRAPH 6:PRIMARY SCHOOL ENROLMENT GROWTH 1992-2002 ... 14
TABLE 7:TOTAL NUMBER OF PRIMARY REPEATERS BY PROVINCE,2002 ... 15
TABLE 8:TOTAL NUMBER OF DROPOUTS BY PROVINCE,2002 ... 15
SECTION III: TOP-UP SCHOOL’S INFORMATION ... 16
TABLE 1:TOTAL NUMBER OF TOP-UP SCHOOLS . ... 16
GRAPH 1:BAR GRAPH SHOWING THE TOTAL NUMBER OF PRIMARY SCHOOLS AND TOP-UP ... 16
SCHOOLS IN THE COUNTRY. ... 16
TABLE 2:TOTAL NUMBER OF STUDENT IN YEAR 7 AND YEAR 8TOP-UP SCHOOLS. ... 17
GRAPH 2:PERCENTAGE DISTRIBUTION OF TOP-UP SCHOOL STUDENTS BY PROVINCE ... 17
TABLE 3:TOTAL NUMBER OF TEACHERS WHO TEACH IN TOP-UP SCHOOLS ... 17
SECTION VI: PRIMARY SCHOOL TEACHER’S INFORMATION ... 18
TABLE 1:TOTAL NUMBER OF PRIMARY SCHOOL TEACHER’S BY PROVINCE AND BY SEX. ... 18
GRAPH 1:PERCENTAGE DISTRIBUTION OF PRIMARY SCHOOL TEACHERS BY PROVINCE ... 18
TABLE 2:PERCENTAGE OF PRIMARY SCHOOL TEACHERS WITH TEACHING QUALIFICATION... 19
TABLE 3:PRIMARY SCHOOL STUDENT/TEACHER RATIO ... 19
TABLE 4:PRIMARY SCHOOL TEACHER’S STATUS ... 20
TABLE 5:PRIMARY SCHOOL TEACHER’S PAID UNDER DIFFERENT SCHOOL AUTHORITIES. ... 20
CONCLUSION: ... 21
RECOMMENDATION: ... 21
ANNEX ... 22
INTRODUCTION
The Primary School Annual Report is intended to assist users in particular planners identify and make important decisions to serve different needs of primary education. According to this report, there are 408 schools of which 282 are government owned 107 mission schools and 19 private schools.
The objective of this report are as follows:
To identify the needs for access to basic education To determine annual enrolment rates
To identify if there is sufficient qualified teachers
To assist identify teacher qualification, pre and in-service training needs To identify different problems frequently arising in schools
To determine the distribution and rationalization of schools
This report consists of three (3) main sections; School Information, Pupil’s Information and Teacher’s Information. The analysis of this report is based on data extracted from the questionnaires received from each primary school. As in previous years, most of the collected returns are incomplete. There are schools in the provinces that do not return their statistical questionnaires. Therefore there is a need for all head teachers to take into account the importance of completing and returning the completed questionnaires as it affects the integrity of this presentation.
This year the statistical questionnaires were sent directly to all primary schools as a way to battle part of the problems. However, certain schools have reported not receiving the questionnaires as expected. It is certain that there is communication difficulty because of the islands’ remoteness across the sea and also due to interior location of some of the primary.
Section 1:
School Information
In this section, the information on primary schools is illustrated using tables and graphs followed with a brief analysis.
Table 1: Number of Schools by Province and by Medium of Instruction
Malampa and Sanma provinces have the highest number of schools establishments, followed by Tafea and Shefa province with the second highest number of schools. Penama province has a total of 65 schools and Torba province has the least number of school schools establishments.
Graph 1: Primary by Medium of Instruction
Graphically as shown above there are more anglophone primary schools in the country as in the previous years. This shows that a high portion of population use English as means for communication. It must be clear that primary schools establishment of whatever the medium of instruction is the choice of the community and the government steps in to assist once the school is fully operational.
Province Anglophone Schools Francophone Schools Total
Torba 13 7 20
Sanma 53 31 84
Malampa 53 39 92
Penama 41 24 65
Shefa 58 20 78
Tafea 37 35 72
Total 255 156 411
Prim ary Schools
0 10 20 30 40 50 60 70
Torba Sanma Malampa Penama Shef a Taf ea
nu
m
be
r
Table 2: Number of Anglophone and Francophone Schools by Administration
The above table indicates the total number of primary schools by Administration. The government operates in collaboration with the communities 70 percent of the primary schools in the country. Catholic mission operates 11 percent of schools, Protestant school 6 percent, SDA mission 5 percent and private organizations operate 8 percent of primary schools in the country.
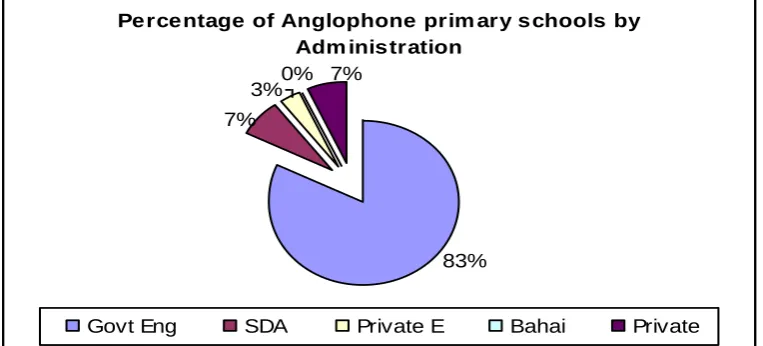
Graph 2: Dissaggregation of Anglophone primary schools in the country.
The above graph shows the distribution of Anglophone primary schools by administration. The pie chart shows that the government in collaboration with the communities operates 83 percent of Anglophone primary schools followed by SDA mission and Private or individuals own 7 percent of the anglophone primary schools.
Graph 2.1: Disaggregation of Francophone primary schools in the country.
Province Anglophone Francophone Catholic Protestant SDA Private E Private F Bahai Private Total
Torba 13 7 20
Sanma 39 10 9 12 3 11 84
Malampa 41 15 13 11 11 1 92
Penama 39 11 13 1 1 65
Shefa 48 16 2 2 8 2 78
Tafea 30 21 13 1 2 1 4 72
Total 210 80 50 24 19 8 2 1 17 411
Percentage of Anglophone prim ary schools by Adm inistration
83% 7%
7% 0% 3%
Govt Eng SDA Private E Bahai Private
Percentage of Primary Francophone schools
52% 32%
15% 1%
The government dominates the development of French primary education with 52 percent of schools followed by catholic mission with 32 percent and other church denominations operate a few of them.
Table 3: Urban Primary Schools by type of Administration
This table shows that 7 percent of all primary schools are located in the two urban zones. Five (5) percent of the urban primary schools are located in Port-Vila and 2 percent in Luganville. Here is the classification of schools by type of administration: 43% are own by the government,
7% of the schools are church own,
and 33% of the schools are operating privately.
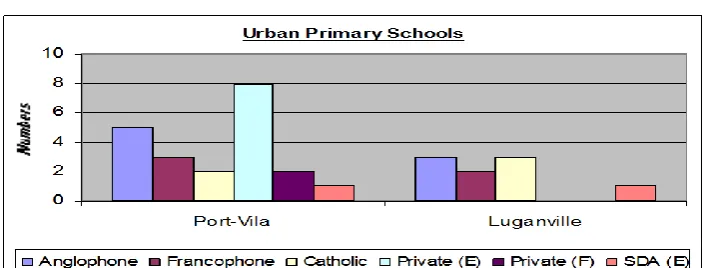
Graph 3: Urban primary schools by type of Administration
The bar graph shows that in Port-Vila there are government schools, catholic, SDA and private schools whereas in Luganville we do not have any private primary schools apart from the church schools.
Table 4: Number of classes by Provinces and by Year, (classes 1-6)
The above table shows that the total number of classrooms decrease from grade 1 to grade 6. There is a big drop in the number of classes 6 compare to the available number of classes 1. Note that this assumption is base on the student teacher ratio of
Municipalities
Anglophone Francophone Catholic Private (E) Private (F) SDA (E) Total
Port-Vila 5 3 2 8 2 1 21
Luganville 3 2 3 1 9
Total 8 5 5 8 2 2 30
Government
Province Cl.1 Cl.2 Cl.3 Cl.4 Cl.5 Cl.6 Cl.7 Cl.8 Total
Torba 18 17 16 15 16 13 4 1 100
Sanma 83 84 79 74 66 62 9 1 458
Malampa 88 87 75 75 69 55 10 0 459
Penama 58 62 58 51 52 51 5 0 337
Shefa 85 84 76 76 67 80 14 1 483
Tafea 72 67 67 60 57 43 11 1 378
Total 404 401 371 351 327 304 53 4 2215
Graph 4: Classrooms trend by year level
The above line graph illustrates table 4 data, it shows the decrease of the existing number of classrooms from class 2 to class 6. The number of grade 7 and 8 is very limited because the Ministry newly introduced Year 7 top-up schools this year. The indicators show that there are 53 top up classes. In 2003, the number of year 8 top-up classes is expected to increase.
Existing prim ary classroom s
0 100 200 300 400 500
Cl.1 Cl.2 Cl.3 Cl.4 Cl.5 Cl.6 Cl.7 Cl.8
classroom s level
Nu
m
b
e
Section II:
Student Information
The information in the second part of this report will be illustrated using tables and graphs:
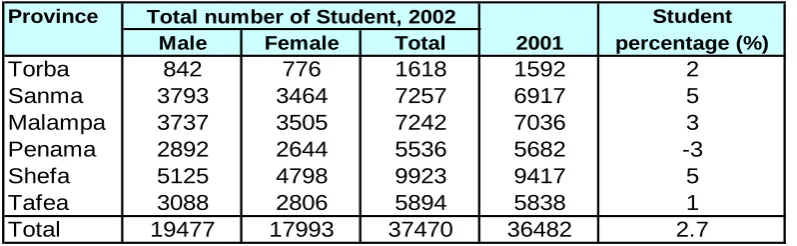
Table 1: Number of Primary school students by Province, 2002
The above table shows the total number of primary school students for year 2002, which is an increase of 2.7 percent compare to year 2001. All the provinces have shown an increase in student enrolment except for the Penama province, which have shown a negative growth in enrolment (-3%).
According to the Nation Population Census Report, the distribution of the population by gender indicates that there are more males than females. This is also reflected in official enrolment. This year 52 percent are male and 48 female students in our primary schools. The total number of primary student by province indicates that 27 percent of student enrolled in primary schools in Shefa province followed by 21 percent in Sanma, Malampa 20 percent, Tafea province 16 percent, Penama 15 percent and torba province with 5 percent.
Shefa province has the highest number of primary schools students due to the high population growth in the urban areas.
The data collected from some church schools show that the number of student who actually enrolled is inferior to the official required number of student per class. This means that teachers are teaching below the required number of students base on the official ratio 30:1.
Province Student
Male Female Total 2001 percentage (%)
Torba 842 776 1618 1592 2
Sanma 3793 3464 7257 6917 5
Malampa 3737 3505 7242 7036 3
Penama 2892 2644 5536 5682 -3
Shefa 5125 4798 9923 9417 5
Tafea 3088 2806 5894 5838 1
Total 19477 17993 37470 36482 2.7
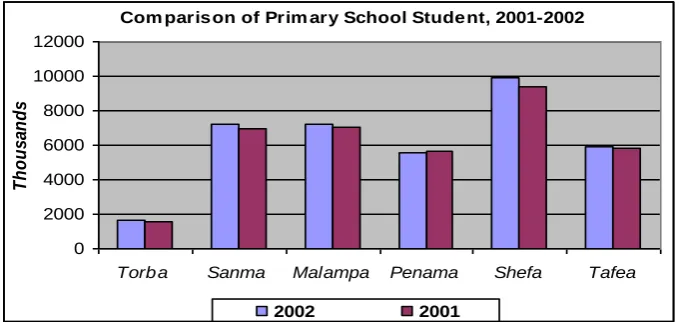
Graph 1: Bar graph showing the total number of Primary school student by Province, 2001 and 2002.
The above graph shows the comparison of total primary enrolment by province in 2001 and 2002. The data indicate that there is major increase in Shefa and Sanma provinces due to the high number of student who enrolled in Port-Vila and Luganville schools.
Table 2: Total Number of Primary School students by Medium of Instruction and by Province.
This table shows that 64 percent of the students enrol in Anglophone schools and 36 percent in francophone Schools.
Com parison of Prim ary School Student, 2001-2002
0 2000 4000 6000 8000 10000 12000
Torba Sanma Malampa Penama Shefa Tafea
T
h
o
u
s
a
n
d
s
2002 2001
Province Total
Male Female Male Female Male Female Total
Torba 503 502 339 274 842 776 1618
Sanma 2236 2052 1557 1412 3793 3464 7257
Malampa 2084 1963 1653 1542 3737 3505 7242
Penama 2008 1842 884 802 2892 2644 5536
Shefa 3571 3349 1554 1449 5125 4798 9923
Tafea 1892 1646 1196 1160 3088 2806 5894
Total 12294 11354 7183 6639 19477 17993 37470
23648 13822
Graph 2: Primary student percentage by gender and by Language, 2002.
The distribution of enrolment by medium and by sex shows that 33% of the
anglophone are male and 30% female student where as in the francophone schools 18 percent are males and 19 percent female.
Table 3: Total Primary Enrolment by Age and by Year level, 2002
This table shows enrolment by age and grade. According to the primary education policy, the official age to enter primary school is 6 to 12 years old. The data collected shows that the total number of primary school student who have the official age to remain in primary schools is 34,197. The indicators also show that 2% of them are under age to enrol in any primary school while 7% are overage.
The net enrolment ratio for primary education is 95 percent this year. The high net enrolment ratio indicates that the official primary school age population currently attending schools is very high.
Percentage distribution of Prim ary school students by Language of Instruction
A nglo pho ne Female
30%
A nglo pho ne M ale 33%
Franco pho ne M ale
19%
Franco pho ne Female
18%
Age group
M F M F M F M F M F M F M F M F M F T
3-4 45 41 0 2 0 0 0 0 0 0 0 0 0 0 0 0 45 43 88
5 285 271 5 7 2 0 0 0 0 0 0 0 0 0 0 0 292 278 570
6 1916 1770 155 184 6 6 0 1 0 0 0 0 0 0 0 0 2077 1961 4038
7 1107 949 1563 1531 116 132 6 15 2 1 0 0 0 0 0 0 2794 2628 5422
8 420 309 1050 992 1166 1208 135 146 13 11 3 3 0 0 0 0 2787 2669 5456
9 126 86 578 475 917 874 1005 1052 125 170 15 16 1 0 0 0 2767 2673 5440
10 25 19 185 150 553 466 1011 882 906 951 171 147 3 1 0 0 2854 2616 5470
11 8 6 44 42 225 189 567 438 835 811 913 881 23 12 0 1 2615 2380 4995
12 2 0 13 13 65 58 230 139 482 391 909 890 95 89 0 0 1796 1580 3376
13 1 1 2 0 23 12 64 47 171 131 419 341 193 201 16 12 889 745 1634
14 0 0 1 1 5 2 14 10 62 26 138 104 161 145 11 17 392 305 697
15 0 0 0 1 0 2 11 3 13 5 23 22 101 73 8 6 156 112 268
16 0 0 0 0 0 0 0 0 0 0 0 0 13 3 0 0 13 3 16
17 0 0 0 0 0 0 0 0 0 0 0 0 0 0 0 0 0 0 0
Total 3935 3452 3596 3398 3078 2949 3043 2733 2609 2497 2591 2404 590 524 35 36 19477 17993 37470 Année 5 Année 6 Année 7 Année 8
Année 1 Année 2 Année 3 Année 4
Graph 3: Primary enrolment – Official and unofficial ages
The pie graph above illustrates figures in table 3. This year the unofficial entry age has made a significant drop compare to the previous years.
Table 4: Total number of student by School Administration
The table above shows the number of primary students by type of school administration. The data collected shows that 75 percent of the student attended government primary schools followed by 16 percent in catholic schools, 5 percent in private schools, Protestant and SDA mission schools with 3 percent each and Bahai with 1 percent of students.
Graph 4: Percentage Distribution of Student by School Administration
As indicated in table 4, the churches play also an important role in the development of primary education. Catholic mission is one of the biggest school authorities, which
Percentage distribution of Students by School adm inistration
Govt. Eng 56% Govt. Fr.
18% Catholic
16%
Priv. Eng 4%
Priv. Fr. 1% Bahai
0% SDA
2% Prot.
3%
Province
Ang Fran. Catholic Prot. SDA Ang. Fran. Bahai Ang Fran. Total
Torba 1005 613 1005 613 1618
Sanma 3712 882 1485 602 165 411 4288 2969 7257
Malampa 3657 1206 1623 366 347 43 4047 3195 7242
Penama 3794 519 1167 39 17 3850 1686 5536
Shefa 5917 2101 656 267 736 246 6920 3003 9923
Tafea 3178 1250 1086 20 93 173 94 3538 2356 5894
Total 21263 6571 6017 988 911 1380 246 94 23648 13822 37470 Private Total Student in Primary
contributed a lot in our education development. According to the above pie graph, more students frequent government primary schools in the country.
Table 5: Total number of Primary School Student in Port-Vila and Luganville.
Out of the actual primary total enrolment, 19 percent of students enrolled in urban schools. The total number of primary school students is higher in Port-Vila because of the high number of population who live in town, 29,356 people. The Luganville town alone enrolled 31 percent of the total urban students.
Graph 5: Percentage distribution of students in Both Urban and Rural Schools
The above pie graph shows that 81 percent of students enroll in rural primary schools in the country. The 1999 Population census indicates that the population in the rural areas is higher than the total number of population who lived in the two towns.
Though 81 percent of the enrolment are from rural schools, the urban schools are known to over enroll students in each class due very high population demand for schooling.
Municipalities
M F M F M F M F M F M F M F M F M F T
Port-Vila 413 374 442 395 404 402 434 388 386 374 414 353 0 0 0 0 2493 2286 4779 Luganville 197 155 210 199 168 169 179 172 181 167 154 153 22 15 0 0 1111 1030 2141
Total 610 529 652 594 572 571 613 560 567 541 568 506 22 15 0 0 3604 3316 6920
Year 6 Year 7 Year 8
Year 1 Year 2 Year 3 Year 4 Total
Année 1 Année 2 Année 3 Année 4 Année 5 Année 6 Année 7 Année 8 Year 5
Total Percentage of Prim ary School Students in Port-Vila, Luganville and in the rural schools
Port-Vila 13%
Luganville 6%
Students in rural primary
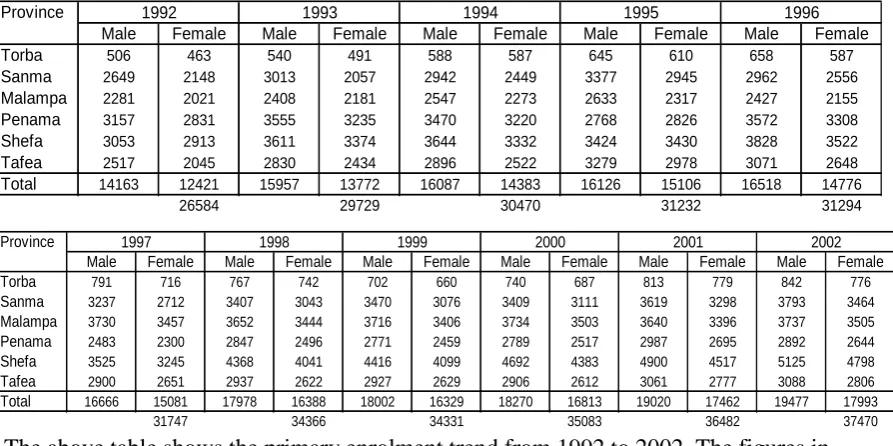
Table 6: Enrolment trend from 1992-2002
The above table shows the primary enrolment trend from 1992 to 2002. The figures in table 6 shows that the average rate of increase in primary enrolment from 1992 to 2002 is 4 percent. In 1993 there was a sudden increase with the intake of grade 1 students.
Graph 6: Primary School Enrolment Growth 1992-2002
The above line graph shows the annual increase of primary school students. The government should take note of the regular annual increase of primary school student to prepare a future development plan for the primary education system based on the actual school statistics.
Province
Male Female Male Female Male Female Male Female Male Female
Torba 506 463 540 491 588 587 645 610 658 587
Sanma 2649 2148 3013 2057 2942 2449 3377 2945 2962 2556 Malampa 2281 2021 2408 2181 2547 2273 2633 2317 2427 2155 Penama 3157 2831 3555 3235 3470 3220 2768 2826 3572 3308 Shefa 3053 2913 3611 3374 3644 3332 3424 3430 3828 3522 Tafea 2517 2045 2830 2434 2896 2522 3279 2978 3071 2648 Total 14163 12421 15957 13772 16087 14383 16126 15106 16518 14776
26584 29729 30470 31232 31294
1992 1993 1994 1995 1996
Province
Male Female Male Female Male Female Male Female Male Female Male Female
Torba 791 716 767 742 702 660 740 687 813 779 842 776
Sanma 3237 2712 3407 3043 3470 3076 3409 3111 3619 3298 3793 3464
Malampa 3730 3457 3652 3444 3716 3406 3734 3503 3640 3396 3737 3505
Penama 2483 2300 2847 2496 2771 2459 2789 2517 2987 2695 2892 2644
Shefa 3525 3245 4368 4041 4416 4099 4692 4383 4900 4517 5125 4798
Tafea 2900 2651 2937 2622 2927 2629 2906 2612 3061 2777 3088 2806
Total 16666 15081 17978 16388 18002 16329 18270 16813 19020 17462 19477 17993
31747 34366 34331 35083 36482 37470
2000 2001 2002
1997 1998 1999
Prim ary Enrolm ent Trend from 1992-2002
0 5000 10000 15000 20000 25000 30000 35000 40000
1992 1993 1994 1995 1996 1997 1998 1999 2000 2001 2002
Table 7: Total number of primary repeaters by province, 2002
The total of repeaters has decreased to 39 percent this year compare to the total number of repeaters in primary schools last year. It shows that Primary schools are discouraging repeater intake. It is a good start and the primary section should continue to promote official obligatory school entry age.
Table 8: Total number of dropouts by province, 2002
The above table shows the total number of dropouts by province and by year level. Out of the overall total number of Primary school students, only 2 percent are dropouts from class 1 to Year 8 top-up. The indicators also show that 57 percent out of the total dropouts are males and 43 females.
Province
M F M F M F M F M F M F M F M F Male Female Total
Torba 31 25 13 4 11 6 6 1 8 4 0 0 0 0 0 0 69 40 109
Sanma 118 77 80 52 93 53 50 35 50 33 35 47 1 0 0 0 427 297 724
Malampa 109 69 73 49 45 44 45 33 72 52 47 34 0 0 1 1 392 282 674
Penama 77 59 43 31 45 30 30 21 34 24 28 17 0 0 0 0 257 182 439
Shefa 98 79 63 51 42 33 43 27 12 10 24 26 2 1 0 0 284 227 511
Tafea 146 122 98 80 88 70 77 44 45 32 41 49 0 0 0 0 495 397 892
Total 433 309 272 187 236 166 174 117 176 123 134 124 3 1 1 1 1429 1028 2457
Total Class 5 Class 6 Class 7 Class 8
Class 1 Class 2 Class 3 Class 4
Province
M F M F M F M F M F M F M F M F Male Female Total
Torba 0 0 1 0 3 1 3 0 4 3 3 9 2 3 0 0 16 16 32
Sanma 14 10 3 6 4 7 4 6 6 8 24 24 1 1 0 0 56 62 118
Malampa 10 5 6 4 4 2 3 4 9 2 48 33 9 10 3 0 92 60 152
Penama 12 7 4 1 3 4 8 3 5 2 21 9 11 6 0 0 64 32 96
Shefa 28 24 5 2 7 9 12 9 3 6 27 21 8 7 0 0 90 78 168
Tafea 18 12 5 11 9 3 5 9 8 9 27 28 0 0 0 0 72 72 144
Total 64 46 19 13 21 23 30 22 27 21 123 96 31 27 3 0 318 248 566 Class 8 Total Class 5 Class 6 Class 7
Section III:
Top-Up School’s Information
This section’s information will be illustrated using tables and graphs
Table 1: Total number of top-up schools .
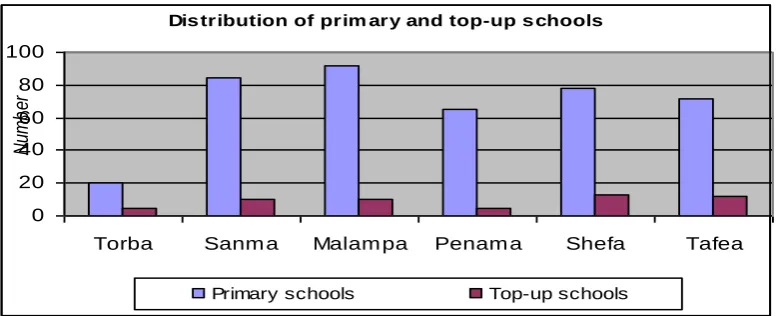
The above table shows the total number of top-up schools in the country. As indicated in the above table, there are top-up schools in all the six provinces.
The top up schools initiative was started this year to enrol students who are unfortunate to continue into junior secondary schools to continue with lifeskills programmes. There is a total of 55 top up schools of which 39 are Anglophone and 16 francophone schools.
Graph 1: Bar graph showing the total number of primary schools and top-up schools in the country.
The top up schools initiative was introduced in selected schools seen to be in central location of feeder primary schools and with strong community support
Proper curriculum and teacher training is required of the Ministry of Education to develop and implement urgently to ensure the quality provisions.
Province
Year 7 Year 8 Total Year 7 Year 8 Total Year 7 Year 8 Total
Torba 2 1 3 2 0 2 4 1 5
Sanma 6 1 7 3 0 3 9 1 10
Malampa 7 0 7 3 0 3 10 0 10
Penama 5 0 5 0 0 0 5 0 5
Shefa 9 1 10 3 0 3 12 1 13
Tafea 6 1 7 5 0 5 11 1 12
Total 35 4 39 16 0 16 51 4 55
Anglophone Schools Francophone Schools Total
Dis tribution of prim ary and top-up s chools
0 20 40 60 80 100
Torba Sanm a Malam pa Penam a Shefa Tafea
N
um
b
er
Table 2: Total number of Student in Year 7 and Year 8 Top-Up schools.
Total top up enrolment is 1191of which 94% enrolled Year 7and 6% in year 8. This total is expected to continue in 2003 in year 8. Some schools have introduce the top up classes in year 2001 therefore the year 8 enrolment this year is 71. It is anticipated that by the time students graduated from the top up schools they will be 14 to 15 years old and therefore able to fit into the communal activities.
Graph 2: Percentage distribution of Top-up school students by province
The Pie graph shows the distribution of enrolment by province. Shefa province top the table with 26% of students followed by Tafea province 25% of student, Malampa 18%, Sanma 15%, Penama and Torba province with 8 % of the enrolment.
Table 3: Total number of Teachers who teach in Top-up Schools
Province Total Total Total
Male Female Male Female Male Female Male Female Male Female Male Female
Torba 24 23 7 3 57 21 21 0 0 42 45 44 7 3 99
Sanma 57 52 1 2 112 38 28 0 0 66 95 80 1 2 178
Malampa 73 56 0 0 129 45 35 0 0 80 118 91 0 0 209
Penama 47 53 0 0 100 0 0 0 0 0 47 53 0 0 100
Shefa 111 97 11 19 238 38 30 0 0 68 149 127 11 19 306
Tafea 74 90 16 12 192 62 45 0 0 107 136 135 16 12 299
Total 386 371 35 36 828 204 159 0 0 363 590 530 35 36 1191
757 71 363 0
Year 7 Year 8 Total
Year 7 Year 8 Year 7 Year 8
Anglophone Students Francophone Students
Percentage distribution of top-up school students by province
Torba
8% Sanma
15%
Malampa 18% Penama
8% Shef a
26% Taf ea
25%
Torba Sanma Malampa Penama Shef a Taf ea
Province Total Total Total
Male Female Male Female Male Female Male Female Male Female Male Female
Torba 1 1 1 0 3 1 1 0 0 2 2 2 1 0 5
Sanma 4 2 1 0 7 1 2 0 0 3 5 4 1 0 10
Malampa 4 3 0 0 7 0 0 0 0 0 4 3 0 0 7
Penama 3 2 0 0 5 0 0 0 0 0 3 2 0 0 5
Shefa 5 4 1 0 10 1 2 0 0 3 6 6 1 0 13
Tafea 3 3 0 1 7 1 4 0 0 5 4 7 0 1 12
Anglophone Teachers Francophone Teachers Total
This Table shows the selected number of primary school teachers teaching in top up school. Though they have not been given any training, these teachers are known to be teaching modified year 7 secondary school syllabus in the top up schools. The
Ministry of Education needs therefore to provide training and appropriate teaching materials for both teachers and students
Section VI:
Primary School teacher’s Information
The last part of this report will be also illustrated using tables and graphs:
This year the total number of primary school teachers is 1532 Most of the primary school teachers are graduates with Basic Education Teaching Certificate (BETC) from the Vanuatu Institute of Teacher education (VITE) and few graduates from other institutions.
Table 1: Total number of Primary school teacher’s by Province and by Sex.
The above table shows the total number of year 1 to 6 primary school teachers. Note that these figures do not include top up schoolteachers. The total number of primary school teachers distributed by gender shows that there are more female teachers this year. Data collected indicated that 53 percent are female teachers and 47 percent are male teachers.
Graph 1: Percentage distribution of Primary school teachers by province
The above pie graph shows the distribution percentage of primary school teachers by province. The data collected shows that Shefa province has 25% of teachers followed
Province
Male Female Total
Torba 33 33 66
Sanma 123 195 318
Malampa 158 130 288
Penama 136 127 263
Shefa 140 244 384
Tafea 131 82 213
Total 721 811 1532
Primary school teachers
Percentage distribution on the num ber of Prim ary school teachers by province
Torba
4% Sanma
21%
Malampa 19% Penama
17% Shefa
25%
by Sanma province with 21% of teachers, Malampa province 19%, Penama 17%, Tafea 14 % and Torba province with 4 percent of primary school teachers.
The reason why the two provinces, Shefa and Sanma have high percentage of primary school teachers is because of the existing number of classes in Port-Vila and
Luganville.
Table 2: Percentage of Primary school teachers with Teaching Qualification
The above table shows the total number of trained primary school teachers by
province. The figures collected indicate that 78 percent of primary school teachers are trained. The figures in the above table also show that 57 percent out of the total number of trained teachers are Anglophone and 43 percent are francophone-trained teachers.
Statistically, the total percentage of primary schools trained teachers’ show that the teaching force improved a lot since 1999 in terms of teacher qualification. The the distribution of trained teachers have increased in all the provinces, Malampa alone have shown a drop from 243 to 227 in 2002.
Table 3: Primary school Student/ Teacher Ratio
The above table shows that the average student/teacher ratio is 24:1. Non of the schools is fully complying with the official ratio 30:1. We note however the disparities due to high population growth in the urban and sub-urban areas and the geographical location of some schools. The average is about within the range of the minimum ratio.
Province Total primary %
Anglophone Francophone Total Teachers Qualify teachers
Torba 30 21 51 66 77
Sanma 120 107 227 318 71
Malampa 109 118 227 288 79
Penama 115 64 179 263 68
Shefa 214 116 330 384 86
Tafea 88 86 174 213 82
Total 676 512 1188 1532 78
Trained teachers
Province Total number Total number Student/Teacher
students of Teachers ratio
Torba 1592 66 24
Sanma 6917 318 22
Malampa 7036 288 24
Penama 5682 263 22
Shefa 9417 384 25
Tafea 5838 213 27
Table 4: Primary school teacher’s Status
The above table shows the teaching Status of primary school teachers. The distribution of primary school teachers shows that 62 percent are permanent teacher, 16 percent are on Probation and 22 percent are voluntary teachers. The Permanent and Probation teachers are automatically categorised as trained teachers according to their teaching qualification. The Government directly pays them whereas the voluntary teachers are paid either by an NGO or by the school council.
The data collected shows also that the total number of voluntary teachers is higher than the total number of probation teachers this year. The reason is that the majority of voluntary teachers teach in the private primary schools.
Table 5: Primary school teacher’s paid under different school Authorities.
The above table shows the distribution of primary school teachers who are paid by different school authorities. The data collected shows that 72 percent of the primary school teachers are paid by the Vanuatu government, 6 percent are paid by the Missions and 22 percent of primary teachers are paid by others (school council, NGOs).
Province
Permanent Probation Voluntary Total
Torba 37 19 10 66
Sanma 181 43 94 318
Malampa 189 34 65 288
Penama 145 38 80 263
Shefa 289 55 40 384
Tafea 106 52 55 213
Total 947 241 344 1532
Primary school teacher's status
Province Government Mission Others Total
Torba 54 0 12 66
Sanma 213 30 75 318
Malampa 208 14 66 288
Penama 170 25 68 263
Shefa 291 11 82 384
Tafea 162 10 41 213
Conclusion:
According to the analysis, the Primary Education needs to increase the number of Primary schools in the Country due to the regular increase on the number of new intakes in grade 1. This year 23% of the voluntary teachers is not trained. The Ministry has to organise training to enhance their teaching skills. Similarly, top-up teachers have to be given proper training to teach the modified secondary syllabus. The Analysis also indicates that the total number of primary school student’s enrolment is randomly increasing by 3 percent annually. This resolve that the
Ministry has to prepare future plans to increase the number of schools and teachers in year.
Recommendation:
Here is some recommendation base on the analysis of this report:
Reduce disparity between the Number of Anglophone and Francophone students proportionally.
That the primary schools should continue to discourage the system of repetition in the schools. The data collected shows that the number of repeaters by grades has dropped this year.
That the Ministry should endorse proper curriculum material for top-up schools barring in mind that the student who actually enrolled in the Community Secondary Day Schools are dropouts.
That the Ministry should prepare a proper selection criteria to cater for Year 8 top-up best student who can continue to Year 9 Secondary.
That the Ministry should trained the top-up schoolteachers according to the specific teaching programs allocated for the Community Secondary Day Schools. That the primary schools have to fully comply with the official student teacher
ration 1:30. (The average student/teacher for Primary schools is 24:1). The Ministry must:
Review teachers posting Review Teachers status Review teachers salaries
List of Primary Schools by Province
Primary Schools in Torba Province
Primary Schools in Sanma Province
Anglophone Schools Male Female Total Male Female Total School Administration
Aota/ Tasvare 18 13 31 0 2 2 Government
Dorig/ Sarantar 23 11 34 1 1 2 Government
Lequel/ Vaes 16 18 34 1 0 1 Government
Losalava 60 75 135 3 2 5 Government
Martin/Hiu 13 20 33 1 0 1 Government
Noguhu/ Robin 26 29 55 2 0 2 Government
Sanlang 96 78 174 2 3 5 Government
Shem Roley 35 26 61 0 3 3 Government
St. George/ Pasalele 70 72 142 5 3 8 Government
Telhei 64 62 126 3 4 7 Government
Bagavegug 32 48 80 2 2 4 Government
Vaget/ Aworor 24 26 50 2 2 4 Government
Vales 26 24 50 0 0 0 Government
Francophone Schools
Arep 60 54 114 4 2 6 Government
Nergar 46 37 83 3 1 4 Government
Santa Maria 78 56 134 4 1 5 Government
Telvet 25 18 43 0 2 2 Government
Vaget/ Aworor 22 18 40 1 1 2 Government
Wonyeskei 81 60 141 1 5 6 Government
Wosok 27 31 58 1 1 2 Government
Enrolment Teachers
Anglophone Schools Male Female Total Male Female Total School Administration
Alowaru 24 18 42 2 1 3 Government
Araki 21 11 32 0 1 1 Government
Avunarara/ Jinaure 73 64 137 1 3 4 Government
Avunatari 96 68 164 2 5 7 Government
Balon 22 23 45 1 2 3 Government
Banban 31 43 74 2 1 3 Government
Dombulu/ Tutuba 61 56 117 2 1 3 Government
Ian Livo 19 14 33 2 0 2 Government
Ieth Vekar 42 31 73 1 2 3 Government
J.N Mackenzie 46 65 111 2 1 3 Government
Jordan Valley 6 6 12 0 2 2 Government
Kamewa 158 136 294 1 7 8 Government
Kitacu 23 24 47 4 0 4 Government
Lehilehina 18 12 30 1 2 3 Government
Leimarua/ Wusi 15 13 28 3 0 3 Government
Malau 22 26 48 1 2 3 Government
Mavea/ Dabulu 16 11 27 0 2 2 Government
Menevula/ Wunpuko 31 46 77 3 2 5 Government
Merei/Mamara 46 44 90 2 2 4 Government
Nanuhu 49 36 85 3 3 6 Government
Nasalanvunmol 59 46 105 0 3 3 Government
Natawa 76 72 148 5 2 7 Government
Navele 26 27 53 3 1 4 Government
Pialuplup 46 48 94 2 1 3 Government
Vuth-eiv Prenter/ Hog Harbour 87 73 160 1 4 5 Government
Santo East 186 222 408 3 10 13 Government
Sara 48 45 93 3 2 5 Government
Sarakata 117 100 217 0 7 7 Government
Selusia 28 26 54 2 0 2 Government
Sulemaori 27 24 51 0 2 2 Government
Taharo 32 35 67 3 3 6 Government
Tanovusivusi/ Saletui 86 58 144 2 2 4 Government
Tata 127 96 223 2 5 7 Government
Tiasia 22 17 39 1 1 2 Government
Tiqotuq 19 14 33 0 2 2 Government
Vovlei 31 26 57 1 3 4 Government
Vunabulu 27 20 47 1 2 3 Government
Wailapa/ Ebenezer 71 69 140 2 4 6 Government
Lath Hi 7 6 13 0 1 1 Government
Francophone Schools
Butmas 32 32 64 1 2 3 Government
Kamewa 145 118 263 3 11 14 Government
Kole/Loreviakarkar 38 33 71 1 2 3 Government
Nandiutu 30 21 51 3 0 3 Government
Naviaru 27 23 50 0 1 1 Government
Piamatsina 16 9 25 2 1 3 Government
Santo East 109 100 209 3 5 8 Government
Sarasoari/ Avunarani 39 43 82 1 3 4 Government
Selusia 14 8 22 0 1 1 Government
St Jacques 20 25 45 1 2 3 Government
Catholic Schools
Fanafo 107 126 233 4 5 9 Catholic
Navusiroro/ Big Baie 35 43 78 1 1 2 Catholic
Pesena 21 37 58 2 0 2 Catholic
St Joseph/ Rowok 18 17 35 0 1 1 Catholic
St Michel 89 62 151 1 5 6 Catholic
St Pierre/ Okoro 63 51 114 1 4 5 Catholic
Ste Anne 148 132 280 5 8 13 Catholic
Ste Thérèse 237 229 466 3 16 19 Catholic
Tolomako 36 34 70 1 2 3 Catholic
Catholic Protestant Schools
Ipayato 51 46 97 4 1 5 Protestant
Marua 11 4 15 1 0 1 Protestant
Mataloi 40 30 70 2 1 3 Protestant
Malores 14 10 24 0 1 1 Protestant
Namoru 59 41 100 3 1 4 Protestant
Niwa 5 0 5 0 1 1 Protestant
Puama / Porema 18 13 31 1 2 3 Protestant
Tasmalum 63 44 107 2 3 5 Protestant
Tcharanavusvus 34 30 64 3 0 3 Protestant
Valabei 5 5 10 2 0 2 Protestant
Venie/ Mataipevu 17 32 49 1 2 3 Protestant
Primary Schools in Malampa Province
SDA Schools
Amabelau/ Mati 16 16 32 1 1 2 SDA
Paker 18 17 35 0 1 1 SDA
Sarakata 52 46 98 4 2 6 SDA
Private Schools
Banaviti 28 20 48 2 2 4 Private
Bernier Bay 21 15 36 1 2 3 Private
Loreviko Community 18 19 37 0 4 4 Private
Manahi 11 16 27 0 4 4 Private
Mwas 33 26 59 0 0 0 Private
Nemero 0 0 0 0 4 4 Private
Rowani 25 24 49 3 1 4 Private
Turtle Bay (Anglican) 30 18 48 0 0 0 Private
Valpei 14 30 44 1 2 3 Private
Winsao 14 19 33 1 2 3 Private
Pepsi 15 15 30 0 0 0 Private
Anglophone Schools Male Female Total Male Female Total School Administration
Amelvet 63 50 113 2 1 3 Government
Aulua 83 57 140 2 2 4 Government
Benbon 49 42 91 0 1 1 Government
Brenwei 79 69 148 3 3 6 Government
Bulemap 32 27 59 1 1 2 Government
Daodobo/ Metetuwai 18 18 36 1 1 2 Government
Farun/ Kalwai 28 34 62 2 1 3 Government
Laindua 42 42 84 1 0 1 Government
Lakatoro 76 75 151 4 2 6 Government
Lambubu 71 65 136 2 2 4 Government
Leleut 17 8 25 2 0 2 Government
Leviamp 48 50 98 3 1 4 Government
Lingarack 83 73 156 3 4 7 Government
Liro 50 48 98 1 3 4 Government
Luvil 16 22 38 1 0 1 Government
Lowoi 56 47 103 3 2 5 Government
Mae Sirbulbul 11 7 18 1 0 1 Government
Magam 60 65 125 0 0 0 Government
Matanvat 38 41 79 3 1 4 Government
Mbossung 69 68 137 3 2 5 Government
Megamone 31 32 63 2 2 4 Government
Melworbank 28 26 54 1 1 2 Government
Namaru 20 27 47 1 1 2 Government
Neramb 64 60 124 2 2 4 Government
Pinabow 27 27 54 2 0 2 Government
Ranon 56 55 111 2 2 4 Government
Rensarie /Tembibi 40 52 92 3 0 3 Government
Sanesup 42 34 76 3 1 4 Government
Sangalai 105 103 208 5 2 7 Government
Selusa/ Tahi 29 18 47 1 0 1 Government
Senai 73 74 147 4 0 4 Government
South West Bay 48 62 110 2 4 6 Government
Tautu 87 66 153 4 3 7 Government
Tisman 73 69 142 6 0 6 Government
Vukof-Maur (Tisvel) 12 8 20 1 0 1 Government
Uripiv 38 43 81 2 4 1 Government
Vanruru/ Hokai 14 14 28 1 0 6 Government
Vauleli 33 13 46 1 0 1 Government
Vinmavis 22 20 42 2 0 1 Government
Wora 24 19 43 2 1 2 Government
Wuro 33 39 72 4 0 3 Government
Francophone Schools
Amelbila/ Vellow 38 53 91 1 2 3 Government
Aulua 23 27 140 1 1 2 Government
Baie Caroline 52 46 98 0 4 4 Government
E.P Botovro 36 32 68 0 2 2 Government
Butekai 10 9 19 1 0 1 Government
Daodobo 11 11 22 2 0 2 Government
Fanla 26 38 64 2 1 3 Government
Faralo 20 27 47 2 0 2 Government
Kamai 74 81 155 3 3 6 Government
Lehili 49 44 93 2 2 4 Government
Lolibulo 28 27 55 1 1 2 Government
Norsup 92 83 175 1 6 7 Government
Port Vato 62 50 112 3 2 5 Government
Rensarie 33 44 77 1 1 2 Government
Wilak 53 27 80 4 0 4 Government
Catholic Schools
Craig-Cove 20 18 38 1 1 2 Catholic
Dixon Reef 19 13 32 0 1 1 Catholic
Mae 23 25 48 1 1 2 Catholic
Notre-Dame 189 171 360 5 7 12 Catholic
Olal (St Jean) 73 62 135 4 2 6 Catholic
Paamal 23 13 36 0 0 0 Catholic
Pikayer 6 11 17 1 0 1 Catholic
Sessivi 48 43 91 2 3 5 Catholic
St Louis 48 44 92 3 1 4 Catholic
St Pierre Chanel 126 113 239 3 7 10 Catholic
Tobol 31 19 50 2 0 2 Catholic
Unmet 112 91 203 3 4 7 Catholic
Primary Schools in Penama Province Protestant Schools
Benenaveth 18 12 30 1 1 2 Protestant
Bethel 5 4 9 0 1 1 Protestant
Chenard 54 39 93 3 4 7 Protestant
Metoune 7 11 18 1 0 1 Protestant
Nambar 20 17 37 0 1 1 Protestant
Orap 33 24 57 1 1 2 Protestant
Rambeck 10 11 21 1 1 2 Protestant
Rory 9 13 22 0 1 1 Protestant
Semboas 2 12 14 0 1 1 Protestant
Wiaru 15 11 26 1 1 2 Protestant
Womul 19 20 39 0 1 1 Protestant
SDA Schools
Fonteng 4 10 14 0 1 1 SDA
Baiap 12 12 24 0 2 2 SDA
Lalinda 14 17 31 0 1 1 SDA
Lavalsal 15 14 29 1 2 3 SDA
Linbul 22 9 31 2 2 4 SDA
Lonmel 16 24 40 1 0 1 SDA
Malua Bay 16 14 30 2 0 2 SDA
Maranatha 16 18 34 1 0 1 SDA
Sanesup 25 26 51 1 1 2 SDA
Topaen 23 15 38 1 0 1 SDA
Winn 12 13 25 1 1 2 SDA
Private School
Roromai 21 22 43 1 1 2 Private
Anglophone Schools Male Female Total Male Female Total School Administration
Abanga 30 33 63 1 2 3 Government
Aligu 47 29 76 2 3 5 Government
Ambaebulu 90 74 164 2 5 7 Government
Atavtabanga 93 87 180 3 4 7 Government
Autabulu 72 65 137 4 2 6 Government
Bakanao 37 27 64 3 1 4 Government
Bangabulu 46 42 88 4 0 4 Government
Benmotri 40 33 73 2 3 5 Government
Bwatnapni 47 49 96 2 2 4 Government
Enkul 29 25 54 0 3 3 Government
Gamalmawa 45 58 103 2 4 6 Government
Gambule 85 116 201 4 3 7 Government
Labultamata 27 23 50 1 2 3 Government
Lesasanemal 57 42 99 4 1 5 Government
Lolkasai 50 55 105 2 4 6 Government
Lolovoli 41 25 66 3 0 3 Government
Loquirutaro 50 42 92 3 2 5 Government
Mackenzie 79 70 149 2 4 6 Government
Naleleo 47 38 85 3 1 4 Government
Nangole/ Raynold Memorial 51 51 102 4 1 5 Government
Naone/ Lamoute 33 39 72 2 3 5 Government
Nazareth / Lini 140 133 273 1 13 14 Government
NduiNdui 82 82 164 2 5 7 Government
Pangi 44 41 85 2 1 3 Government
Quatui/ Lovunvilli 56 48 104 4 2 6 Government
Quatuneala 64 59 123 5 1 6 Government
Ranmawat 45 44 89 2 2 4 Government
Ranwas/ Manu 11 11 22 0 2 2 Government
Simon 52 57 109 4 0 4 Government
Sulua 42 29 71 1 2 3 Government
Tamua 29 27 56 0 3 3 Government
Tanbok 55 50 105 5 1 6 Government
Torlie 65 58 123 2 4 6 Government
Vanmanla 22 13 35 1 1 2 Government
Vanue Marama 23 26 49 2 0 2 Government
Volovuhu 24 13 37 1 1 2 Government
Vuigalato 46 32 78 2 2 4 Government
Waisine 25 22 47 3 0 3 Government
Walaha 51 54 105 2 2 4 Government
Francophone Schools
Ambaebulu 18 16 34 1 1 2 Government
Biribiri 13 15 28 1 1 2 Government
Gadue Garea 33 18 51 1 1 2 Government
Lamoruntoa/Abouaga 18 22 40 2 1 3 Government
Nanivele 21 17 38 2 0 2 Government
Narouah 14 9 23 1 1 2 Government
Nasawa 39 42 81 0 5 5 Government
Sarabulu 33 32 65 2 1 3 Government
Vilakalaka 26 23 49 1 1 2 Government
Vinamangwe / Ngwalona 26 22 48 2 1 3 Government
Vanmamla 32 30 62 1 0 1 Government
Catholic Schools
Baie-Barrier 41 42 83 1 3 4 Catholic
Baie-Martellie 34 25 59 1 1 2 Catholic
Lalzadeth 28 24 52 1 1 2 Catholic
Latano 42 40 82 2 1 3 Catholic
Lolopuepue 64 57 121 4 2 6 Catholic
Lo-one 32 39 71 3 1 4 Catholic
Melsisi 138 122 260 3 8 11 Catholic
Nangire /St J.Baptist 37 29 66 2 1 3 Catholic
Namaram 52 44 96 3 2 5 Catholic
St Henri / Lonvis 24 16 40 3 0 3 Catholic
St Joseph/ Rangsuksuk 34 47 81 4 0 4 Catholic
Tsinbwege 60 52 112 2 3 5 Catholic
Primary Schools in Shefa province
SDA School
Vinambulu 21 18 39 1 1 2 SDA
Private Schools
Navitora/ Vatumauri 15 2 17 1 1 Private
Anglophone Schools Male Female Total Male Female Total School Administration
Akama 53 53 106 4 3 7 Government
Amaro/ Lelepa 27 28 55 2 1 3 Government
Black Sands 17 27 44 0 2 2 Government
Buninga/ Senecol 26 18 44 1 1 2 Government
Central Primary 203 154 357 2 10 12 Government
Coconak 40 35 75 2 0 2 Government
Ekipe 58 22 80 0 2 2 Government
Ekonak 51 57 108 2 2 4 Government
Eles 54 61 115 2 4 6 Government
Erakor 79 65 144 4 2 6 Government
Eratap 77 65 142 3 2 5 Government
Ere 73 61 134 1 4 5 Government
Eton 69 70 139 3 3 6 Government
Fresh-Wota 225 217 442 6 14 20 Government
Hiwelo 33 25 58 2 1 3 Government
Ifira 68 65 133 1 3 4 Government
Kawenu 156 143 299 1 7 8 Government
Lamenu 51 65 116 2 3 5 Government
Lausake 48 68 116 2 2 4 Government
Ngala/Maganua 53 42 95 2 2 4 Government
Mabfilau 36 36 72 2 2 4 Government
Makira 14 16 30 2 0 2 Government
Malatia 25 27 52 1 1 2 Government
Mangarongo 67 67 134 4 1 5 Government
Manua 113 107 220 2 5 7 Government
Matarara 16 19 35 1 0 1 Government
Mataso 8 12 20 1 1 2 Government
Melemaat 156 152 308 4 7 11 Government
Moriu 14 10 24 0 1 1 Government
Moso/ Tasiriki 22 24 46 2 0 2 Government
Nalema 28 28 56 1 0 1 Government
Naworaone 57 57 114 2 3 5 Government
Nikaura 62 66 128 3 1 4 Government
Noaiwia/ Malaliu 38 36 74 2 1 3 Government
Nofo 68 56 124 3 2 5 Government
Nottage 65 50 115 2 2 4 Government
Pango 79 83 162 4 4 8 Government
Pang Pang/ Ensorbal 13 10 23 0 1 1 Government
Erangorango 3 11 14 1 1 2 Government
Sara 32 25 57 2 0 2 Government
Sikembo 54 33 87 1 0 1 Government
Tangovawia 36 26 62 2 1 3 Government
Ulei 34 26 60 1 1 2 Government
Utanlang/Amaronea 11 9 20 1 1 2 Government
Vila East 189 174 363 1 11 12 Government
Vila North 273 261 534 4 15 19 Government
Yevali 48 74 122 2 2 4 Government
Tanoliu 30 29 59 0 1 1 Government
Francophone Schools
Anabrou 197 181 378 4 10 14 Government
Bongoviu 40 42 82 0 3 3 Government
Burumba 39 28 67 0 3 3 Government
E.P Black Sands 21 15 36 1 1 2 Government
E.P Centre Ville 174 169 343 1 11 12 Government
E.P Erakor 45 45 90 2 2 4 Government
E.P Ifira 42 47 89 3 1 4 Government
E.P Itakuma/ Lekanone 49 48 97 3 1 4 Government
E.P Katundaula 54 46 100 2 3 5 Government
E.P Malawia/ Mangarisu 21 23 44 1 1 2 Government
E.P Matarisu 42 39 81 2 2 4 Government
E.P Roau/ Magaliliu 20 10 30 1 1 2 Government
E.P Suango 60 69 129 2 3 5 Government
E.P Worarana 28 34 62 1 2 3 Government
Fresh-Wota 122 124 246 4 4 8 Government
Pango/ Esnar 120 107 227 4 5 9
Catholic Schools
Ste Jeanne d'Arc 254 240 494 3 15 18 Catholic
St Joseph Lagon 2 99 63 162 1 4 5 Catholic
SDA Schools
Port Quimmie 45 43 88 2 4 6 SDA
Vila No SDA 92 87 179 5 0 5 SDA
Private Anglophohe
Child Care Centre 52 48 100 0 4 4 Private
NTM (Ang) (n/a) 30 31 61 0 7 7 Private
Havsigai 30 24 54 2 2 4 Private
Peter Pan International 59 49 108 0 4 4 Private
Port Vila Survival 77 68 145 2 3 5 Private
Tumaropa (closed) 6 16 22 0 1 1 Private
Vila International 75 68 143 2 2 4 Private
Agathis Christian School 53 50 103 1 2 3 Private
Private Francophone
NTM (Fr) (n/a) 30 34 64 0 7 7 Private
Anglophone Schools Male Female Total Male Female Total School Administration
Analgauhat 50 53 103 4 2 6 Government
Dillon's Bay 45 34 79 2 1 3 Government
Dip Point 81 90 171 5 2 7 Government
Fetukai 94 49 143 3 2 5 Government
Green Hill 39 33 72 2 2 4 Government
Iarkei/ Petros 67 65 132 3 1 4 Government
Ietap 51 51 102 0 0 0 Government
Iquarmanu 46 60 106 3 1 4 Government
Irumori 37 31 68 2 1 3 Government
Isaka 44 42 86 2 0 2 Government
Isangel 113 98 211 3 2 5 Government
Ishia 56 52 108 4 3 7 Government
Isla 22 26 48 1 0 1 Government
Iwunmit 61 39 100 2 0 2 Government
Kamahau 33 35 68 3 2 5 Government
Kwamera 90 82 172 1 0 1 Government
Lamkail 102 91 193 6 0 6 Government
Lenakel 87 67 154 2 5 7 Government
Lenaken 49 44 93 4 2 6 Government
Loukatai 69 68 137 2 0 2 Government
Lounabil 31 23 54 3 2 5 Government
Lounahunu 56 60 116 2 1 3 Government
Lounapiko 56 52 108 3 1 4 Government
Lounialu 33 17 50 4 0 4 Government
Lousula 20 23 43 1 1 2 Government
Port Narvin 55 68 123 2 3 5 Government
Por Resolution 42 33 75 1 1 2 Government
Tapisi 28 19 47 2 0 2 Government
Tuhu 96 76 172 5 0 5 Government
Umponielogie 29 15 44 1 1 2 Government
Francophone Schools
Dillon's Bay 22 19 41 0 1 1 Government
Ehniu 37 41 78 2 1 3 Government
Imanaka 6 10 16 0 1 1 Government
Isangel 86 74 160 1 5 6 Government
King's Cross 48 56 104 3 1 4 Government
Labongtaua 19 11 30 0 1 1 Government
Lamanapiepi 12 8 20 0 1 1 Government
Lamanaruan 34 30 64 0 1 1 Government
Lamapruan 36 28 64 2 1 3 Government
Lamnatou 56 67 123 2 4 6 Government
Lapkit 26 19 45 1 1 2 Government
Launalang 37 48 85 2 1 3 Government
Lenaken 12 19 31 1 1 2 Government
Lounipayeu 24 27 51 2 0 2 Government
Lowiepeng 27 25 52 1 1 2 Government
Lowieru 31 26 57 2 0 2 Government
Manuapen 9 11 20 0 1 1 Government
Nafuti 10 13 23 0 0 0 Government
Port Melou 33 23 56 1 1 2 Government
Yanamwakel 33 22 55 1 1 2 Government
Yapilmai 33 42 75 3 0 3 Government
Catholic Schools
Enkatalei 42 30 72 3 0 3 Catholic
Ikiti 50 65 115 3 1 4 Catholic
Imafen 32 31 63 3 0 3 Catholic
Imaki 85 85 170 3 4 7 Catholic
Imaru 36 52 88 2 1 3 Catholic
Ipekel 14 9 23 1 0 1 Catholic
Itaku 22 15 37 1 0 1 Catholic
Lamlu 47 53 100 2 3 5 Catholic
Lautapunga 31 28 59 2 1 3 Catholic
Loono 60 51 111 1 4 5 Catholic
Lowanatom 77 67 144 3 3 6 Catholic
Umej 19 16 35 1 0 1 Catholic
Yenavateng 38 31 69 2 1 3 Catholic
SDA Schools
Kwataparen 39 36 75 2 3 5 SDA
Laukaru 14 4 18 0 1 1 SDA
Protestant School
Yatukune 12 8 20 0 1 1 Protestant
Bahai School
Iavenkula 52 42 94 3 1 4 Bahai
Private Schools
Christian Community school (AOG) 38 28 66 1 1 2 Private
Enarauia 21 15 36 2 1 3 Private
Tafea AOG Christiian School 20 10 30 0 4 4 Private
Primary School Statistical Questionnaire
STATISTICS QUESTIONNAIRE
PRIMARY EDUCATION
YEAR 2002
I. IMPORTANT NOTE
Policy and Planning Services is sending you three copies of 2002 statistical questionnaires which 2 copies must be completed and returned to Your Provincial Education Office before 30th May 2002, one copy must be kept by the school for reference. To avoid inaccurate data or not adhering to time set which may lead to disciplinary action teachers filling the forms are advised to ensure data is accurate and handed in on time.
If you have any queries concerning the questionnaire, please contact Ms Fabiola Bibi by Telephone: 22 309,
Fax 22 849 or your Provincial Education Officer.
II. GENERAL INFORMATION:
1. Name of School:
Island:
Province:
Establishment Year:
(New schools only)
2. Medium of Instruction:
English: French: please tick in the boxes
3. Affiliation/ Administration (tick)
Government
Catholic
Protestant
SDA
Presbyterian
Other specify ---
III. ENROLMENT:
1. Grouping of Students by Age, Sex and Grade
Please make sure your figures are accurate.
2. Attrition:
Repeaters, Dropouts, Transfers in/out, Boarders, D.Boarders Age
M F M F M F M F M F M F M F M F M F T
4 5 6 7 8 9 10 11 12 13 14 15
Total
Grade 5 Grade 6 Total
Grade 1 Grade 2 Grade 3 Grade 4 Grade 7 Grade 8
M F M F M F M F M F M F M F M F M F T
Repeaters Dropouts 2001 Transfers in Transfers out Boarders D.Boarders
Total
Grade 5 Grade 6 Total
IV. STAFFING:
Name of Head Teacher:
Non Teaching: Yes No
Please give the total number of Teachers in your school: Male Female
How many teachers are qualify to teach (eg: VTC certificate): Male Female
How many of them are: Permanent Probation Voluntary
How many of them are paid by: Government Mission School Committee
Other
Applicable to new teachers only. (Probation Teachers posted in your school and who just came out from VTC)
Qualification
Name Surname Date of Birth Male Female Married single Perm Prob Voluntary Govt Mission Other Funded by Marital Status Employment Status
Highest Accademic Tertiary Teaching Certificate Class Multi- Housed
V. GENERAL COMMENT:
Please give your remarks or comments on your school: (eg. Concerning school administration, 2002 questionnaire)
Head of School: ………Signature:………Date / / 2002
PEO:………..Signature:………Date: / /2002