ANALYSIS OF THE 1ST YEAR STUDENTS’ KNOWLEDGE AND SKILLS (THE SUBJECT “PHYSICS”)
Igors Klemenoks
Riga Technical University, Institute of Technical Physics, 3/7 Paula Valdena str., Riga, LV-1048, Latvia
Abstract
The paper analyzes performance of the Riga Technical University (RTU) the Faculty of Civil Engineering 1st year student group (specialty). Results of a screening test, which is carried out by almost all 1st year students (except for the Faculty of Architecture and Urban Planning (FAUP) and some of the Faculty of Engineering Economics and Management (FEEM) students who do not study Physics), are demonstrated. The results of this test as well as grades obtained by current students at secondary school are the basis of their tests’ and examination papers’ results analysis. Results of virtually every section of the Physics course are analyzed separately. One of the main objectives of the study is to find out which minimum initial level of knowledge (in Physics) should a 1st year student have by the beginning of RTU Physics course in order to successfully complete it a year later.
Key words: students’ knowledge and skills, screening test, examination results analysis
1. INTRODUCTION
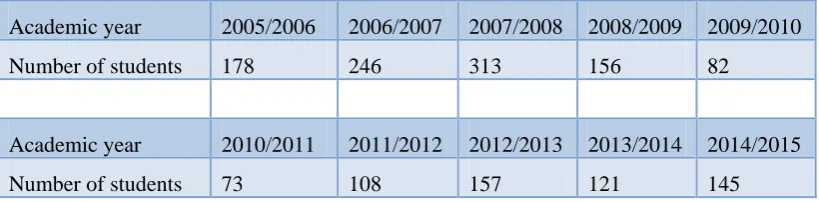
Working with the RTU Technical Physics Institute students for the 3rd decade, author is eagerly observing their creative processes and imagination utilized in producing different supplementary exam materials (‘cribs’). Of course, technical progress in this area of students’ lives has gone far ahead within this time scope. Yet far more interesting is students’ performance. Statistical data collected by the author within this time enable at least three pessimistic conclusions: 1) knowledge of school graduates (at least in Mathematics and Physics) is declining every year; 2) number of students who enter RTU 1st academic course but never graduate (even the 1st year itself) remains more or less constant year by year – around 30 – 35% (author’s data for the Faculty of Civil Engineering, academic subject – Physics); 3) number of the 1st year students is still very far from pre-Recession period, and is very unlikely to reach it ever again. Each point has its own reasons. 1st point’s influence over the 2nd point is obvious, and was studied by the author before (Klemenoks 2009). Results of this research have been not only discussed at the conferences (РТЕЕ 2009; RTU annual methodical conference), but also were used at the University leaders’ meeting with Science and Education Ministry representatives, where the issue of poor (according to the University) training of school graduates was discussed. However, aim of this work is to find out how students’ attitude to the academic process changes within the 1st year of studies; how results of tests change; and the main point – where is the ‘boundary’ beyond which a student (without their and professors’ additional effort) is initially doomed to fail and to be expelled from the University. Upon establishing that, even at the very beginning of the studies these students can be offered additional classes. Relevance of this issue is explicitly supported by the Table 1 data.
Table 1. Number of students at the beginning of the academic year
Academic year 2005/2006 2006/2007 2007/2008 2008/2009 2009/2010
Number of students 178 246 313 156 82
Academic year 2010/2011 2011/2012 2012/2013 2013/2014 2014/2015
Number of students 73 108 157 121 145
The table demonstrates the number of students of just one specialty (the Faculty of Civil Engineering) which is this paper’s subject of research. And though 2010/2011 crisis is (hopefully) over, every student is crucial to us.
2. RESEARCH RESULTS
In the RTU Physics is being taught in four different versions. The difference lies in a number of contact hours and in a time when the Physics course begins. Choice of a specific option is made by the Faculty management. The author analyzed every version in detail earlier (Klemenoks 2011), so this project will just briefly tackle the option chosen by the Faculty of Civil Engineering leaders (because academic performance of the students of this Faculty is being researched). Physics course consists of two semesters. Studying begins in the 1st semester of the 1st year. Every week students are offered one lecture (2 academic hours; attendance is compulsory), and once in two weeks – a laboratory work (2 academic hours; attendance is compulsory, too). Unfortunately, separate classes for practical problem solving (used at other Departments) are not provided. So, a professor has to often solve them during lectures (at least a few as examples), and students have to solve problems on their own. At the very first lecture students complete a test reviewing all sections of school programme. Students are offered 18 theoretical questions with 4 answer options and 7 basic (if not elementary) exercises, whose completion requires certain skills.
2.1. Screening test results analysis
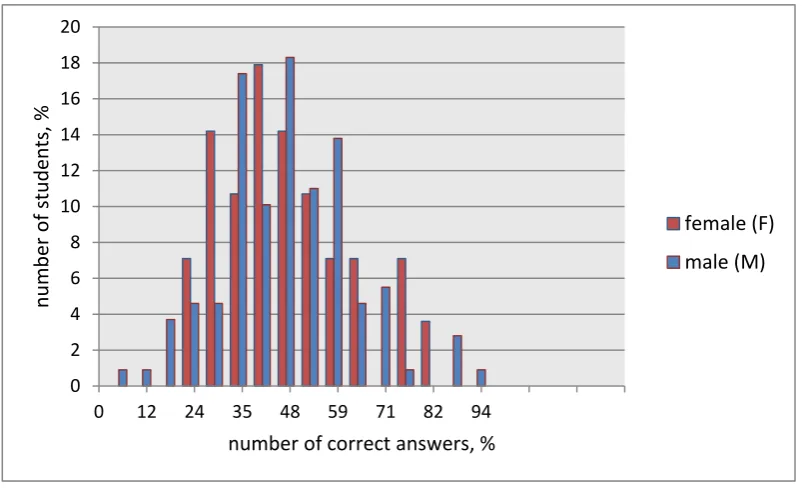
Results of the screening test can be analyzed from different points of view. Lately, numerous researches of gender difference in academic process have been carried out. A number of published papers assert that girls demonstrate better academic performance at school than boys (Gurian & Stevens 2004; Endepohls 2013). However, in higher education institutions these indications change (Cook & Cook 2014). Let’s try to analyse test results from this point of view. The Figure 1 shows general test results including both theoretical questions and problems. Evidently, results of female
Fig. 1. General test results (male (M) and female (F) results are shown separately)
students show little difference with male students’ results. The same conclusion could be drawn upon calculating average test result separately for females (10,57; that constitutes 42,28% of the maximum
0 2 4 6 8 10 12 14 16 18 20
0 20 40 60 80 100
nu
mb
er
o
f s
tu
den
ts
, %
number of correct answers, %
female (F) male (M)
possible result) and for males (10,54; 42,16% of maximum). Upon analyzing results of the theoretical questions separately certain differences might be spotted (Fig. 2). Results of the problem solving part (test’ practical part) are practically identical (Fig.3). It must be noted that this year only 28 students out of 145 are females (which constitutes 20% of the whole number).
Fig. 2. Results of the test’ theoretical part
Fig. 3. Results of the test’ practical part (problems)
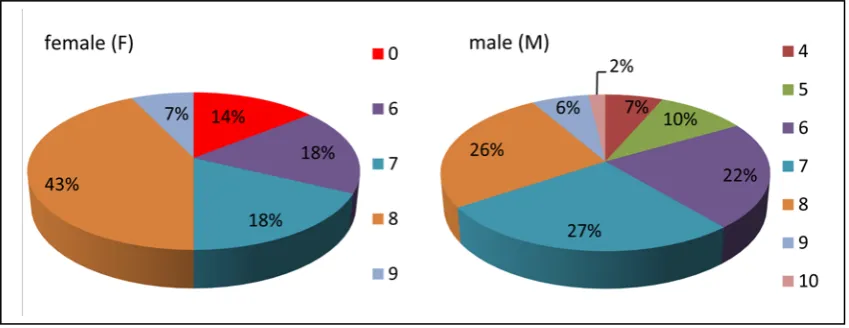
If results of the final school grades in Physics are compared (Fig.4) along with school Physics exam (Fig.5), then in both 1st and 2nd cases schoolgirls are more successful. This data concurs with the research recently conducted in 35 countries. However, only 36% of schoolgirls and 45% of schoolboys
0 2 4 6 8 10 12 14 16 18 20
0 12 24 35 48 59 71 82 94
nu
mb
er
o
f s
tu
den
ts
, %
number of correct answers, %
female (F) male (M)
0 5 10 15 20 25 30
0 12,5 25 37,5 50 62,5 75 87,5 100
nu
mb
er
o
f s
tu
den
ts
, %
number of correct answers, %
female (F) male (M)
(out of current students number) ‘risked’ to pass Physics exam. It should be mentioned that Physics and Chemistry exams are optional in Latvia, though the Ministry of Education plans to make them compulsory for all the school students in short-term perspective. ‘Trial’ compulsory exams will be conducted in Latvian schools next academic year.
Fig. 4. Comparison of final school grades between female and male students (students who didn’t study Physics at school are marked in red (0))
Fig. 5. Comparison of school Physics exam results between female and male students (students who weren’t passing the exam are marked in blue (0))
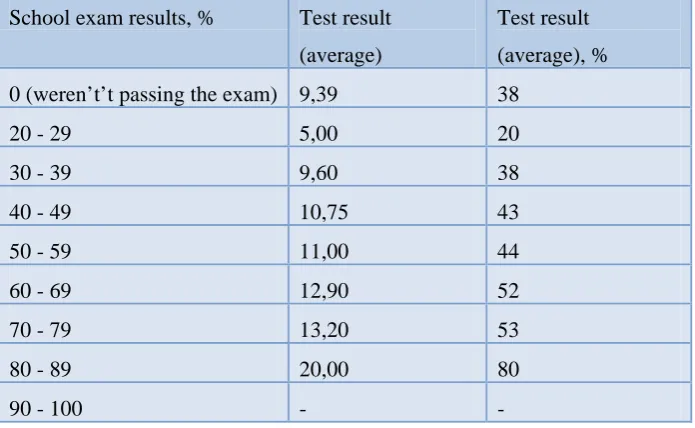
In the author’s opinion, it’s interesting to compare RTU course-start test results with final school grades and with school exam results. Comparison results are shown in Tables 2 and 3. The Tables review general results of all the students of the School. Test grade was calculated by giving 10 points (100%) for 25 correct answers. Evidently, Table 3 (with exam results) looks more logical. Table 2 provides a surprising fact: practically identical test results were demonstrated by students with final grades of «4», «5», «6» and even «7». Moreover, their results show little difference with the results of students who didn’t study Physics at school at all. Of course, probability theory might be mentioned upon assessing test results … Nevertheless, it can be concluded that the school exam results possess the biggest trustworthiness. However, some discrepancies are present here, too. Though these can be explained by a notion that students didn’t prepare for the test. Moreover, they didn’t expect anything like that at the first lecture. On the other hand, results of the test truly demonstrate knowledge of a student who begins studying Physics at RTU. Concerning the test itself – its questions engulfed all the sections of school programme; problems involve almost all of them. Their difficulty level can be demonstrated by the following examples: 1) Gas-filled balloon is falling down with constant speed. Which statement about forces acting on the balloon is correct (A: No friction force is acting on the
balloon; B: Force of gravity is equal to the friction force; C: Force of gravity is bigger than the friction force; D: Force of gravity is less than the friction force)? 2) Each point of electric field is characterized by … (A: Only the potential of the field; B: Only the intensity of the electric field; C: Intensity and potential of the electric field; D: The charge of the source of the electric field). Among others, there was a question “How to write Ohm’s law?” (reminder, student had to select one out of four answer options). Only 60 students gave the right answer, which is 41% of total student number. Problems
Table 2. Comparison between test results and final school grades Final school grade Test result
(average)
Test grade
(average)
0 (didn’t study Physics) 8,75 3,50 ≈ 4
4 9,10 3,64 ≈ 4
5 9,71 3,88 ≈ 4
6 10,32 4,12 ≈ 4
7 9,56 3,82 ≈ 4
8 11,40 4,56 ≈ 5
9 12,34 4,92 ≈ 5
10 16,00 6,40 ≈ 6
Table 3. Comparison between test results and school exam School exam results, % Test result
(average)
Test result
(average), %
0 (weren’t’t passing the exam) 9,39 38
20 - 29 5,00 20
30 - 39 9,60 38
40 - 49 10,75 43
50 - 59 11,00 44
60 - 69 12,90 52
70 - 79 13,20 53
80 - 89 20,00 80
90 - 100 - -
didn’t demand any extensive calculations and could be easily solved in one’s mind with one or two formulas for (example, “There are two identical resistors. Each resistor electrical resistance is 4 Ohm. How much resistance can be obtained, locking the resistors in parallel: 0,5 Ohm; 2 Ohm; 4 Ohm or 8 Ohm?”).
2.2 Theoretical and practical tests result analysis
Further in the Physics course, each semester students had to write two theoretical and two practical tests, as well as to complete a required minimum of laboratory works. Only after that could a student pass final exam.
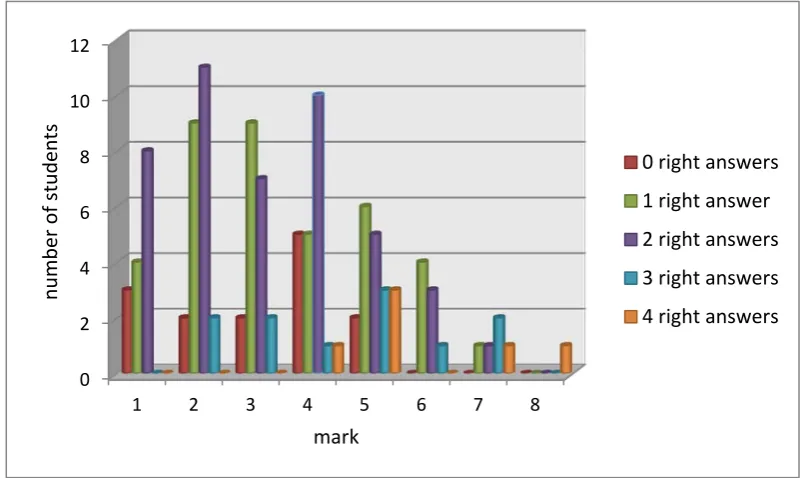
First two tests (both theoretical and practical one) engulfed Mechanics. Analyzing results of these tests and comparing them to the results of the corresponding screening test’ section, it can be said that there is no clear pattern observed (Fig. 6 and Fig. 7). To some extent it could be explained by the fact that
Fig. 6. Results of the theoretical test in Mechanics and a number of right answers in the screening test (Mechanics)
Fig. 7. Results of the practical test in Mechanics and a number of problems solved in the screening test (Mechanics)
0 2 4 6 8 10 12
1 2 3 4 5 6 7 8
nu
mb
er
o
f s
tu
den
ts
mark
0 right answers 1 right answer 2 right answers 3 right answers 4 right answers
0 2 4 6 8 10 12
1 2 3 4 5 6 7 8 9
nu
mb
er
o
f s
tu
den
ts
mark
0 problems solved 1 problem solved 2 problems solved
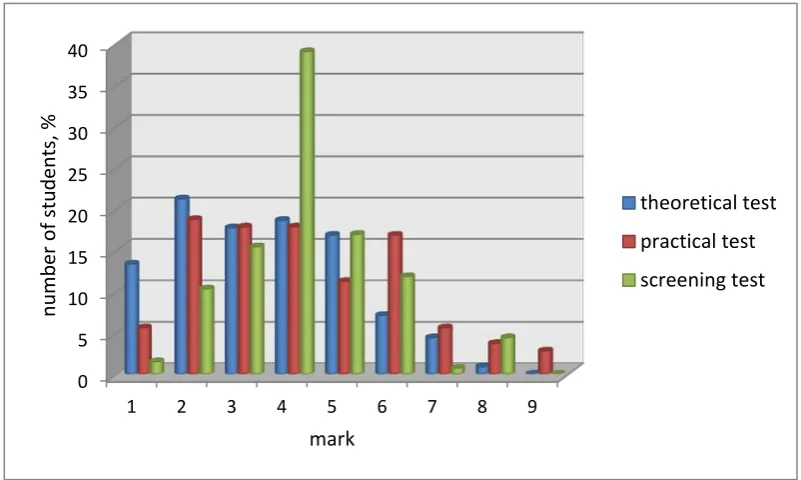
only 24% of the test questions concerned Mechanics. However, diagrams show that the higher the grade at the examination test, the higher number of right answers or solved problems in the test. If these results are combined and reviewed in percentage ratio (Fig. 8), it can be seen that they are virtually identical (though the maximum of the theoretical examination test is shifted to the zone of negative grades, and the screening test maximum is clearly shown in the grade «4»). Similar results can be observed upon analysis of other branches of Physics (except for Electromagnetism). Though,
Fig. 8. Results of tests in Mechanics in comparison with the screening test result
the next tests had better grades. It could be explained by a number of reasons. Firstly, these tests were written later and students who had received bad grades could draw right conclusions and prepare better. Secondly, some of them for different reasons simply ceased visiting lectures (perhaps
0 5 10 15 20 25 30 35 40
1 2 3 4 5 6 7 8 9
nu
mb
er
o
f s
tu
den
ts
, %
mark
theoretical test practical test screening test
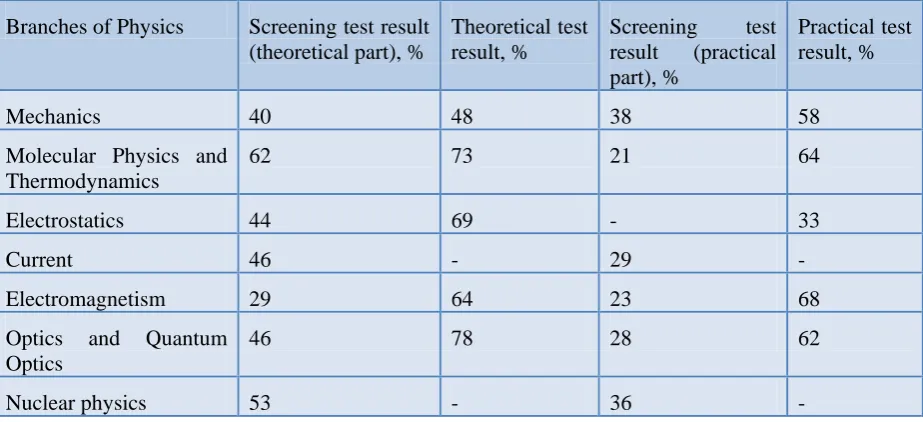
Table 4. Comparative analysis of tests along with the screening test results
they realized that they had overestimated their powers; RTU doesn’t have entry exams anymore, and entering via school grades and exams is relatively easy). Further, only a comparative analysis of examination tests completion is shown (students who received positive grades in percentage ratio to all those who undertook the examination), along with the screening test results (number of right answers per total number of questions for this branch, in percentage) for the respective branches of Physics (Table 4). The table shows that results of the examinations are always better than results of the course-start test. It is explained by the fact that students had been informed about forthcoming examinations and had an opportunity to prepare for them (unlike with the screening test). Aside from that, the examinations were completed just after studying their material. However, what is especially amazing is the difference between results of the screening test and examinations in Electromagnetism section. Yet it may be explained by the fact that these examinations are done in the second semester, hence the weakest students (who have failed the exam session) do not ‘spoil’ statistics anymore.
2.3 Examination result analysis
Below, only the results of the first exam session are reviewed, because the second session has not yet begun by the moment this paper is written. At the exam, students are offered 4 questions: two theoretical and two practical (problems). Results of this exam are shown on the Fig. 9 (results for Branches of Physics Screening test result
(theoretical part), %
Theoretical test result, %
Screening test result (practical part), %
Practical test result, %
Mechanics 40 48 38 58
Molecular Physics and Thermodynamics
62 73 21 64
Electrostatics 44 69 - 33
Current 46 - 29 -
Electromagnetism 29 64 23 68
Optics and Quantum Optics
46 78 28 62
Nuclear physics 53 - 36 -
Fig. 9. Exam grade (results for theoretical and practical questions are reviewed separately)
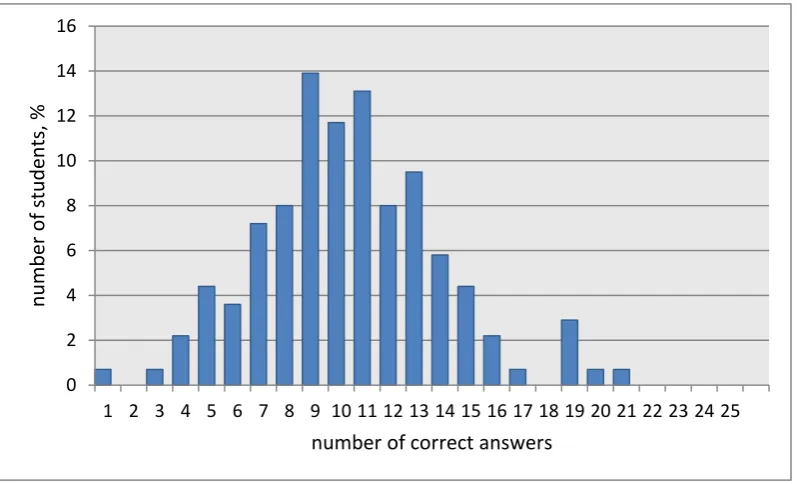
theoretical and practical questions are also reviewed separately). Comparing these with the course-start test (screening test) results (Fig. 10), it can be seen that general distribution virtually coincides. If one transfers test 25 point scale into 10 point scale (used at the exams), the results will be very similar (Fig. 11). However, it is evident that exam result maximum is 1 point higher than test maximum. To clarify it entirely, it must be added that 51 students (which is 35% of the initial group at the beginning of the year) hasn’t ‘reached’ the exam. After three repeated (additional) exams practically all the students (except one) who obtained a negative grade in the first semester were able to rectify it (for «4» or «5», generally). Average grades are shown separately for theoretical and practical questions in Table 5. It can be seen that even after the first exam the grades are (generally) higher than test grades. After three additional exams average grades were about 5.
Fig. 10. Screening test results
0 5 10 15 20 25 30 35
1 2 3 4 5 6 7 8 9 10
nu
mb
er
o
f s
tu
den
ts
, %
mark
theory problems general grade
0 2 4 6 8 10 12 14 16
1 2 3 4 5 6 7 8 9 10 11 12 13 14 15 16 17 18 19 20 21 22 23 24 25
nu
mb
er
o
f s
tu
den
ts
, %
number of correct answers
Fig. 11. Comparison between exam and screening test results on 10 point scale
Table 5. Average results of the screening test, general and additional exams Theoretical questions Practical questions (problems) General grade
Screening test 4,68 3,13 4,24
General exams 4,46 4,63 4,65
Additional exams 4,86 4,93 4,97
3. PROBABILITY OF PASSING AN EXAM
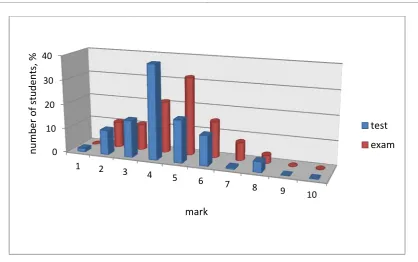
One of the major objectives of this paper was determining student’s minimal knowledge for their successful further studies. During discussions of this issue with colleagues, a formula of so-called ‘exam passing probability’ was offered. It is defined in the following way: for every group of students who have given right answers to a certain number of questions, a ratio between a number of those who passed exam successfully and a general number of students in this group is taken and shown in percentage. Results of these calculations are shown on Fig. 12. If some indications are ignored (for
0 10 20 30 40
1 2 3
4 5 6
7 8 9
10
nu
mb
er
o
f s
tu
den
ts
, %
mark
test exam
Fig. 12. Distribution of successful exam passing probability (with exponential trend line)
Fig. 13. Distribution of successful exam passing probability (students who weren’t passing an exam are not being considered)
instance when the test results are 4 or 8, which are more of an exception rather than a pattern), than passing an exam starts becoming relatively certain with 13 right answers (52% of all the test questions). In this case exam passing probability reaches 75%. Anyway, the minimal number of points is still discussed. It doesn’t have to be 13. Optionally, upon calculating ‘probability’ one may ignore students who were not passing an exam at all (Fig. 13). Besides, minimal ‘probability’ could be decreased to 60%. In this case the necessary minimum reaches just 9 points (36% of all the test questions). Students who have given smaller number of right answers should at least take it into
0 20 40 60 80 100 120
1 2 3 4 5 6 7 8 9 10 11 12 13 14 15 16 17 18 19 20 21 22 23 24 25
exa
m p
as
sin
g
pr
oba
bi
lit
y,
%
number of correct answers
0 20 40 60 80 100 120
1 2 3 4 5 6 7 8 9 10 11 12 13 14 15 16 17 18 19 20 21 22 23 24 25
exa
m p
as
sin
g
pr
oba
bi
lit
y,
%
number of correct answers
account. That’s why results of such calculations (based on the previous year’ results) are delivered to the students at the first lecture.
4. CONCLUSIONS
For more thorough use of the screening test results, next academic year it is planned to conduct it not at the first lecture, but at the application stage (in July). Applicants who fail to gain a necessary number of points (to overcome “probability threshold”) may be recommended to take an intensive course in school Physics (2-3 weeks long) before the academic year (in August). The help of this course may possibly equalize students’ general preparation level before the academic year. It will ease work for both professors and students. Hence, it should reflect on the general success of the academic process and maintaining the number of students, which is also important.
REFERENCES
Cook, JL & Cook, G 2014, „Similarities and Differences Between Boys and Girls”, Excerpt from Child Development Principles and Perspectives, by J.L. Cook, G. Cook, 2009 edition, viewed 24 March 2015, http://www.education.com/reference/article/similarities-differences-boys-girls/
Endepohls-Ulpe, M 2013, „Gender stereotypes and their gender-specific impact on academic achievement”, Acta Universitatis Lodziensis, Folia Sociologica, Bd. 43, pp. 3 – 16.
Gurian, M & Stevens, K 2004, „With Boys and Girls in Mind”, Closing Achievement Gaps, Volume 62, Number 3, pp. 21-26, viewed 24 March 2015, http://www.ascd.org/publications/educational-leadership/nov04/vol62/num03/With-Boys-and-Girls-in-Mind.aspx
Klemenoks, I 2011, „Physics’course teaching alternatives analysis in the Riga Technical University (RTU)”, paper presented to the SEFI Conf. „Physics Teaching in Engineering Education. PTEE - 2011”, Mannheim, Germany, 21-23 September.
Klemenoks, I 2009, „Analysis of 1st-year students’performance (the subject „physics”), based on the results of final examinations in secondary school”, Proc. of the SEFI Conf. „Physics Teaching in Engineering Education. PTEE - 2009”, Wroclaw, Poland, pp. 167 - 172.