www.the-cryosphere.net/10/3071/2016/ doi:10.5194/tc-10-3071-2016
© Author(s) 2016. CC Attribution 3.0 License.
Strain localization and dynamic recrystallization in the ice–air
aggregate: a numerical study
Florian Steinbach1,2, Paul D. Bons1, Albert Griera3, Daniela Jansen2, Maria-Gema Llorens1, Jens Roessiger1, and Ilka Weikusat1,2
1Department of Geosciences, Eberhard Karls University Tübingen, 72074 Tübingen, Germany
2Alfred Wegener Institute Helmholtz Centre for Polar and Marine Research, 27568 Bremerhaven, Germany 3Departament de Geologia, Universitat Autònoma de Barcelona, 08193 Bellaterra (Barcelona), Spain Correspondence to:Florian Steinbach ([email protected])
Received: 1 July 2016 – Published in The Cryosphere Discuss.: 11 July 2016
Revised: 11 November 2016 – Accepted: 2 December 2016 – Published: 21 December 2016
Abstract. We performed numerical simulations on the mi-crodynamics of ice with air inclusions as a second phase. Our aim was to investigate the rheological effects of air inclusions and explain the onset of dynamic recrystalliza-tion in the permeable firn. The simularecrystalliza-tions employ a full-field theory crystal plasticity code coupled to codes simu-lating dynamic recrystallization processes and predict time-resolved microstructure evolution in terms of lattice orienta-tions, strain distribution, grain sizes and grain-boundary net-work. Results show heterogeneous deformation throughout the simulations and indicate the importance of strain local-ization controlled by air inclusions. This strain locallocal-ization gives rise to locally increased energies that drive dynamic recrystallization and induce heterogeneous microstructures that are coherent with natural firn microstructures from EPICA Dronning Maud Land ice coring site in Antarctica. We conclude that although overall strains and stresses in firn are low, strain localization associated with locally increased strain energies can explain the occurrence of dynamic recrys-tallization.
1 Introduction
The ice sheets on Greenland and Antarctica are composed of snow layers, originally containing a large proportion of air, which are transformed into solid ice due to compaction and sintering processes (Herron and Langway, 1980; Col-beck, 1983). At the firn–ice transition, the air is sealed off in bubbles as the pores are no longer connected and do not
allow exchange with air from other layers or the atmosphere (Schwandner and Stauffer, 1984; Stauffer et al., 1985). For this reason, the ice sheets are considered as valuable archives of the palaeoatmosphere (Luethi et al., 2008; Fischer et al., 2008). However, ice sheets are not static but rather flow under their own weight, which can potentially cause the palaeocli-matic record to lose its integrity (Faria et al., 2010). For the interpretation of these records it is essential to understand not only the deformation dynamics of polycrystalline ice but also the implications of a second phase in the form of air bubbles. For consistency, we use the expression “air bubbles” when-ever referring to the natural material and air inclusion only for numerical models, where the individual units of air are neither interconnected nor communicating.
Compared to other abundant minerals on the surface, ice on Earth is always at high homologous temperatures (Th= Tactual/Tmeltpoint), close to its pressure melting point and therefore creeping under gravitational forces (Petrenko and Whitworth, 1999; Faria et al., 2014a). The macroscopic be-haviour of the ice aggregate results from the local response of individual ice crystals and the distribution of second phases within the polycrystalline aggregate.
Dislo-cation glide in ice Ih is characterized by a strong viscoplastic anisotropy, with resistance to glide on basal planes at least 60 times smaller than on other planes (Duval et al., 1983). The strong preference for basal glide usually leads to an approx-imately single maximum crystallographic preferred orienta-tion (CPO) with thecaxes mostly aligned with the direction of maximum finite shortening (Azuma and Higashi, 1985). Early experimental studies by Steinemann (1954) show that such a single maximum CPO causes a mechanical anisotropy of a deformed aggregate of ice grains. This is supported by experiments by Gao and Jacka (1987), the review by Budd and Jacka (1989) and more recent studies by Treverrow et al. (2012).
Viscoplastic deformation of ice is accompanied by recrys-tallization (Duval, 1979; Jacka and Li, 1994; Faria et al., 2014b), as is common in minerals at high homologous tem-peratures. Recrystallization processes have direct implica-tions on creep behaviour as they affect fabric development and hence the flow of ice (Duval and Castelnau, 1995; Castel-nau et al., 1996; Duval et al., 2000). The nomenclature to describe recrystallization and microstructure varies among glaciology, geology and material science. For consistency, in this paper we employ the terminology proposed by Faria et al. (2014b).
Under static conditions and non-deformation-related nor-mal grain growth (NGG) or static grain boundary, migra-tion driven by surface energy minimizamigra-tion (Stephenson, 1967; Gow, 1969; Duval, 1985) leads to a microstruc-ture with only slightly curved grain boundaries and 120◦ angles at grain triple junctions (foam texture). The re-sulting grain size distribution is log-normal according to Humphreys and Hatherly (2004, pp. 334–335). In contrast, strain-induced boundary migration (SIBM) as described by Duval et al. (1983) or Humphreys and Hatherly (2004, pp. 251–253) minimizes stored strain energy by migrating boundaries towards less strained neighbouring grains. In-tracrystalline annihilation of dislocations by lattice reorien-tation into lower energy configurations, known as recovery (White, 1977; Urai et al., 1986; Borthwick et al., 2014), addi-tionally lowers stored strain energies. Recovery accompanied by gradual formation of subgrain boundaries and ultimately new high-angle grain boundaries (e.g. polygonization; Alley et al., 1995) is termed “rotation recrystallization” (Passchier and Trouw, 2005). These recrystallization phenomena oper-ating during deformation are summarized by the term “dy-namic recrystallization” (DRX).
Recrystallization processes operate concurrently, but the proportion of contribution of each mechanism varies. The DRX diagram by Faria et al. (2014b) describes the relative contributions as a function of strain rate and temperature, as was done before for quartz (Hirth and Tullis, 1992). Accord-ing to these models, rotation recrystallization is more domi-nant with higher strain rates, whereas strain-induced bound-ary migration dominates at higher temperatures.
In very shallow firn, at mass densities below 550 kg m−3, compaction by displacement, rearrangement and shape-change of snow particles is attributed to grain-boundary slid-ing (Alley, 1987), neck growth between grains by isothermal sintering (Blackford, 2007) and temperature gradient meta-morphism (Riche et al., 2013). Once the critical density is exceeded, the dominating mechanism becomes plastic de-formation by intracrystalline creep (Anderson and Benson, 1963; Faria et al., 2014b). For the EPICA Dronning Maud Land (EDML) ice core, this critical density is reached at around 20 m depth (Kipfstuhl et al., 2009). However, more recent tomographic analyses on EDML samples by Freitag et al. (2008) provide evidence for an early onset of plastic de-formation at shallow depths of 10 m. Simulations by Theile et al. (2011) suggest an even shallower onset of plastic defor-mation and the absence of grain-boundary sliding.
One way to determine which deformation mechanisms are operating is to study the microstructure of the deformed ma-terial (Passchier and Trouw, 2005; Kipfstuhl et al., 2009; Faria et al., 2014a, b). Apart from experiments, numerical simulations are increasingly used as a tool to establish the link between deformation mechanisms, boundary conditions and resulting microstructures (see review of Montagnat et al., 2014). Unfortunately, most studies on ice deformation only considered pure ice without air bubbles. Some exceptions are the experimental studies of Arena et al. (1997) and Azuma et al. (2012) and the numerical simulations of Roessiger et al. (2014) on grain growth of ice in the presence of air inclu-sions. Recent numerical modelling by Cyprych et al. (2016) indicates the importance of strain localization in polyphase materials but does not include a description of microstruc-ture evolution during recrystallization. Systematic numerical studies of the effect of a second phase, in this case air, on plastic deformation and concurrent microstructure evolution during DRX are still lacking.
In this contribution we investigate the implications of air inclusions on deformation and recrystallization to assess the importance of DRX at shallow levels of ice sheets. For that purpose, we for the first time employ an explicit numerical approach combining both polyphase crystal plasticity and recrystallization. Particular focus is given to two micrody-namical aspects, which are (1) the strain distribution in the polyphase and polycrystalline ice–air aggregate and (2) its relation to (deformation-induced) DRX.
2 Methods
2.1 Multi-process modelling with Elle
as strain localization and porphyroclast rotation (Griera et al., 2011, 2013), deformation of polyphase materials (Jes-sell et al., 2009) or folding (Llorens et al., 2013a, b). Re-cent applications of Elle codes utilized and updated for this study are on DRX in pure ice (Llorens et al., 2016a, b), grain growth (Roessiger et al., 2011, 2014), and folding in ice sheets in relation to mechanical anisotropy, both on the small (Jansen et al., 2016) and large scale (Bons et al., 2016). To simulate viscoplastic deformation of the polyphase and polycrystalline aggregate with concurrent recrystallization, the full-field crystal viscoplasticity code VPFFT by Leben-sohn (2001) was coupled to implementations of recrystal-lization processes in Elle using the approach described in Llorens et al. (2016a, b). Here we only briefly explain the essentials of the modelling technique. The reader is referred to Jessell et al. (2001) and Bons et al. (2008) for the gen-eral principles of Elle. Details of the algorithms for grain-boundary migration can be found in Becker et al. (2008) and Roessiger et al. (2011, 2014), and for coupled VPFFT and recrystallization in Llorens et al. (2016a, b).
2.2 Discretization of the microstructure
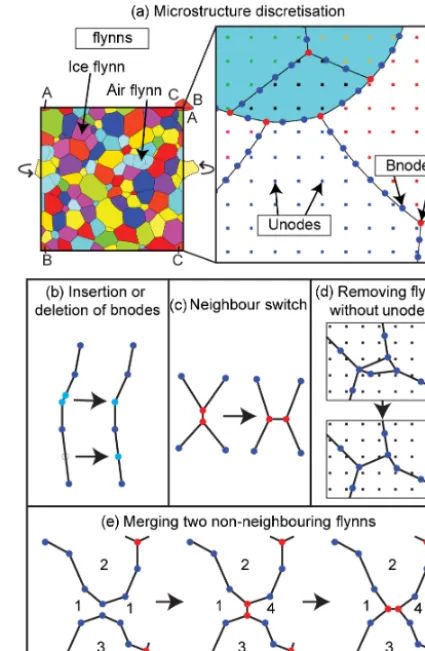
The two-dimensional microstructure of ice and air inclusions is discretized in a contiguous set of polygons with fully wrap-ping and periodic boundaries (Fig. 1a; Llorens et al., 2016a, b; Bons et al., 2008). In the set-up used here, the polygons (termed flynns) are either ice crystals or air inclusions. Island grains such as a grain inside another grain are not allowed in Elle, for topological reasons. Flynns are delimited by straight segments that join boundary nodes (bnodes) in either double or triple junctions. Quadruple or higher-order junctions are also not allowed in Elle. Additionally, we superimpose a reg-ular grid of unconnected nodes (unodes) on the set of flynns. Unodes store local state variables such as stress, normalized von Mises strain rate or dislocation density. Crystallographic orientations at unodes are defined by Euler triplet angles, fol-lowing the Bunge convention. After each deformation incre-ment, all state variables are mapped back to a regular, rect-angular unode grid, as this is required by the VPFFT code. To track the finite deformation, a second set of unodes, on an initially regular square grid, represent material points or passive markers that are displaced each deformation step.
Topology checks are carried out at all times during a sim-ulation to ensure compliance with topology restrictions and to maintain the set resolution. These include keeping bnode distances between a minimum and maximum separation by either deleting or inserting bnodes (Fig. 1b), and removing flynns that are smaller than a set minimum area or contain no unodes (Fig. 1c). To avoid the formation of a quadruple tion, a neighbour switch is performed between triple junc-tions closer than the minimum separation distance (Fig. 1c). When two sides of a flynn approach each other to below a set minimum distance, the flynn is split into two (Fig. 1e).
Figure 1.Microstructure discretization in Elle.(a)A contiguous set of polygons (flynns) is composed of boundary nodes (bnodes) and has periodic boundaries. An additional grid of unconnected nodes (unodes) is superimposed on flynns and bnodes to store intracrys-talline properties, state variables and track deformation.(b–e) Topo-logical checks performed to keeping topoTopo-logical restrictions in Elle. Checks(b),(c)and(e)are based on minimum and maximum bnode separations. Check(d) removes extremely small flynns that con-tain no undoes or have areas smaller than the area enclosed by four neighbouring unodes by merging them to a neighbour of the same phase.
This allows bulging grain boundaries to sweep across entire grains without causing overlapping flynns.
In this approach, intracrystalline deformation is assumed to be accommodated by dislocation glide on predefined slip systems, using a non-linear, viscous, rate-dependent law. The strain rate ε˙ij(x)at each positionx (unode position) in the
grid is essentially the sum of the shear strain rates on allN slip systems (Eq. 1):
˙ εij(x)=
N
X
s=1
msij(x)γ˙s(x)=
˙ γ0
N
X
s=1
msij(x) m s ij(x) σ
0
ij(x)
τs(x) !3
. (1)
The constitutive equation relates the shear rate γ˙s on each slip system (s), relative to a reference shear rate γ˙0, to the de-viatoric stressσij0 and the orientation of the slip system that is defined by the symmetric Schmidt tensormsij (the dyadic product of a vector normal to the slip plane and slip direc-tion). The effective viscosity or “ease of slip” of each slip system is defined by the slip-system-dependent critical re-solved shear stressτs. Here we use a stress exponent of three, assuming Glen’s law (Glen, 1958).
Since the strain rate and stress fields are initially unknown, an iterative scheme is implemented with a spectral solver using a fast Fourier transformation. The VPFFT code pro-vides the full velocity field, which is integrated to the dis-placement field for a small time step, assuming velocities re-main constant. The displacement field is applied to the pas-sive marker grid and to all bnodes to apply the deformation to the grains and air inclusions. Lattice orientations are up-dated and remapped onto the rectangular unode grid. Fur-thermore, geometrically necessary dislocation densities are calculated using the plastic strain gradient following Brinck-mann et al. (2006) and assuming constant Burgers vectors for all slip systems.
2.4 Recrystallization
2.4.1 Polyphase grain-boundary migration
Polyphase grain-boundary migration is modelled using a front-tracking approach, which is explained in detail by Becker et al. (2008) and Llorens et al. (2016a). Grain-boundary migration is achieved by moving individual bn-odes. In general, the movement1xof a bnode is calculated from its mobilityMand driving forceSover a small numer-ical time step1t:
1x=SM M0, T ◦C 1t, (2)
where the mobilityMis a function of temperatureT and in-trinsic mobilityM0(Nasello et al., 2005). The intrinsic mo-bilityM0varies for different phase boundaries. The driving force S is calculated from the change in local free energy (dE) resulting from a change in position (dx) of the bnode
under consideration. dEis a function of the change in bound-ary length and, hence, total local grain-boundbound-ary surface ergy (Becker et al., 2008) and the change in stored strain en-ergy (Llorens et al., 2016a). A bnode is moved (using Eq. 2) in the direction of maximum free-energy reduction, which is determined from four small orthogonal trial displacements of that bnode. For the movement of ice–air boundaries, the stored strain energy was not taken into account.
In a polyphase aggregate, the conservation of mass re-quirement influences boundary migration. In theory, any lo-cal movement of a boundary needs to conserve the cross-sectional area of its host grain. This restriction would inhibit most ice–air interface movements, prohibiting any geomet-rical changes of air inclusions. Therefore, an additional en-ergy term (Earea)is introduced to counteract that the surface energy (Esurf)would drive an ice–air boundary inwards and let air inclusions shrink (Roessiger et al., 2014). For ice–air boundaries, the total local energy (Etotal)at a given trial po-sitionj only depends on the surface energy change and the relative area change resulting from a theoretical movement of the boundary node to this position:
Etotal(j )=Esurf(j )+Earea(j ) , (3) Earea(j )=c
A (j )−A 0 A0
2
, (4)
whereAjis the area of the air inclusion when the bnode is at
trial positionj andA0is the initial inclusion area. Decreas-ingcessentially increases the accepted violation of the con-servation of mass requirement, allowing a stronger change in cross-sectional area. For the polyphase aggregate of ice and air, the pre-factorccan be regarded as a compressibility fac-tor: Theoretically, surface energy drives the bubble surface inward, compressing the enclosed air and increasing the air pressure in the bubble. This pressure would counteract the surface movement until an equilibrium between surface ten-sion and inner bubble pressure is reached, leading to a sta-ble bubsta-ble cross-sectional area. The factor c controls how quickly this equilibrium is reached.
al. (2005), the intrinsic mobility Mice-ice of ice–ice bound-aries was set to 0.023 m4J−1s−1, which Nasello et al. (2005) determined for slow movement and is consistent with previ-ous modelling by Llorens et al. (2016a, b). A slower move-ment is more suitable for our simulations as a higher mo-bility would cause numerical errors when using the same time step. Furthermore, it mitigates the effect of large nu-merical grain sizes (Sect. 4.5). The grain-boundary mobil-ity was determined as a function of temperature and intrinsic mobility according to Nasello et al. (2005). To be consistent with previous modelling, the surface energy γice-ice of ice– ice boundaries was set to 0.065 J m−2, as commonly used in the literature (Ketcham and Hobbs, 1969; Nasello et al., 2005; Roessiger et al., 2014; Llorens et al., 2016a, b). Based on Roessiger et al. (2014), the mobility ratio of ice–ice and ice–air boundariesMice-ice/Mice-air was set to 10, which in their study provided results in compliance with the experi-mentally derived grain growth rates of Arena et al. (1997). The surface energyγice-airfor ice–air boundaries was set to 0.52 J m−2, which as a function of ice–ice surface energies (γice-ice)results in a dihedral angles of 173◦and almost cir-cular air inclusions (Roessiger et al., 2014).
In a two-phase model, such as ice with air inclusions, three boundary types are possible: ice–ice, air–ice and air– air boundaries. Air–air boundaries can occur in the model, for example when two air inclusions merge into one. These boundaries are purely numerical and have no physical mean-ing. They are therefore excluded them from any modelling processes or post-processing analyses.
During the simulation, all bnodes are selected in a ran-dom order and moved according to Eq. (2) one at a time. After each movement, topological checks are performed in keeping with the topological restrictions of Elle and to avoid impossible topologies such as bnodes sweeping across other grain-boundary segments. Once a unode is swept by a mov-ing boundary and thus changes its host grain, its dislocation density is set to zero and its lattice orientation to the value of the nearest neighbour unode in the new host grain.
2.4.2 Rotation recrystallization
The process of rotation recrystallization is modelled in two separate steps during the multi-process simulation: (1) re-covery by rearranging the intracrystalline lattice orientations into lower energy configurations such as subgrain bound-aries, which is the predecessor for (2) the creation of new grains defined by high-angle boundaries, which here implies inserting new boundary nodes and splitting an existing flynn. In analogy to the grain-boundary migration code, an en-ergy minimization system is used. Each unode is regarded as a small crystallite characterized by a lattice misorienta-tion with respect to its first-order neighbours. Misorientamisorienta-tion is the difference in lattice orientation between two unodes, which increases the total free energy of the local system. Small trial rotations are used to determine which lattice
ro-tation would result in the maximum decrease in local free energy. The lattice in the unode is then rotated according to this decrease and a “mobility” term, as described in detail in Borthwick et al. (2014) and Llorens et al. (2016a).
Both the viscoplastic deformation and the above recov-ery process lead to polygonization, i.e. the formation of new high-angle grain boundaries defined by a lattice misorien-tation between neighbouring unodes that exceeds a critical angleαhagb. Such new grain boundaries are initially not de-fined by bnodes and are thus numerically excluded from grain-boundary migration (Sect. 2.4.1). Polygonization re-quires the creation of new high-angle grain boundaries by splitting an existing flynn and inserting new boundary nodes. When intragranular misorientations that exceedαhagbare de-tected, grain splitting is activated. This is achieved by find-ing clusters of unodes with common lattice orientations, sep-arated by high-angle boundaries. The positions of the new boundary nodes are found using a Voronoi decomposition of the unode clusters, storing the Voronoi points surround-ing the cluster as new bnodes. The critical angleαhagb has been suggested to be 3 to 5◦for ice Ih, based on experiments that combine grain-boundary properties and high-angular-resolution measurements (Weikusat et al., 2011a, b). Here we useαhagb=5◦as a conservative estimate. Lower angles would lead to smaller grain sizes, which potentially cause more topological problems.
2.5 Process coupling
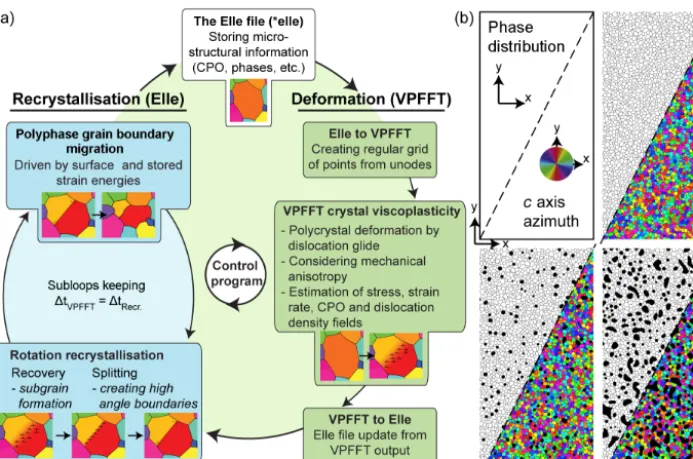
Multi-process modelling of polyphase deformation and re-crystallization is achieved by operator splitting. In Elle, the specific physical processes that contribute to microstructure evolution are programmed as stand-alone modules. These are coupled by a control program, successively running them in isolation, each for a short numerical time step (Fig. 2a). The numerical set-up takes into account the viscoplastic defor-mation (Sect. 2.3) and dynamic recrystallization (Sect. 2.4), which here covers grain-boundary migration, recovery and polygonization.
Figure 2. (a)Multi-process modelling by operator splitting is achieved by successively running individual process modules. One step of deformation by VPFFT code is followed by five subloops (with shorter time steps) of recrystallization, each comprising four steps of recovery and grain-boundary migration, to keep a constant time step for all combined processes.(b)Initial 10×20 cm microstructures with foam textures containing 0, 5 and 20 % of air and with an initially random crystallographic fabric. Upper left half shows grain-boundary network and lower right the lattice orientations.
2.6 Set-up of simulations
Three starting microstructures were used to investigate the effect of viscoplastic deformation and DRX at different area fractions of air inclusions of 0, 5 and 20 % air phase, termed F00, F05 and F20, respectively (Fig. 2b). In general, we refrain from relating our air fractions to specific depth or porosity ranges in firn or ice as our approach is limited and assumes an incompressible air phase. We chose to use these settings to represent only approximate ice–air aggre-gates as found in firn (F20) and well below the firn–ice tran-sition (F05) and used simulation F00 for reference. With this, we do not limit our study to firn, but to ice–air ag-gregate in general. All initial microstructures were created from the same 10×20 cm2 foam texture with 3267 grains. With this, the initial mean grain sizes of our modelling were larger than typical firn mean grain sizes as presented in e.g. Kipfstuhl et al. (2009) but consistent with previous simula-tions by Llorens et al. (2016a, b). Lattice orientasimula-tions were mapped onto a regular grid of 256×256 unodes with a ran-dom initial lattice orientation assigned to each grain. Air in-clusions were introduced by setting air properties to the de-sired area percentage of grains, followed by running solely surface-energy-based (static) polyphase grain-boundary mi-gration until air inclusion sizes equilibrated in area and shape. For consistency, for this static grain-boundary migra-tion, the same area energy factor c=0.1 (Eq. 4) as for the actual dynamic recrystallization and deformation simulations
was used. Section 4.5 discusses the use of this factor in more detail.
The three starting microstructures were deformed in pure shear with a constant incremental strain of 1 % vertical shortening over 75 simulation steps. Each simulation step comprised 20 recrystallization steps per VPFFT step and equalled 108s=3.16 years, resulting in a vertical strain rate of 10−10s−1and deformation up to 53 % vertical shortening. We remark that the modelled strain rate is about an order of magnitude faster than assumed for firn at the EDML site (Faria et al., 2014b) and that modelling a slower strain rate is possible, yet currently too numerically expensive. From a technical point of few, fast strain rates have the advantage that the time steps for recrystallization routines can be small. To achieve slower strain rates, the number of recrystalliza-tion steps per deformarecrystalliza-tion step would need to be increased at a significant expense of computation time.
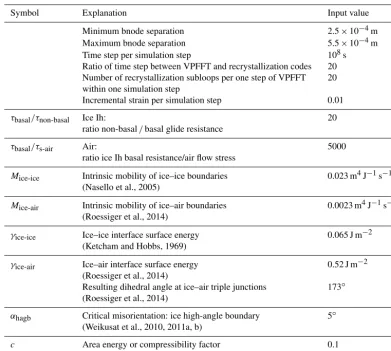
Table 1.Input properties for the simulations F00, F05 and F20. Remaining input properties according to Llorens et al. (2016, Table 1). A more detailed description of the parameters is provided in Sects. 2.4 and 2.6 and Llorens et al. (2016a, b).
Symbol Explanation Input value
Minimum bnode separation 2.5×10⁻⁴m Maximum bnode separation 5.5×10⁻⁴m Time step per simulation step 108s Ratio of time step between VPFFT and recrystallization codes 20 Number of recrystallization subloops per one step of VPFFT within one simulation step
20
Incremental strain per simulation step 0.01
τbasal/τnon-basal Ice Ih:
ratio non-basal/basal glide resistance
20
τbasal/τs-air Air:
ratio ice Ih basal resistance/air flow stress
5000
Mice-ice Intrinsic mobility of ice–ice boundaries (Nasello et al., 2005)
0.023 m4J−1s−1
Mice-air Intrinsic mobility of ice–air boundaries (Roessiger et al., 2014)
0.0023 m4J−1s−1
γice-ice Ice–ice interface surface energy (Ketcham and Hobbs, 1969)
0.065 J m−2
γice-air Ice–air interface surface energy (Roessiger et al., 2014)
0.52 J m−2 Resulting dihedral angle at ice–air triple junctions
(Roessiger et al., 2014)
173◦
αhagb Critical misorientation: ice high-angle boundary (Weikusat et al., 2010, 2011a, b)
5◦
c Area energy or compressibility factor (10 times the value of Roessiger et al., 2014)
0.1
slip planes. However, this approximation does not signifi-cantly affect the results (Sect. 4.5 and Supplement Fig. S2). With this treatment of the air phase, the stress in points be-longing to pores can be considered to nearly vanish compared to stresses reached in the solid grains, which is coherent with results from modelling of void growth using a dilatational viscoplastic full-field-theory-based formulation (Lebensohn et al., 2013). The simplification of assuming incompressibil-ity allowed us to exclude the effect of compaction during mi-crostructure evolution and is further discussed in Sect. 4.5.
Temperature throughout the simulations was assumed con-stant at−30◦C. A detailed summary of all input properties can be found in Table 1. Where not indicated differently, we employed input parameters as used by Llorens et al. (2016a, Table 1).
For comparison of grain size statistics, we additionally performed three NGG simulations using solely surface-energy-driven grain-boundary migration and no deformation. The NGG simulations used the three microstructures for F00,
F05 and F20 as presented in Fig. 2b and the numerical time step was kept the same as in the deformation simulations. 2.7 Post- processing
2.7.1 Strain rate and strain localization quantification In order to visualize and explain the simulations, some post-processing steps were necessary. Strain-rate tensor fields pre-dicted by VPFFT were transformed in von Mises equivalent strain rates normalizing the von Mises strain rate for each unode to the bulk value of the whole model. The von Mises strain rateε˙vM provides a scalar measure of strarate
in-tensity and was calculated as a function of the symmetric strain-rate tensor:
˙ εvM =
r 2
3ε˙ijε˙ij. (5)
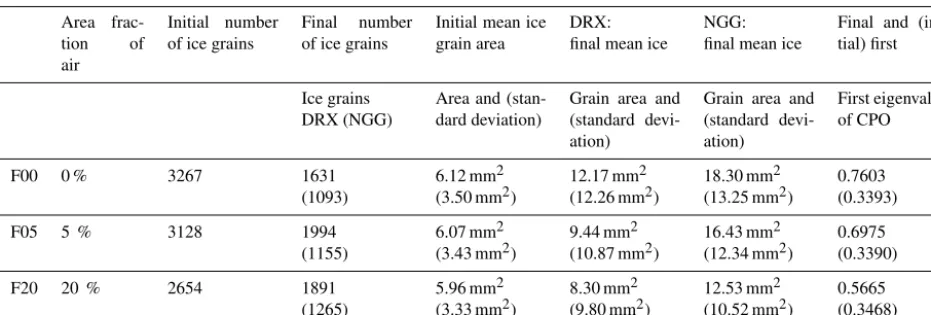
cal-Table 2.Overview on numerical simulations using crystal viscoplasticity and dynamic recrystallization (DRX) and only normal grain growth (NGG) simulations. NGG simulations used the same initial microstructures than DRX simulations.
Area frac-tion of air
Initial number of ice grains
Final number of ice grains
Initial mean ice grain area
DRX: final mean ice
NGG: final mean ice
Final and (ini-tial) first
Ice grains DRX (NGG)
Area and (stan-dard deviation)
Grain area and (standard devi-ation)
Grain area and (standard devi-ation)
First eigenvalue of CPO
F00 0 % 3267 1631
(1093)
6.12 mm2 (3.50 mm2)
12.17 mm2 (12.26 mm2)
18.30 mm2 (13.25 mm2)
0.7603 (0.3393)
F05 5 % 3128 1994
(1155)
6.07 mm2 (3.43 mm2)
9.44 mm2 (10.87 mm2)
16.43 mm2 (12.34 mm2)
0.6975 (0.3390)
F20 20 % 2654 1891
(1265)
5.96 mm2 (3.33 mm2)
8.30 mm2 (9.80 mm2)
12.53 mm2 (10.52 mm2)
0.5665 (0.3468)
culated with
F =1− 1 Nu
P˙ εvM2
P˙
εvM2 , (6)
where Nu is the total number of unodes within ice grains and ε˙vM the von Mises equivalent strain rate of each
un-ode. The localization factorF ranges from 0 to 1, such that 0 represents completely homogeneous deformation and 1– 1/Nu maximum localization, where all strain is accommo-dated by a single unode. Note that Sornette et al. (1993) and Davy et al. (1995) used a slightly different localization factor f =1−F, where 1 represents homogeneous deformation. 2.7.2 Driving forces and crystallographic orientations For each step of grain-boundary migration, the driving forces for migration were stored in bnode attributes differentiat-ing between surface and stored strain energy drivdifferentiat-ing forces. Details about the driving force calculation can be found in Llorens et al. (2016a, Eqs. 10–12). By normalizing the local stored strain energy to bnode mean surface energy, we ob-tained a quantitative measure of how much grain-boundary migration is induced by strain energy. For each simulation step, the bnodes only stored the driving forces for the last grain-boundary migration step. This allowed us to capture the correct driving forces at the end of the simulation step af-ter a time increment during which strain energy was induced by deformation and reduced by recrystallization processes. Hence, we determined a minimum estimate for strain ener-gies, which may have been higher in an intermediate stage of the simulation step.
Crystallographic preferred orientations were stored and updated during the simulations. Pole figures and eigenval-ues were extracted using the texture analysis software MTEX (Bachmann et al., 2010; Mainprice et al., 2011) based on the orientation distribution function. The projection plane was chosen to be parallel to thex–yplane of the numerical model
andcaxis orientation was expressed using the angles of az-imuth and dip in this plane.
3 Results
Table 2 and Fig. 3 provide an overview of the results ob-tained from simulating pure shear deformation with ongo-ing recrystallization for three different amounts of air in-clusions. Selected movies illustrating the full microstructure evolution can be found as supplementary material in the AV Portal of TIB Hannover (av.tib.eu). The resulting microstruc-tures are characterized by heterogeneous grain size distribu-tions and a slight increase in average grain sizes compared to the initial one. Most grains have smoothly curved bound-aries and are usually equidimensional to slightly elongate in thex direction. Coalescence of air inclusions (Roessiger et al., 2014) led to a number of large inclusions in simulation F20. The largest air inclusions show a marked elongation, mostly oblique to the shortening direction. Small inclusions remained circular.
Figure 3.Overview of modelling results at last time step at 53 % vertical shortening under pure shear conditions.(a)Grain-boundary network superimposed on passive marker grid of initially vertical parallel lines to show the finite strain distribution.(b)The same microstructures superimposed on the map of instantaneous strain rates expressed as von Mises strain rates normalized to the bulk value. Arrows in both images indicate zones of marked strain localization. Air inclusions are displayed in black.
ca. 45◦ and subsequently rotated away from the shortening direction, especially in air-free ice (F00). High strain (rate) zones form bridges between air inclusions when these are present. Regions between the high strain zones are charac-terized by both low strain rates and low accumulated finite strains.
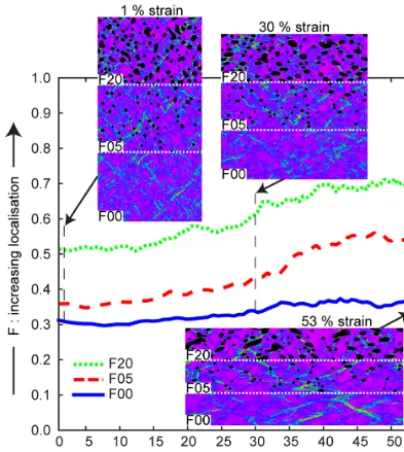
Using the localization factorF, it is possible to quantify the degree of strain localization in our simulations. Figure 4 shows the evolution of this factor with strain for all simula-tions. In accordance with strain-rate maps and passive marker grids, non-zero (F ≥0.3) values are observed throughout the simulations, indicating strain localization in all cases.F in-creases up to about 40 % vertical shortening, after which
the rate of increase is lower. Localization increases with the amount of air inclusions, withF ≈0.5–07 in simulation F20 about double that for pure ice (F ≈0.3–0.35).
predomi-Figure 4.Evolution of localization factors (F) with strain quanti-fying strain localization in the microstructures for all simulations. A factor of 0 represents homogeneous deformation; the factor in-creases towards one with increased strain-rate heterogeneity and lo-calization. The normalized von Mises strain-rate maps at 1, 30 and 53 % vertical strain are shown for reference. The maps are subdi-vided to show results of simulation F20 in the upper third, F05 in the middle and F00 in the lower third part of the model box. They illustrate strain localization at different stages of the simulation.
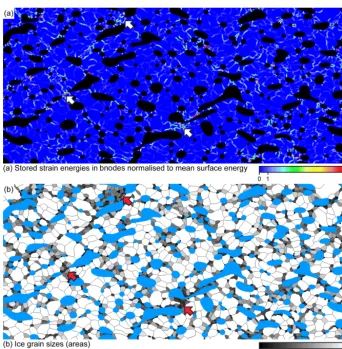
nantly located in high strain (rate) zones. Examples are indi-cated by large arrows in Fig. 5a and between three elongated and large air inclusions in the lower middle region of the final microstructure of F20. Conversely, the contributions of sur-face and strain energy to grain-boundary migration are about equal in less strained areas.
Qualitatively, microstructure images show a heteroge-neous grain size distribution (Fig. 3). To further visual-ize the spatial distribution of grain svisual-izes, the microstruc-ture in Fig. 5b shows ice grains coloured according to their area. Analogous to the driving force distribution for grain-boundary migration, we observe the smallest grains between air inclusions coinciding with zones of marked strain local-ization.
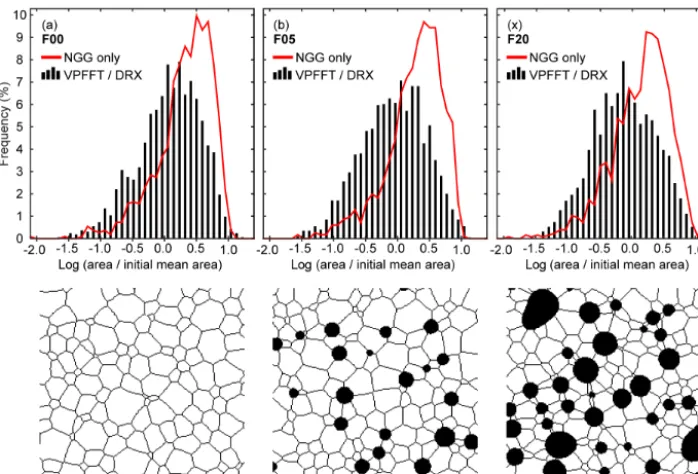
Figure 6 depicts ice grain size statistics for the final mi-crostructures. To visualize the influence of dynamic recrys-tallization, grain size histograms are compared with NGG simulation results. All simulations show an increase of av-erage grain areas with respect to the initial mean grain sizes (Fig. 6, Table 1). However, DRX simulations resulted in a grain size distribution skewed towards smaller grain sizes than for NGG simulations. Furthermore, the distribution of grain sizes is broadened when DRX was active. With increas-ing amount of air in simulations F05 and F20, the average
grain-size increase compared to the initial state is lower for both DRX and NGG results.
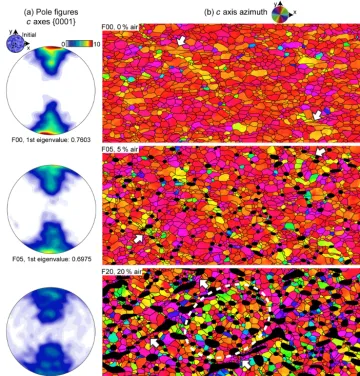
Crystallographic preferred orientations in simulations are visualized using pole figures and maps of caxis azimuths (Fig. 7). The evolution of orientations is also illustrated in movies to be found in the AV Portal of TIB Hannover (av.tib.eu). After 53 % of vertical shortening, the initially ran-dom fabric is rearranged withcaxes preferentially oriented parallel to the vertical shortening direction (Fig. 7a). This maximum becomes less pronounced with increasing amount of air as reflected in pole figures and quantified by a de-crease in first eigenvalues of the orientation distribution from 0.80 (F00) to 0.69 (F20). This trend is also visible incaxis orientation maps (Fig. 7b), which shows a more heteroge-neous distribution of well-aligned and random fabrics with increasing air content. Most grains in simulation F00 have caxes azimuths parallel to the y axis. Grains within high strain bands are marked by a slight tilt of thecaxes to the left or right, depending on the orientation of the shear bands. In contrast, simulation F05 and, even more, F20 show areas of small grains withc axes strongly aligned perpendicular to high strain bands (white arrows in Fig. 7b). This means that the basal planes are aligned parallel to these bands. In low strain areas, such as the middle part of the F20 model, a much more randomcaxis distribution is observed (white circle in Fig. 7b) compared to simulation F00.
4 Discussion
4.1 Strain localization
Our simulations indicate a distinct strain localization in both pure ice and ice with bubbles. Strain localization is not a transient effect, but it actually increases, at least up to about 40 % of strain (Fig. 4). Strain localization in pure ice (F00) is related to the plastic anisotropy of the ice crystal. Grains, or clusters of grains, with initially suitable orientations for slip accommodate strain more efficiently and thus initiate the first regions of strain-rate localization. With progressive strain these localization zones may strengthen as the basal planes align themselves with the local shear plane, or they are deactivated when either the internal lattice orientations or the orientation of the localization zones become less suit-able for further localization. Once deactivated, the localized zones only rotate and move passively with the bulk deforma-tion and may remain visible as shear bands in the finite strain grid. Our observation of strain localization in a polyphase aggregate is consistent with numerical models by Cyprych et al. (2016), who predict strain localization as an important mechanism in polyphase materials, such as ice with soft or hard inclusions.
Figure 5.Details of results of simulation F20 at 53 % vertical shortening.(a)Boundary nodes colour-coded according to the proportion of strain-induced boundary migration. Air inclusions are plotted in black since they do not contribute to strain-induced boundary migration.
(b)Microstructure colour-coded according to the areas of ice grains, with air inclusions displayed in blue. Smallest grains appear grey to black. Arrows in both images indicate zones of marked strain localization.
leads to the formation of localization zones, especially in power law materials (Jessell et al., 2009). With increasing air fraction, the arrangement and geometry of air inclusions become the main controllers of strain localization in the ice– air aggregates and crystallographic orientations exert only a secondary control. The additional localization mechanism causes stronger localization in ice with air than without air.
The localization zones enclose lozenge-shaped areas of low strain rate, which we term microlithons, in keeping with terminology used in geology (e.g. Passchier and Trouw, 2005 p. 78). In pure ice, the CPO within the microlithons is strong and trends towards a single maximum fabric. With air in-clusions causing intensified strain localization, the CPO is expected to be more heterogeneous with differences between high and low strain-rate zones. Within localization zones, the basal planes rotate towards the local shear plane, causing a divergence of the c axes azimuths away from the vertical compression direction. This is in contrast to the microlithons, in which CPO development is slower because of the
rela-tively low strain rate. The weaker bulk single maximum fab-ric with increasing amount of air is thus an effect of air in-clusions causing distinctly localized zones that accommodate most of the deformation and less deformed microlithons that preserve the initial fabric. Our results are an illustrative ex-ample of the role of second phases on CPO development. If the weak phase is the secondary phase and the strong phase is load bearing, as in our simulations, strain localization con-trolled by the distribution of second-phase inclusions. This produces a locally weaker CPO in the microlithons as well as in the bulk material.
Figure 6.Comparison of ice grain area histograms of the last simulation step of simulations(a)F00,(b)F05 and(c)F20. Normal grain growth (NGG) simulations using F00, F05 and F20 input models are displayed with the respective deformation and dynamic recrystallization (VPFFT/DRX) simulation results. Areas were normalized to initial mean values that plot at a value of 0.0 onxaxis. For reference, a fourfold zoom in the resulting microstructures from NGG simulations is displayed below the histograms.
(Freitag et al., 2008) and absence of grain-boundary sliding (Theile et al., 2011).
4.2 Natural firn microstructures and numerical simulations
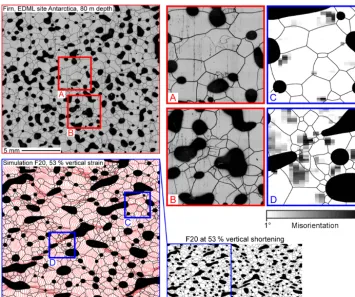
For comparison with natural ice and firn core samples, a mi-crostructure image from 80 m depth from the EDML site is used (Fig. 8). For this image, a 2-D sample was vertically cut from the firn core and processed for microstructure mapping as described in Kipfstuhl et al. (2006, 2009) using a large area scan macroscope (Krischke et al., 2015). Here, we refrain from any detailed or quantitative comparison of our numeri-cal simulations with respect to grain sizes, bubble size, shape or distribution. Such comparisons are hindered by model as-sumptions such as assuming an incompressible air phase or area conserving pure shear deformation (Sect. 4.5). We ob-served air inclusions coalescing during our simulations. This is expected from static polyphase grain-growth simulations by Roessiger et al. (2014) but may be suppressed in firn as simultaneous shrinkage of bubbles may hinder them from touching and merging.
The F20 and EDML microstructure show qualitative sim-ilarities (Fig. 8), in particular in the heterogeneity in grain shape and relative grain size distribution. As an estimate for numerical subgrain boundary density, average misorien-tation between unodes was plotted together with the grain-boundary network. In case of natural firn, detail area A (Fig. 8) contains larger grains, with more 120◦angles at triple
junctions and a lower density of subgrain boundaries than area B, which is characterized by a higher density of bubbles. Visually, similar areas can be found in simulation F20. Area C has large grains with straight grain boundaries and 120◦ angles at triple junctions and lower misorientations (qualita-tively comparable to A), and area D is characterized by small grains relative to C. Triple junction angles in D differ from 120◦and D has higher internal misorientations (qualitatively comparable to B). The grain sizes can only be compared rela-tively, as mean grain size in simulation and sample differ. Be-sides, this natural sample is a 2-D slice through a 3-D body, but the simulations are purely 2-D. For more rigorous com-parisons, corrections for stereologic issues are required.
Figure 7.Overview ofcaxis orientations at 53 % vertical shortening for all simulations.(a)Pole figures with the projection plane parallel to thex−yplane of the 2-D model.(b)Maps ofcaxis azimuth distributions. Air inclusions are shown in black. White arrows in both images indicate zones of marked strain localization. Dotted white line indicates zone of low strain where more random crystallographic orientations are preserved.
an improved understanding of how DRX is distributed within the ice–air aggregate.
4.3 Implications of strain localization for the occurrence of dynamic recrystallization
According to published deformation mechanism maps (Shoji and Higashi, 1978; Goldsby, 2006), dislocation creep is to be expected for the average grain size, strain rate and tem-perature of our simulations. Also, the effective density of the simulation F20 (approximately 750 kg m−3)is above the crit-ical density of 550 kg m−3where plastic deformation via dis-location creep is classically supposed to dominate (Maeno and Ebinuma, 1983). Therefore, we assume that our model assumption of deformation accommodated by dislocation creep only is sufficient to draw conclusions on mechanisms acting at comparable densities and depth in nature.
es-Figure 8.Comparison of simulation results of F20 at 53 % vertical shortening with firn microstructure mapping images from the EDML ice core site at 80 m depth (courtesy of Sepp Kipfstuhl). The detail areas A–D illustrate different microstructures occurring in relation to strain localization. Grain boundaries stand out as black lines and subgrain boundaries are visible as fainter grey lines. Vertical stripes appearing in the overview image are related to the sample polishing technique and not reflecting any microstructural property. Greyscales C and D indicate local average misorientations as stored in unodes and therefore appear blurred due to the strong magnification. Note, however, that strain paths of the natural microstructure (compaction) and the simulation (pure shear) are not identical and the comparison is restricted to the microstructural similarities and inferred localization and recrystallization processes.
sentially restricted to the basal part of ice sheets and therefore an improbable process in firn.
Faria et al. (2014b, p. 45) theoretically discuss the relation of strain localization to localized DRX in firn. They state that although the overall stresses and strains in firn are low, it is “characterized by large strain variability” and locally highly increased stresses and strains depending on the geometry of the air bubble network. They further conclude that stored strain energy could be very high in particular regions of the ice skeleton causing DRX to start in shallow levels. Our sim-ulations are coherent with this statement and confirm the the-oretical predictions by Faria et al. (2014b).
Since improving microstructural imaging methods by Kipfstuhl et al. (2006) gave further insight in firn microstruc-tures, studies by Weikusat et al. (2009) and Kipfstuhl et al. (2009) gave microstructural evidence for DRX in shallow parts of the ice column and firn. In contrast to assumptions by for instance De la Chapelle et al. (1998), it therefore seems probable that DRX already takes place at very shallow levels in the ice sheet, at least in localized zones. Our simulations at−30◦C as well as observations of natural firn
microstruc-tures at EDML ice coring site (Kipfstuhl et al., 2009) with approximately−45◦C annual mean temperature (Oerter et al., 2009) indicate that even at low temperatures deformation provides enough energy to allow for strain-induced grain-boundary migration. The relative dominance of this process is also a function of strain rate, since locally high strain rates and stress concentrations at bridges between the air in-clusions induce high driving forces. This is in accordance with the recrystallization diagram by Faria et al. (2014b), in which the occurrence of recrystallization mechanisms is es-sentially a function of temperature and strain rate (i.e. work rate, which is the product of stress and strain rate) rather than depth.
ef-fects of rotation recrystallization in these suspected high-strain zones, even at the lower natural high-strain rate.
Because of DRX, grain shapes are mostly equidimen-sional, even in the highest-strain bands. Recrystallization thus masks the localization in the microstructure (Llorens et al., 2016b), making it difficult to discern strain localiza-tion in natural samples. Subtle indicalocaliza-tions of localizalocaliza-tion may, however, be zones with a deviating lattice orientation (Fig. 7) (Jansen et al., 2016) or zones with a smaller grain size (Fig. 5b). In single-phase ice, where localization zones shift through the material, only the youngest localization zones may be visible, as the microstructure is reset in ex-tinct localization bands (compare simulation F00 in Figs. 3 and 7) (Jansen et al., 2016). Since bubbles fix the locations of shear localization, their presence may be more obvious in natural samples, such as the one from the EDML (Fig. 8). In general, bubbles may only be useful to discern localization zones (as in F20), if the bubbles are large and strain rates are high enough, which will cause elongated bubble shapes. 4.4 Grain size analyses
We refrain from a detailed comparison of our grain-size data and those observed in nature as a discussion of the stereo-logic issues related to our 2-D model and sections through 3-D natural samples would be beyond the scope of this pa-per. Furthermore, the limitations of the current modelling ap-proach, such as the large initial grain size, requirement of fast strain rates and incompressibility of air inclusions, do not al-low for such a detailed quantitative study. Still, the grain size statistics of the simulation results provide a comparison be-tween the distribution for the non-deformation-related NGG and deformation-induced DRX with varying amounts of air.
An increase in grain size is observed in all simulations, but less for DRX and also less with an increasing amount of air inclusions. The observation of a lower final grain sizes for higher amounts of air is related to the growth regimes presented by Roessiger et al. (2014) based on numerical sim-ulations on NGG in ice–air aggregates. (1) The first regime is characterized by ice grain sizes less than bubble spacing, where most grains can grow unhindered by bubbles as in single-phase polycrystalline ice. The growth rate is constant. (2) The second regime is a transitional regime, where bubble spacing is close to the grain diameter and the growth rate de-creases. (3) In the third regime, all grains are in contact with bubbles. A slow, but steady growth rate is reached again, con-trolled by the coalescence rate of bubbles that increases their spacing. In our case, NGG in the simulations with air inclu-sions is slowed down, indicating regime (2) growth with a small, but significant, fraction of the grains in contact with inclusions, and thus hindered in their growth (Fig. 6).
In comparison with NGG simulations, our VPFFT simula-tions with DRX show smaller final grain sizes and broader distributions. The broadening reflects the microstructural heterogeneity induced by dynamic recrystallization (in
par-ticular grain splitting during rotation recrystallization) and strain localization. Locally, grains size has remained small due to rotation recrystallization, whereas in other, low strain-rate regions, grain sizes have increased. Here surface energy constituted a significant, if not dominant, proportion of the driving force for grain-boundary migration. These results are consistent with the observed broadening of the grain size distribution with depth in firn from the EDML site (Kipfs-tuhl et al., 2009), accompanied by an increasing number of deformation-related substructures such as subgrain bound-aries and irregular boundary shapes. Our modelling confirms the interpretation by Kipfstuhl et al. (2009) that this trend is related to the onset of DRX.
4.5 Limitations of the modelling approach
In our polyphase simulations, air inclusions are modelled as an incompressible material. By imposing pure shear, we as-sume a deformation mode that conserves the total area and in turn the mass of both phases. However, in natural firn, most of the vertical thinning is achieved compaction. Compaction is a function of the surface energy driving movement of the ice–air interface and the counteracting inner bubble pressure that depends on overburden pressure and bubble size and shape. Our model assumes equilibrium between those pres-sures leading to a stable fraction of air. This is controlled by the area energy that is incorporated in the pre-factorc. The lower this factor is, the more influence of surface energy is al-lowed and the more the conservation of mass requirement is violated as more inward movement of the ice–air interface is allowed. The pre-factor constantc(Eq. 4) was adjusted to al-low slight changes in cross-sectional area that keep the over-all amount of air in the model constant but compensate shape changes due to deformation to maintain an approximately circular bubble shape and allow bubbles to merge. Prepara-tory tests yieldedc=0.1 as a suitable value to achieve this compromise. More detailed research is necessary to study the effect of a varyingcor scale it to natural ice.
as an ice Ih symmetry crystal with equal basal, pyramidal and prismatic critical resolved shear stresses that are all 5000 times lower than for ice basal slip. This leaves the air phase slightly anisotropic. However, this assumption does not sig-nificantly affect the results since the effective contrast in slip resistance is significantly higher with a stress exponent of three (Eq. 1). To further investigate any effects on the re-sults, we compared our approach with an updated VPFFT code that avoids any crystallography in the air phase by im-posing zero stiffness to air unodes, thus causing their stresses to vanish (Lebensohn et al., 2011, 2013). This was done by applying both our and the updated VPFFT approach to the initial set-up of F20 for an increment of 1 % vertical shorten-ing to compute the instantaneous strain rate and stress distri-butions. The results are essentially the same for both set-ups (see Supplement Fig. S2) and show that the predictions of our simulations are not significantly affected by how we treat the air phase. Future simulations should include the optimized VPFFT approach imposing zero stiffness to air unodes.
Initial and final numerical grain sizes are larger than in natural firn, in particular with respect to the relatively high numerical strain rate. We chose to use initial grain sizes comparable to previous numerical simulations by Llorens et al. (2016a, b) and not to natural firn as other model as-sumptions would still hinder quantitative comparisons to nat-ural samples. Adopting different grain-boundary mobilities can significantly alter the resulting grain size. Therefore, we chose to use accepted literature values for grain-boundary mobility as experimentally derived by Nasello et al. (2005) and used for previous numerical simulations by Roessiger et al. (2014), Llorens et al. (2016a, b) and Jansen et al. (2016). Although the use of lower mobilities would decrease the pre-dicted grain sizes, the use of accepted literature values is more justified with respect to the scope of the study. Atom-istic processes driving recrystallization may be decelerated in nature due to the presence of impurities and pinning mi-croparticles, which our simulation approach does not take into account. Any future comparison of simulations with natural ice may necessitate unexpectedly low or high val-ues for material parameters, such as an adapted lower grain-boundary mobility, to achieve a more realistic grain size. In-vestigating a more suitable numerical mobility remains part of future developments.
While the model scale affects the Elle recrystallization processes and in turn grain sizes, the VPFFT approach is dimensionless and scale independent. The strain localiza-tion bands and associated balance of recrystallizalocaliza-tion driving forces is predicted by the VPFFT routine. This implies that the main observations and interpretations drawn in this paper in relation to strain localization remain valid independently of the numerical grain sizes.
5 Conclusions
We used polyphase numerical models of deformation and crystallization to investigate the occurrence of dynamic re-crystallization in an air–ice composite such as polar ice and firn. To our knowledge this provides the first full-field nu-merical simulation results on dynamic recrystallization in polyphase crystalline aggregates in glaciology. We show that strain and strain-rate localization is to be expected during ice deformation, forming shear bands that accommodate signif-icant amounts of strain. Dynamic recrystallization can occur at relatively shallow levels of the ice sheet where it is re-lated to strain localization and stress concentrations between the air inclusions. This results in an increased heterogeneity in ice sheet deformation and more dynamic recrystallization activity than previously assumed. In fact, strain localization is probably not the exception, but the rule in ice sheets and glaciers. Wherever present, second phases such as air bub-bles provide an effective mechanism for strain localization in addition to mechanical anisotropy. Due to strain localiza-tion, the rate of fabric change can be high locally, which is of special importance in firn, where bubbles are most abun-dant. The effects of localization and heterogeneity in dis-tribution of firn recrystallization and deformation could be considered in future firn densification models. Furthermore, as the utilized VPFFT approach is dimensionless, future re-search could investigate the probably large range of scales at which strain localization may occur in glaciers and ice sheets.
6 Data availability
The video supplement related to this article is available online from the AV Portal of TIB Hannover (av.tib.eu). Simulation F00:
doi:10.5446/19279 – grain boundaries doi:10.5446/19281 – passive marker grid doi:10.5446/19280 – orientations ofcaxes doi:10.5446/19282 – strain rates
Simulation F05:
doi:10.5446/19283 – grain boundaries doi:10.5446/19285 – passive marker grid doi:10.5446/19284 – orientations ofcaxes doi:10.5446/19286 – strain rates
Simulation F20:
The Supplement related to this article is available online at doi:10.5194/tc-10-3071-2016-supplement.
Acknowledgements. We are thankful for support and helpful discussions with the members of the Elle community. We thank Till Sachau, Sepp Kipfstuhl and Johannes Freitag for their input to improve the manuscript as well as the helpful comments by two anonymous reviewers. This study was funded by the DFG (SPP 1158) grant BO 1776/12-1. Furthermore, we acknowledge funding by the Helmholtz Junior Research group “The effect of deformation mechanisms for ice sheet dynamics” (VH-NG-802) and travelling funds for presenting and improving this study by the EPICA Descartes travel price, the ESF research networking programme on the microdynamics of ice (MicroDICE) and the Helmholtz Graduate School for Polar and Marine Research (POLMAR).
Edited by: C. Ritz
Reviewed by: two anonymous referees
References
Alley, R. B.: Texture of polar firn for remote sensing, Ann. Glaciol., 9, 1–4, 1987.
Alley, R. B., Gow, A. J., and Meese, D. A.: Mapping c-axis fabrics to study physical processes in ice, J. Glaciol., 41, 197–203, 1995. Anderson, D. L. and Benson, C. S.: The densification and diagene-sis of snow, in: Ice and Snow: Properties, Processes and Appli-cations, MIT Press, 1963.
Arena, L., Nasello, O. B., and Levi, L.: Effect of bubbles on grain growth in ice, J. Phys. Chem. B, 101, 6109–6112, 1997. Azuma, N. and Higashi, A.: Formation processes of ice fabric
pat-tern in ice sheets, Ann. Glaciol., 6, 130–134, 1985.
Azuma, N., Miyakoshi, T., Yokoyama, S., and Takata, M.: Impeding effect of air bubbles on normal grain growth of ice, J. Struct. Geol., 42, 184–193, 2012.
Bachmann, F., Hielscher, R., and Schaeben, H.: Texture analysis with MTEX-free and open source software toolbox, Sol. St. Phen., 160, 63–68, 2010.
Becker, J. K., Bons, P. D., and Jessell, M. W.: A new front-tracking method to model anisotropic grain and phase boundary motion in rocks, Comput. Geosci., 34, 201–212, 2008.
Blackford, J. R.: Sintering and microstructure of ice: a re-view, J. Phy. D Appl. Phys., 40, R355, doi:10.1088/0022-3727/40/21/R02, 2007.
Bons, P., Koehn, D., and Jessell, M.: Microdynamics Simulation, Volume 106 of Lecture Notes in Earth Sciences, Springer Berlin Heidelberg, 2008.
Bons, P. D., Jansen, D., Mundel, F., Bauer, C. C., Binder, T., Eisen, O., Jessell, M. W., Llorens, M.-G., Steinbach, F., Steinhage, D., and Weikusat, I.: Converging flow and anisotropy cause large-scale folding in Greenland’s ice sheet, Nature Communications, 7, doi:10.1038/ncomms11427, 2016.
Borthwick, V. E., Piazolo, S., Evans, L., Griera, A., and Bons, P. D.: What happens to deformed rocks after deformation? A refined model for recovery based on numerical simulations, Geological Society, London, Special Publications, 394, 215–234, 2014.
Brinckmann, S., Siegmund, T., and Huang, Y.: A dislocation den-sity based strain gradient model, Int. J. Plasticity, 22, 1784–1797, 2006.
Budd, W. and Jacka, T.: A review of ice rheology for ice sheet mod-elling, Cold Reg. Sci. Technol., 16, 107–144, 1989.
Castelnau, O., Thorsteinsson, T., Kipfstuhl, J., Duval, P., and Canova, G.: Modelling fabric development along the GRIP ice core, central Greenland, Ann. Glaciol., 23, 194–201, 1996. Colbeck, S.: Theory of metamorphism of dry snow, J. Geophys.
Res.-Oceans, 88, 5475–5482, 1983.
Cyprych, D., Brune, S., Piazolo, S., and Quinteros, J.: Strain local-ization in polycrystalline material with second phase particles: Numerical modeling with application to ice mixtures, Geochem. Geophys. Geosys., 19, 9, doi:10.1002/2016GC006471, 2016. Davy, P., Hansen, A., Bonnet, E., and Zhang, S.-Z.: Localization
and fault growth in layered brittle-ductile systems: Implications for deformations of the continental lithosphere, J. Geophys. Res.-Sol. Ea., 100, 6281–6294, 1995.
De La Chapelle, S., Castelnau, O., Lipenkov, V., and Duval, P.: Dynamic recrystallization and texture development in ice as re-vealed by the study of deep ice cores in Antarctica and Green-land, J. Geophys. Res.-Sol. Ea., 103, 5091–5105, 1998. Duval, P.: Creep and recrystallization of polycrystalline ice, B.
Min-eral., 102, 80–85, 1979.
Duval, P.: Grain growth and mechanical behaviour of polar ice, Ann. Glaciol., 6, 79–82, 1985.
Duval, P. and Castelnau, O.: Dynamic Recrystallization of Ice in Polar Ice Sheets, J. Physique IV, 05, C3-197-C193-205-C193, 1995.
Duval, P., Ashby, M. F., and Anderman, I.: Rate-controlling pro-cesses in the creep of polycrystalline ice, J. Phys. Chem., 87, 4066–4074, 1983.
Duval, P., Arnaud, L., Brissaud, O., Montagnat, M., and de La Chapelle, S.: Deformation and recrystallization processes of ice from polar ice sheets, Ann. Glaciol., 30, 83–87, 2000.
Faria, S. H., Freitag, J., and Kipfstuhl, S.: Polar ice structure and the integrity of ice-core paleoclimate records, Quaternary Sci. Rev., 29, 338–351, 2010.
Faria, S. H., Weikusat, I., and Azuma, N.: The microstructure of po-lar ice. Part I: Highlights from ice core research, J. Struct. Geol., 61, 2–20, 2014a.
Faria, S. H., Weikusat, I., and Azuma, N.: The microstructure of polar ice. Part II: State of the art, J. Struct. Geol., 61, 21–49, 2014b.
Fischer, H., Behrens, M., Bock, M., Richter, U., Schmitt, J., Louler-gue, L., Chappellaz, J., Spahni, R., Blunier, T., Leuenberger, M., and Stocker, T. F.: Changing boreal methane sources and con-stant biomass burning during the last termination, Nature, 452, 864–867, 2008.
Fliervoet, T. F., White, S. H., and Drury, M. R.: Evidence for dominant grain-boundary sliding deformation in greenschist-and amphibolite-grade polymineralic ultramylonites from the Red-bank Deformed Zone, Central Australia, J. Struct. Geol., 19, 1495–1520, 1997.
Gao, X. and Jacka, T. H.: The approach to similar tertiary creep rates for Antarctic core ice and laboratory prepared ice, Le Journal de Physique Colloques, 48, C1-289–C281-296, 1987.
Glen, J.: The flow law of ice: A discussion of the assumptions made in glacier theory, their experimental foundations and con-sequences, IASH Publ, 47, 171–183, 1958.
Goldsby, D. L.: Superplastic Flow of Ice Relevant to Glacier and Ice-Sheet Mechanics, Glacier Science and Environmental Change, edited by: Knight, P. G., Blackwell Publishing, Malden, MA, USA, 308–314, doi:10.1002/9780470750636.ch60, 2006. Gow, A. J.: On the rates of growth of grains and crystals in south
polar firn, J. Glaciol., 8, 241–252, 1969.
Griera, A., Bons, P. D., Jessell, M. W., Lebensohn, R. A., Evans, L., and Gomez-Rivas, E.: Strain localization and porphyroclast rotation, Geology, 39, 275–278, 2011.
Griera, A., Llorens, M.-G., Gomez-Rivas, E., Bons, P. D., Jessell, M. W., Evans, L. A., and Lebensohn, R.: Numerical modelling of porphyroclast and porphyroblast rotation in anisotropic rocks, Tectonophysics, 587, 4–29, 2013.
Herron, M. M. and Langway Jr, C. C.: Firn densification: an empir-ical model, J. Glaciol., 25, 373–385, 1980.
Hirth, G. and Tullis, J.: Dislocation creep regimes in quartz aggre-gates, J. Struct. Geol., 14, 145–159, 1992.
Humphreys, F. J. and Hatherly, M.: Recrystallization and related annealing phenomena, Elsevier, 2004.
Jacka, T. H. and Li, J.: The steady-state crystal size of deforming ice, Ann. Glaciol., 20, 13–18, 1994.
Jansen, D., Llorens, M.-G., Westhoff, J., Steinbach, F., Kipfstuhl, S., Bons, P. D., Griera, A., and Weikusat, I.: Small-scale distur-bances in the stratigraphy of the NEEM ice core: observations and numerical model simulations, The Cryosphere, 10, 359–370, doi:10.5194/tc-10-359-2016, 2016.
Jessell, M., Bons, P., Evans, L., Barr, T., and Stüwe, K.: Elle: the nu-merical simulation of metamorphic and deformation microstruc-tures, Comput. Geosci., 27, 17–30, 2001.
Jessell, M. W., Bons, P. D., Griera, A., Evans, L. A., and Wilson, C. J. L.: A tale of two viscosities, J. Struct. Geol., 31, 719–736, 2009.
Ketcham, W. M. and Hobbs, P. V.: An experimental determination of the surface energies of ice, Philoso. Mag., 19, 1161–1173, 1969.
Kipfstuhl, S., Hamann, I., Lambrecht, A., Freitag, J., Faria, S. H., Grigoriev, D., and Azuma, N.: Microstructure mapping: a new method for imaging deformation-induced microstructural fea-tures of ice on the grain scale, J. Glaciol., 52, 398–406, 2006. Kipfstuhl, S., Faria, S. H., Azuma, N., Freitag, J., Hamann, I.,
Kauf-mann, P., Miller, H., Weiler, K., and Wilhelms, F.: Evidence of dynamic recrystallization in polar firn, J. Geophys. Res.-Sol. Ea., 114, B05204, doi:10.1029/2008JB005583, 2009.
Krischke, A., Oechsner, U., and Kipfstuhl, S.: Rapid Microstructure Analysis of Polar Ice Cores, Optik & Photonik, 10, 32–35, 2015. Lebensohn, R. A.: N-site modeling of a 3D viscoplastic polycrystal using Fast Fourier Transform, Acta Mater., 49, 2723–2737, 2001. Lebensohn, R. A., Montagnat, M., Mansuy, P., Duval, P., Meyson-nier, J., and Philip, A.: Modeling viscoplastic behavior and het-erogeneous intracrystalline deformation of columnar ice poly-crystals, Acta Mater., 57, 1405–1415, 2009.
Lebensohn, R. A., Idiart, M., Castañeda, P. P., and Vincent, P.-G.: Dilatational viscoplasticity of polycrystalline solids with inter-granular cavities, Philos. Maga., 91, 3038–3067, 2011.
Lebensohn, R. A., Escobedo, J. P., Cerreta, E. K., Dennis-Koller, D., Bronkhorst, C. A., and Bingert, J. F.: Modeling void growth in polycrystalline materials, Acta Mater., 61, 6918–6932, 2013. Llorens, M.-G., Bons, P. D., Griera, A., and Gomez-Rivas, E.: When
do folds unfold during progressive shear?, Geology, 41, 563–566, 2013a.
Llorens, M.-G., Bons, P. D., Griera, A., Gomez-Rivas, E., and Evans, L. A.: Single layer folding in simple shear, J. Struct. Geol., 50, 209–220, 2013b.
Llorens, M.-G., Griera, A., Bons, P. D., Roessiger, J., Lebensohn, R., Evans, L., and Weikusat, I.: Dynamic recrystallisation of ice aggregates during co-axial viscoplastic deformation: a numeri-cal approach, J. Glaciol., 52, 359–377, doi:10.1017/jog.2016.28, 2016a.
Llorens, M.-G., Griera, A., Bons, P. D., Lebensohn, R., Evans, L., Jansen, D., and Weikusat, I.: Full-field prediction of ice dynamic recrystallisation under simple shear conditions, Earth Planet. Sci. Lett., 450, 233–242, doi:10.1016/j.epsl.2016.06.045, 2016b. Luethi, D., Le Floch, M., Bereiter, B., Blunier, T., Barnola, J.-M.,
Siegenthaler, U., Raynaud, D., Jouzel, J., Fischer, H., Kawamura, K., and Stocker, T. F.: High-resolution carbon dioxide concentra-tion record 650,000-800,000 years before present, Nature, 453, 379–382, 2008.
Maeno, N. and Ebinuma, T.: Pressure sintering of ice and its im-plication to the densification of snow at polar glaciers and ice sheets, J. Phys. Chem., 87, 4103–4110, 1983.
Mainprice, D., Hielscher, R., and Schaeben, H.: Calculating anisotropic physical properties from texture data using the MTEX open-source package, Geological Society, London, Spe-cial Publications, 360, 175–192, 2011.
Montagnat, M., Castelnau, O., Bons, P. D., Faria, S. H., Gagliardini, O., Gillet-Chaulet, F., Grennerat, F., Griera, A., Lebensohn, R. A., Moulinec, H., Roessiger, J., and Suquet, P.: Multiscale mod-eling of ice deformation behavior, J. Struct. Geol., 61, 78–108, 2014.
Nasello, O. B., Prinzio, C. L. D., and Guzmán, P. G.: Temperature dependence of “pure” ice grain boundary mobility, Acta Mater., 53, 4863–4869, 2005.
Oerter, H., Druecker, C., Kipfstuhl, S., and Wilhelms, F.: Kohnen station-the drilling camp for the EPICA deep ice core in Dron-ning Maud Land, Polarforschung, Bremerhaven, Alfred Wegener Institute for Polar and Marine Research & German Society of Po-lar Research, 78, 1–23, 2009.
Passchier, C. W. and Trouw, R. A. J.: Microtectonics, Springer, 2005.
Petrenko, V. F. and Whitworth, R. W.: Physics of ice, Clarendon Press, 1999.
Piazolo, S., Jessell, M. W., Bons, P. D., Evans, L., and Becker, J. K.: Numerical simulations of microstructures using the Elle plat-form: a modern research and teaching tool, J. Geol. Soc. India, 75, 110–127, 2010.
Riche, F., Montagnat, M., and Schneebeli, M.: Evolution of crystal orientation in snow during temperature gradient metamorphism, J. Glaciol., 59, 47–55, 2013.
Competition between grain growth and grain-size reduction in polar ice, J. Glaciol., 57, 942–948, 2011.
Roessiger, J., Bons, P. D., and Faria, S. H.: Influence of bubbles on grain growth in ice, J. Struct. Geol., 61, 123–132, 2014. Schulson, E. M. and Duval, P.: Creep and fracture of ice, Cambridge
University Press Cambridge, 2009.
Schwander, J. and Stauffer, B.: Age difference between polar ice and the air trapped in its bubbles, Nature, 311, 45–47, 1984. Shoji, H. and Higashi, A.: A deformation mechanism map of ice, J.
Glaciol., 21, 419–427, 1978.
Sornette, A., Davy, P., and Sornette, D.: Fault growth in brittle-ductile experiments and the mechanics of continental collisions, J. Geophys. Res.-Sol. Ea., 98, 12111–12139, 1993.
Stauffer, B., Schwander, J., and Oeschger, H.: Enclosure of air dur-ing metamorphosis of dry firn to ice, Ann. Glaciol., 6, 108–112, 1985.
Steinemann, S.: Flow and recrystallization of ice, IASH Publ, 39, 449–462, 1954.
Stephenson, P. J.: Some considerations of snow metamorphism in the Antarctic ice sheet in the light of ice crystal studies, Phys. Snow Ice, 1, 725–740, 1967.
Theile, T., Löwe, H., Theile, T. C., and Schneebeli, M.: Simulat-ing creep of snow based on microstructure and the anisotropic deformation of ice, Acta Mater., 59, 7104–7113, 2011.
Treverrow, A., Budd, W. F., Jacka, T. H., and Warner, R. C.: The tertiary creep of polycrystalline ice: experimental evidence for stress-dependent levels of strain-rate enhancement, J. Glaciol., 58, 301–314, 2012.
Urai, J. L., Means, W. D., and Lister, G. S.: Dynamic recrystalliza-tion of minerals, in: Mineral and rock deformarecrystalliza-tion: laboratory studies, American Geophysical Union Washington, DC, 161– 199, 1986.
Weikusat, I., Kipfstuhl, S., Faria, S. H., Azuma, N., and Miyamoto, A.: Subgrain boundaries and related microstructural features in EDML (Antarctica) deep ice core, J. Glaciol., 55, 461–472, 2009. Weikusat, I., de Winter, D., Pennock, G., Hayles, M., Schneijden-berg, C., and Drury, M.: Cryogenic EBSD on ice: preserving a stable surface in a low pressure SEM, J. Microscopy, 242, 295– 310, 2011a.
Weikusat, I., Miyamoto, A., Faria, S. H., Kipfstuhl, S., Azuma, N., and Hondoh, T.: Subgrain boundaries in Antarctic ice quantified by X-ray Laue diffraction, J. Glaciol., 57, 111–120, 2011b. White, S.: Geological significance of recovery and recrystallization