www.the-cryosphere.net/10/751/2016/ doi:10.5194/tc-10-751-2016
© Author(s) 2016. CC Attribution 3.0 License.
The influence of a model subglacial lake on
ice dynamics and internal layering
Eythor Gudlaugsson1, Angelika Humbert2,3, Thomas Kleiner2, Jack Kohler4, and Karin Andreassen1
1Centre for Arctic Gas Hydrate, Environment and Climate (CAGE), Department of Geology, UiT – The Arctic University of
Norway, Tromsø, Norway
2Section of Glaciology, Alfred Wegener Institute Helmholtz Center for Polar and Marine Research, Bremerhaven, Germany 3Department of Geosciences, University of Bremen, Bremen, Germany
4Norwegian Polar Institute, Fram Centre, Tromsø, Norway
Correspondence to: Eythor Gudlaugsson (eythor.gudlaugsson@uit.no)
Received: 27 June 2015 – Published in The Cryosphere Discuss.: 28 July 2015 Revised: 18 January 2016 – Accepted: 13 March 2016 – Published: 5 April 2016
Abstract. As ice flows over a subglacial lake, the drop in bed resistance leads to an increase in ice velocities and a draw down of isochrones and cold ice. The ice surface flattens as it adjusts to the lack of resisting forces at the base. The rapid transition in velocity induces changes in ice viscosity and re-leases deformation energy that can raise the temperature lo-cally. Recent studies of Antarctic subglacial lakes indicate that many lakes experience very fast and possibly episodic drainage, during which the lake size is rapidly reduced as wa-ter flows out. Questions that arise are what effect this would have on internal layers within the ice and whether such past drainage events could be inferred from isochrone structures downstream.
Here, we study the effect of a subglacial lake on ice dy-namics as well as the influence that such short timescale drainage would have on the internal layers of the ice. To this end, we use a full Stokes, polythermal ice flow model. An enthalpy-gradient method is used to account for the evolu-tion of temperature and water content within the ice.
We find that a rapid transition between slow-moving ice outside the lake, and full sliding over the lake, can release considerable amounts of deformational energy, with the po-tential to form a temperate layer at depth in the transition zone. In addition, we provide an explanation for a charac-teristic surface feature commonly seen at the edges of sub-glacial lakes, a hummocky surface depression in the transi-tion zone between little to full sliding. We also conclude that rapid changes in the horizontal extent of subglacial lakes and slippery patches, compared to the average ice column
veloc-ity, can create a traveling wave at depth within the isochrone structure that transfers downstream with the advection of ice, thus indicating the possibility of detecting past drainage events with ice penetrating radar.
1 Introduction
Nearly 400 subglacial lakes have been identified in Antarc-tica based on radar data and satellite measurements (Wright and Siegert, 2012), as well as at least two subglacial lakes in Greenland, all of which satisfy established criteria for identi-fication of subglacial lakes (Palmer et al., 2013). Subglacial lakes are typically located either in the ice-sheet interior, close to ice divides where surface slopes are low and ice is thick, or in areas of higher ice velocity where internal ice de-formation and sliding add to geothermal energy to produce melting at the base (Siegert et al., 1996; Dowdeswell and Siegert, 1999).
The reason why so few lakes have been discovered in Greenland, despite considerable efforts and relatively dense surveying compared to Antarctica, is believed to be because of the generally warmer ice and higher surface slopes in Greenland, which favor rapid and more efficient drainage as well as increased vulnerability to drainage instabilities (Pat-tyn, 2008). In addition, the large supply of surface meltwater to the base of the Greenland Ice Sheet through hydrofractur-ing means that the drainage networks in place are probably already highly efficient and, thus, capable of draining sub-glacial water effectively and preventing or limiting subsub-glacial lake development (Palmer et al., 2013).
Apart from Lake Vostok, the largest subglacial lake in the world, as well as a few other ones, the typical subglacial lake is around 10 km in diameter (Siegert, 2000). Recent studies have presented compelling evidence of rapid transport of wa-ter stored in subglacial lakes, indicating that lakes can either drain episodically or transiently on relatively short timescales (Gray et al., 2005; Wingham et al., 2006; Fricker et al., 2007). Lakes appear to form a part of a connected hydrological net-work, with upstream lakes draining into downstream ones as subglacial water moves down the hydrological potential (Siegert et al., 2007). Both ice and water transport a sub-stantial amount of sediment over time which is deposited in the lakes, thus reducing their size over long timescales. Sed-imentation rates can vary from close to 0 to several millime-ters per year, with sediment layers estimated to be up to sev-eral hundreds of meters thick in some lakes (Christoffersen et al., 2008; Bentley et al., 2013). The dominant mechanism in transporting sediment to subglacial lakes is thought to be influx of sediment-laden water for open-system, or active, lakes, and melt-out from the overlying ice for closed-system lakes, where water exchange happens purely through melt-ing and freezmelt-ing (Bentley et al., 2013). Subglacial lakes thus change size on a variety of timescales with different mecha-nisms, from fast drainage to slow sedimentation.
The presence of a subglacial lake is often signalled by a flattening of the ice surface, given that the lake is in hy-drostatic equilibrium, and as a local speed-up of ice veloc-ities. This draws down cold ice and deflects isochrone layers within the ice (Weertman, 1976).
Numerous studies have investigated the effect of spatially varying basal (or surface) conditions on ice dynamics and the internal layering of ice, such as melting or basal resistance. Previously, Leysinger Vieli et al. (2007) studied the effect of areas with basal sliding or melting on internal layer architec-ture, but not explicitly a subglacial lake. The effect of a sub-glacial lake on ice dynamics was investigated by Sergienko et al. (2007), who used a 2-D vertically integrated flow equa-tion to study ice-sheet response to transient changes in lake geometry and basal resistance, and by Pattyn (2008) who in-vestigated the stability of a subglacial lake to drainage events. The interaction between lake circulation and ice dynamics and its effect on the basal mass balance have also been stud-ied by Thoma et al. (2010).
The aim of this study is to investigate the influence of a subglacial lake on ice dynamics and the effect it has on the isochrone structure within the ice. As all stress components are important for such an interaction, we use a fully 3-D ther-momechanically coupled full Stokes ice-sheet model, imple-mented in the commercial finite element software COMSOL. We employ an enthalpy-gradient method to account for the softening effect of ice temperature and water content on ice viscosity (Aschwanden et al., 2012) and we show how tem-porally varying basal conditions can lead to the appearance of flow bands, or arches and troughs, within the internal lay-ering downstream of the original flow disturbance.
2 Model description 2.1 Ice flow
Ice is treated as an incompressible fluid with constant density, obeying conservation laws for mass and momentum:
∇·u=0 (1)
and
∇·σ= −ρg, (2)
whereuis the velocity vector,gthe gravitational accelera-tion,ρ the ice density, andσ the Cauchy stress tensor. The Cauchy stress tensor is given by
σ=τ−pI, (3)
whereτ andpI are the deviatoric and the isotropic parts,
pis pressure, and I is the identity matrix. Inertial forces are assumed negligible and only body forces arising from gravity are taken into account.
Ice is assumed to follow Glen’s flow law (Steinemann, 1954; Glen, 1955), in which deviatoric stresses are related to strain rates (ε˙) by
τ=2ηε˙ (4)
and
η T0, W,ε˙e
=1
2
At(T0, W )
−1n ˙
ε
1−n n
e , (5)
whereηis the effective viscosity, ε˙e is the effective strain
rate, (At) is a rate factor that depends on the homologous
temperature (T0) and the water content of the ice (W), and
nis the power-law exponent in Glen’s flow law. The homol-ogous temperatureT0=T+γ pcorrects for the dependence of the pressure-melting point (Tm) on pressure, whereγ is
At(T , p, W )=A(T , p)×(1+1.8125W[%]), (6)
where
A(T , p)=A(T0)=A0e−Q/RT 0
, (7)
andA0is a pre-exponential constant,Qis the activation
en-ergy, andRis the universal gas constant, with numerical val-ues listed in Table 1 (Greve and Blatter, 2009).
2.2 Enthalpy balance
An enthalpy-gradient method (Aschwanden et al., 2012) is employed, as opposed to the typically used cold-ice formu-lation, which is incapable of reproducing correctly the rheol-ogy of temperate layers within ice sheets. The enthalpy for-mulation allows for the possibility of including liquid water content within temperate ice, based on mixture theory, with-out explicitly tracking the cold/temperate transition surface (Aschwanden et al., 2012; Greve, 1997). In the enthalpy-gradient method, enthalpy replaces temperature as the ther-modynamical state variable, such that
ρ
∂H
∂t +u· ∇H
=∇·
Ki(H )∇H ifH < HTm(p) k(H, p)∇Tm(p)+K0∇H ifH≥HTm(p)
+Q, (8) where H=H (T, W, p) is the temperature and water-content-dependent specific enthalpy and Q=4ηε˙e2 is the heat dissipation due to internal deformation. The conduc-tion term in Eq. (8) depends on whether the ice is cold (H < HTm(p)) or temperate (H≥HTm(p)). The conduction coefficient for cold is ice defined asKi=k/c, wherekis the
thermal conductivity andcis the heat capacity, both assumed to be constant (Table 1). HTm(p)is the specific enthalpy of the pressure-dependent melting point of ice. The diffusiv-ity for temperate ice is poorly constrained as little is known about the transport of microscopic water within temperate ice (Aschwanden et al., 2012; Hutter, 1982). In practice, we use the valueK0=10−3Ki, shown by Kleiner et al. (2015) to be
sufficiently low to suppress transport of water by diffusion through the ice matrix, while still numerically stable. 2.3 Age equation
In addition to the balance equations above, we solve a sep-arate equation for the ice age (χ) to determine the influ-ence of the lake on the isochrone structure (Hindmarsh et al., 2009; Parrenin et al., 2006; Parrenin and Hindmarsh, 2007; Leysinger Vieli et al., 2007):
∂χ
∂t +u· ∇χ=1+
dχ∇2χ
, (9)
whereχ is the age of ice and the second term on the right represents a diffusivity term needed for numerical stability, in whichdχis the numerical diffusivity.
Table 1. Values for constants used in the study.
Constants Values
α bed inclination 0.3, 0.1◦
ρ density of ice 910 kg m−3
g gravitational acceleration 9.81 m s−2
n flow law exponent 3, 1
γ Clausius–Clapeyron constant 9.8×10⁻⁸K Pa−1 Tm0 melting point at atm. pressure 273.15 K
A0 pre-exp. constant (T≤263.15 K) 3.985×10⁻¹³s−1Pa−3
– (T >263.15 K) 1.916×10⁻³s−1Pa−3 Q activation energy (T≤263.15 K) 60 kJ mol−1
– (T >263.15 K) 139 kJ mol−1 R universal gas constant 8.3145 J (mol K)−1 k thermal conductivity 2.1 W (m K)−1
c heat capacity 2009 J (kg K)−1
L latent heat of fusion 3.35×10⁵J kg−1 dχ diffusion coefficient 10−13m2s−1
C friction coefficient 1013, 1010(s m2) kg−1
h ice thickness 1500, 3000m
as surface accumulation 0 m s−1
Ts surface temperature −30◦C
qgeo geothermal flux 55 mW m−2
ηconst ice viscosity (constant) 1014Pa s
2.4 Boundary conditions (BCs)
At the surface, stresses arising from atmospheric pressure and wind can be neglected as they are very small compared to the typical stresses in the ice sheet (Greve and Blatter, 2009), resulting in a traction-free BC:
σ·n=0, (10)
wheren is the normal vector pointing away from the ice. Accumulation and ablation (as) at the surface are assumed to
be 0, giving the kinematic surface BC as
∂zs
∂t +u ∂zs
∂x +v ∂zs
∂y −w=as=0, (11)
where zs is the surface elevation. We employ an
in-verse Weertman-type sliding law (Eq. 12), where the basal drag (τb) is expressed as a function of the velocity of the
ice (ub) immediately above the ice/base interface, except over the lake surface where basal traction is set to 0 (full slip). With basal sliding exponents (p,q)=(1, 0) appropriate for ice-streaming conditions, the sliding relationship simpli-fies to a linear relationship between basal sliding and basal traction. The ice is assumed to be in hydrostatic equilibrium everywhere and the basal normal pressure (τn) taken as the
ub= −C−1
|τb|p−1τb
τnq
= −C−1τb⇒τb=Cub, (12)
and
u·n=0, (13)
where C is the sliding coefficient (Table 1). Periodic BCs for the inlet/outlet are used, such that the velocity, pressure, and specific enthalpy are the same at the upstream and down-stream extremes. On the side boundaries of the domain, sym-metry for velocity and thermal insulation is imposed:
uin=uout pin=pout Hin=Hout, (14)
K=hµ∇u+(∇u)Tin, K−(K·n)n=0,
u·n=0 (15)
−n· ∇H=0. (16)
At the surface, a value is set for specific enthalpy (Hs)
cor-responding to a surface temperature ofTs= −30◦C (Ws=0,
ps=0) such that
Hs=Hi+c (Ts−Tm) . (17)
At the base, the geothermal flux (qgeo) is used for cold ice
and a zero flux for temperate ice:
n·
−Ki∇H
−K0∇H
=
qgeo, ifT < Tm
0, ifT =Tm
, (18) whereHi is the specific enthalpy of pure ice at the melting
temperature. To determine correctly the basal BC for the en-thalpy field equation, switching between a Dirichlet and a Neumann condition is necessary (Aschwanden et al., 2012; Kleiner et al., 2015), depending on basal temperature, water availability at the base, and whether a temperate layer exists immediately above it. Here we opt for a simpler, more com-putationally efficient BC where the geothermal flux is grad-ually decreased in the specific enthalpy range corresponding to [(Tm−0.2◦C) (Tm)], with a smoothed Heaviside function
with continuous derivatives.
For the age–depth relation (Eq. 9), periodic BCs are used for the inlet and outlet. At the surface, the age is set toχs=0.
Zero normal fluxes are used for the side boundaries and the lower boundary.
−n·(−∇χ )=0 (19)
2.5 Computational domain
We define the computational domain as a rectangular box 350 km long and 100 km wide with a fixed bed slope (α).
Table 2. Values for lake sizes used in the paper.
Lake size Major axis Minor axis
LS 10 km 5 km
LM 20 km 10 km
LL 30 km 15 km
Three different lakes sizes are used, based on typical sizes of subglacial lakes found in Antarctica (Siegert et al., 1996; Siegert and Kwok, 2000). The lakes are all elliptical in shape, with major and minor axes defined in Table 2. The major axis is aligned with the direction of flow. The model experiments are all either steady-state solutions or start from steady-state solutions.
Throughout the domain, extruded triangular (prismatic) elements are used with a horizontal resolution down to ∼500 m at the lake edges. This relatively high resolution is needed in order to capture the effect of strain softening of ice around the lake edges, where velocity gradients are large, and to resolve properly the upper surface. The model uses 15 vertical layers, which become thinner towards the base, where the thinnest layer has a thickness of∼35 m.
3 Model experiments
The aim of the study is to show how the presence of a sub-glacial lake affects ice dynamics and thermal resolution and to follow its effects on internal layering through simple tem-porally dependent and steady-state experiments.
All transient simulations are started from an initially steady-state configuration, where equations for mass, mo-mentum, and enthalpy are solved jointly with a direct solver along with equations for surface or grid evolution. All pre-sented results are based on simulations with a fully nonlinear ice viscosity (n=3) unless otherwise stated explicitly, and all numerical values for model constants are defined in Ta-ble 1.
The lake itself is modeled as a “slippery spot” (Pattyn et al., 2004; Sergienko et al., 2007). The lake surface is as-sumed to be fixed to the bed plane. In reality, any changes to lake size or volume would lead to vertical movement of the lake surface, which in itself would induce an expression at the surface of the ice. Sergienko et al. (2007) found that vertical movement of lake surfaces due to drainage resulted only in small changes to ice velocity and that the ice surface reached its initial stage after just a few years, indicating that it would not lead to a significant disturbance in isochrone structure compared to changes in the horizontal lake extent. Here we consider only planar changes in lake geometry or changes in lake size fixed to the bed plane.
Figure 1. Two-dimensional surface plots of horizontal velocity (a) in m a−1and relative surface elevation (b) in meters. The outline of the lake (LM lake size,n=3) and streamlines are shown in black and flow is from left to right.
water pressure and sliding, although no representation of subglacial hydrology is included here. The effect the drain-ing water will have on isochrone layers will depend on the state of the drainage system and how the water is transported downstream (Stearns et al., 2008) but will likely be limited by the swiftness of the ice response compared to the time needed to perturb isochrone layers considerably.
The lack of basal friction over the lake results in increased velocities, not just over the lake but also a considerable dis-tance both upstream and downstream of the lake that depends on ice thickness, basal traction (Hindmarsh, 2006; Kamb and Echelmeyer, 1986), and the size of the lake. This distance is around 15 km for the LS lake size, 50 km for LM, and
100 km for theLLlake size, defined as the distance it takes
for the horizontal velocity to drop below 1.05 times the back-ground velocity. Figure 1a shows the surface velocity with black lines indicating streamlines and Fig. 1b shows the rel-ative change in surface elevation caused by the presence of the lake, where the general slope has been subtracted from the surface. The surface responds to the change in basal con-ditions by becoming flatter and with more than a doubling of horizontal velocities over the lake. Streamlines contract and ice is brought in towards the lake from the sides.
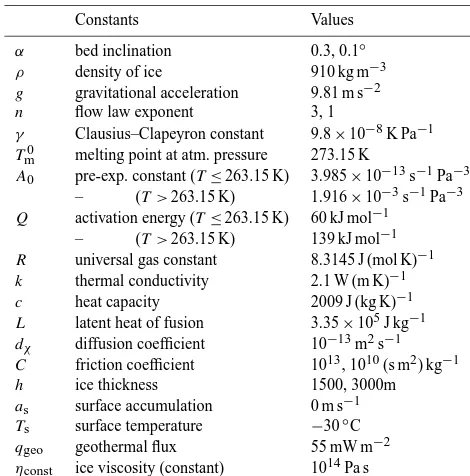
Figure 2 shows different model output in vertical cross sections, through the center of the lake, in the direction of flow for the LM lake size. Over the lake, the ice basically
moves as an ice shelf with more or less uniform horizontal velocity throughout the ice column (Fig. 2a). At the upstream end of the lake, a strong downward movement of ice causes cold ice from the upper layers to be drawn down towards the bottom, steepening the temperature gradient close to the base. Conversely, at the downstream end a strong upward flow restores internal layers to their prior depths (Fig. 2b).
The temperature and microscopic water content within the ice are shown in Fig. 2b. Black lines represent streamlines which coincide, or line up, with isochrone layers for steady-state simulations (Hindmarsh et al., 2006).
The intense internal deformation close to the borders of the lake, where ice velocities change significantly over short distances, gives rise to a thin temperate layer of ice both at
Figure 2. Along flow profiles, through the center of the lake (LM lake size,n=3). (a) shows horizontal velocity in m a−1. (b) shows the homologous temperature in◦C and water content in percent-age. The black lines represent streamlines. The inset figure shows a close-up of the temperate layers at the lake edges (same color scales). In (c) we see the logarithm of the internal deformation en-ergy W m−3while (d) shows the logarithm of the viscosity [Pa s].
the upstream and downstream ends of the lake (Fig. 2b). The vertical resolution is somewhat limited in the model but sim-ulations with higher resolution do indicate that a temperate layer should form for the given velocity field, although its thickness might be slightly overestimated. This is strongly af-fected by the chosen sliding law and sliding coefficients and should not be considered representative of subglacial lakes in general.
Figure 2c shows the internal deformation energy, with high values near the base where velocity gradients are high. Max-imum values are reached near the edges of the lake, in the transition zone between low and full sliding. Increases in temperature, pressure, and water content, and larger effective stress, all have the effect of decreasing the viscosity, which is why the lowest viscosity values are obtained at the base of the ice sheet, in particular around the edges of the lake (Fig. 2d). Generally low viscosity is furthermore obtained throughout the ice column over the lake boundary, extending all the way up to the surface, effectively creating a vertical zone of softer ice.
Figure 3a shows profiles of horizontal surface velocity for the three different lake sizes considered. As expected, veloc-ity peaks over the lake surfaces and two fringe peaks at the lake edges are discernible for the smallest lake size as well.
Figure 3. Surface velocity (a) and elevation (b) along flow (n=3), through the center of the lake for various lake sizes. Velocity and surface profiles for the different lake sizes (L, M, S) are marked with different colors and the horizontal extent of each lake is marked with a horizontal bar at the bottom. Note the different horizontal scale for the two figures.
Lake Vostok (Studinger et al., 2003) as well as a small hump at the downstream end. Figure 3b shows surface profiles for the three different lake sizes, each with the characteristic flat-tening of the surface as well as the dip and ridge features on each side of the lake.
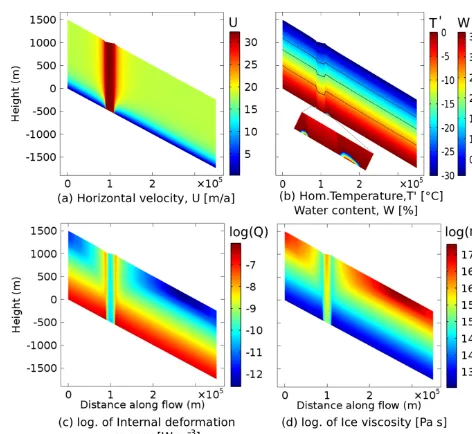
Figure 4a shows a comparison of surface profiles for the
LM lake size, made with a nonlinear viscosity (n=3 in
Glen’s flow law as used in our other experiments) versus a constant viscosity (ηconst=1014Pa s) and a pressure- and
temperature-dependent viscosity (n=1) but otherwise using the same setup. The hummocky feature is noticeably absent from simulations with a constant viscosity. Figure 4b and c show profiles of horizontal velocity and viscosity over the center of the lake for the three different viscosity cases. The horizontal velocity has been scaled with the horizontal veloc-ity at the surface (the uppermost point of the vertical profile). For both then=1 andn=3 cases, the horizontal velocity at depth is larger than at the surface.
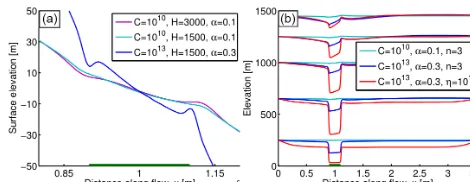
A weaker contrast in basal traction inside and outside the lake, or a less pronounced switch in flow mode such as one might expect beneath an ice stream (Leysinger Vieli et al., 2007; Parrenin and Hindmarsh, 2007), decreases the ampli-tude of the dip and ridge features as can be witnessed in Fig. 5a, where surface profiles for simulations with different sliding coefficients and ice thickness are compared (n=3). Isochrones relative to the ice base are shown in Fig. 5b for two of the simulations presented in Fig. 4 –n=3 (blue line) andη=1014(red line) – in addition to isochrones for a simu-lation with a lower contrast in basal traction and a lower bed inclination than the other two (cyan line). The structure of internal layers depends heavily both on the contrast in basal traction and the viscosity formulation used. Low contrast re-sults in small deflections of internal layers whereas a fixed viscosity (compared to flow with nonlinear viscosity and a similar surface velocity) results in larger deflections of in-ternal layers due to the generally smaller ice flux at depth outside the lake compared to over it.
Lakes drain and fill on different timescales. Several stud-ies have documented relatively rapid drainage events for
sub-Figure 4. (a) Profiles of surface elevation in meters for the LM lake size and three different viscosity cases; fixed viscosity (ηconst=1014Pa s, red), with flow exponent n=1 (green), and
n=3 (blue) in Glen’s flow law (Eq. 4). Vertical profiles of (b) the scaled horizontal velocity and (c) the logarithm of ice viscosity, over the center of the lake. The horizontal velocity has been scaled with the velocity magnitude at the surface.
Figure 5. (a) Profiles of relative surface elevation in meters for the LM lake size for different values of the sliding coefficient and ice thickness. The blue line is the same surface profile as the blue line in Fig. 4a only displaced vertically for comparison. Note the different vertical scale compared to the previous figure. (b) Isochrone layers for then=3 viscosity case with different values of the sliding co-efficient (cyan and blue lines) and for the fixed viscosity case (red line). The lake size isLM and the isochrones are presented relative to the base.
glacial lakes in Antarctica (Gray et al., 2005; Wingham et al., 2006; Bell et al., 2007). Typically, drainage occurs over the course of several years but refilling takes much longer. To simulate such an event and what effect it could have on the internal structure of the ice, we set up a model run where the lake diameter shrinks during a 10-year period from the max-imum (LL) to the smallest lake size used in the paper (LS).
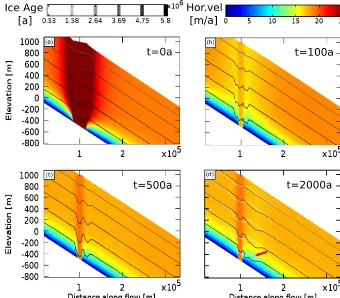
Figure 6 shows four different time slices of horizontal ity, with black lines indicating isochrone layers. As the veloc-ity field adjusts in time to the new BCs, a traveling wave is created at depth within the isochrone structure that transfers downstream with the flow of ice.
4 Discussion
Figure 6. Four different time slices of the velocity and isochrone adjustment to a drainage event. The color scale represents horizontal velocity m a−1and gray to black lines indicate isochrones. (a) represents the initial stage (t=0), (b) 100 years later (t=100 a), (c)t=500 a, and (d)t=2000 a. The white lines in the last time slice are the initial isochrone layers fromt=0 and the red arrow points to the isochrone disturbance that advects downstream with the flow of ice.
Outside the lake, the velocity field is affected primarily by changes in surface gradients and longitudinal stresses and, to a lesser degree, by changes in ice viscosity and basal veloci-ties. Over the lake, the ice moves more like an ice shelf, with almost uniform horizontal velocity throughout the ice col-umn. The increase in velocity (Fig. 2a) is due to the lack of basal friction over the lake, causing the highest velocities to appear there, but secondary velocity peaks (Fig. 3) can also be discerned at the lake edges, which result from the inter-action of surface evolution and ice dynamics. The velocity increase for the two fringe peaks propagates from the sur-face and downward whereas the velocity peak over the lake is mostly caused by acceleration in the basal layers of the ice sheet.
4.1 Thermal regime
For the given model setup, the geothermal flux is sufficient to ensure that the basal temperature reaches the pressure-melting point everywhere in the model. Internal deformation then adds to the available thermal energy with the potential to form a temperate layer with non-zero microscopic water con-tent in the vicinity of the lake as seen in Fig. 2b, where a thin
temperate layer has formed (∼70 m, 2 vertical cells). Lakes in ice-streaming areas, where a considerable portion of the surface velocity arises due to sliding at the base, can be ex-pected to have a much gentler transition in flow mode at the lake edges and much less deformational energy available. No temperate layer forms for simulations where the transition in sliding is considerably less sharp and more appropriate for streaming areas as in the cases withC=1010(Fig. 5).
As lake size increases so too do horizontal velocities over the lake (Fig. 3), as well as the effective strain rates and the available deformational energy for internal heating. Accre-tion rates at the ice/lake interface would be limited by the amount of latent thermal energy that the ice above it can lead away efficiently, and any temperate layer formed by inter-nal deformation at the lake boundary would, during its exis-tence, block heat flow and thus accretion, until it completely refreezes.
4.2 Transition zone
The softening effect of local increases in effective stress at the lake edges effectively creates a vertical layer of soft ice in between higher viscosity ice (Fig. 2c). Strong vertical flow at the edges of the lake results from the localized lack of basal traction. A clear difference can be seen between sim-ulations with constant viscosity and viscosity that depends on pressure and temperature (Fig. 4). The softening effect of increasing temperature and pressure with depth not only causes velocity changes in the vertical to be concentrated in the lower layers of an ice sheet but also means that for areas with varying basal traction, such as subglacial lakes, the ice at depth will support less lateral shear and lower longitudi-nal stresses compared to the upper layers where viscosity is higher and the ice stiffer. This in return means that as the ice encounters a slippery spot or a spot with a sharp decrease in basal traction, such as a subglacial lake, that the force balance will be different than in the isotropic case, where viscosity is constant. The imbalance in mass flux at depth must be com-pensated by a more localized increase in vertical flow and a subsequent drop in surface elevation at the upstream side and an upwelling at the downstream side of the lake due to the limited vertical extent of a typical ice sheet.
For large subglacial lakes, where the basal traction is 0, the horizontal velocity at depth is predicted to be slightly larger (here about 0.1 % for n=3, Fig. 4b) than at the surface. Lakes, such as Subglacial Lake Vostok, should therefore ex-perience extrusion flow at the base, where the basal horizon-tal velocity exceeds that at the surface. Extrusion flow is not, however, a requirement for the formation of these dip and ridge features. To form them it is sufficient to have a sharp transition in sliding along with a negative downward gradi-ent in ice viscosity. Our model further predicts that dips and ridges can form in situations where there is merely a strong decrease, not necessarily a complete disappearance, in basal traction.
4.3 Drainage experiment
Subglacial-lake drainage cycles (including both draining and filling) can have frequencies on decadal to centennial timescales or potentially even larger (Pattyn, 2008; Wing-ham et al., 2006). Although the drainage occurs over 10 years here, it can be seen as instantaneous given the generally slow
flow of ice. The velocity field adjusts rather rapidly (∼100 a) to the new basal BCs relative to the time it takes for the isochrones to respond, as the flow of ice is relatively slow. For episodic drainage cycles, the strength of the response will depend partly on how long it takes for the lake to refill. After roughly 2000 years, the wave has moved far enough down-stream to be more or less separated from its initial location (Fig. 6d). As both the upstream and downstream lake bound-aries move during the drainage event, a two-troughed wave is created. In draining lakes where one end is much deeper than the other a single wave would be expected, as only the shallower end is likely to move significantly. The velocity of the moving boundary also affects the amplitude of the re-sulting isochrone disturbance (Wolovick et al., 2014), where a slip boundary, moving with the ice, is capable of distort-ing isochrone layers to a much greater extent than stationary slip boundaries. For maximum effect, the boundary should be moving at a velocity comparable to the averaged ice col-umn velocity. Only slip boundaries moving with the ice are capable of distorting layers to a greater extent than stationary boundaries. Boundaries moving in opposite directions to ice flow, like our downstream lake boundary, will have a smaller impact on internal layers than a stationary boundary as the relative horizontal velocity increases.
For our particular setup, the isochrone disturbance, or the traveling wave, should eventually overturn and create a fold as the stress situation downstream of the lake is essen-tially one of simple shear without any longitudinal extension (Waddington et al., 2001; Jacobson and Waddington, 2005). Resolving this in the model would require an equally fine res-olution downstream of the lake, as over the lake itself, which is not done here. For a subglacial lake situated at the onset of streaming flow, a fold might not be expected though, as over-turning would be counteracted by longitudinal extension and vertical compression, which would tend to flatten all layer disturbances. In general, both horizontal shear and longitudi-nal extension can be assumed to be present and, thus, whether a layer disturbance develops into a fold or flattens out, even-tually to disappear, will be decided by the balance between the two (Waddington et al., 2001).
5 Conclusions
Subglacial lakes represent areas of the ice-sheet base which are incapable of exerting any horizontal stress on the over-lying ice. A rapid transition between little to full sliding at the lake edges causes intense deformation and internal heat-ing, leading both to an increase in enthalpy and strain soft-ening of ice. The decrease in viscosity with depth leads to preferential deformation of the lower layers of an ice sheet which, along with a sharp transition in sliding, results in a hummocky surface feature above the upstream and down-stream edges of subglacial lakes. These dip and ridge features can be taken as evidence for a rapid transition in basal slid-ing, with strong vertical movement of ice as a result. Lakes without this feature would be expected to experience a more gradual increase in sliding approaching the lake, a lower con-trast in basal traction or continued fast flow downstream, as with subglacial lakes at the onset of or in ice-streaming ar-eas. Over the lake itself, the ice moves more like an ice shelf, with zero basal traction and virtually no internal strain heat-ing. As a result, temperature gradients over the lake steepen, making them more prone to freeze-on at the ice/water inter-face. A rapid decrease in lake size (or basal friction) causes a traveling wave to be created at depth within isochrone layers, suggesting that certain aspects of lake history are preserved within them and could potentially be deciphered from radio echo sounding data downstream of lake locations when com-bined with output from numerical models.
Acknowledgements. Funding for this work came from the Research
Council of Norway (RCN), Statoil, Det Norske ASA and BG group, Norway (grant 200672), to the PetroMaks project “Glaciations in the Barents Sea area (GlaciBar)”, and from the Research School in Arctic Marine Geology and Geophysics (AMGG) at the University of Tromsø. This is also a contribution to the Centre of Excellence: Arctic Gas Hydrate, Environment and Climate (CAGE) funded
by RCN (grant 223259). In addition, we would like to thank Nina Wilkens and Martin Rückamp for help with getting started with COMSOL, the Stallo support team for invaluable assistance, and Gwendolyn Leysinger Vieli, as well as one anonymous reviewer and the editor Robert Bingham for constructive reviews and comments that greatly improved the quality of the manuscript.
Edited by: R. Bingham
References
Aschwanden, A., Bueler, E., Khroulev, C., and Blatter, H.: An en-thalpy formulation for glaciers and ice sheets, J. Glaciol., 58, 441–457, 2012.
Bell, R., Studinger, M., Shuman, C., Fahnestock, M., and Joughin, I.: Large subglacial lakes in East Antarctica at the onset of fast-flowing ice streams, Nature, 445, 904–907, 2007. Bentley, M., Christoffersen, P., Hodgson, D., Smith, A.,
Tu-laczyk, S., and Le Brocq, A.: Subglacial lake sediments and sedi-mentary processes: potential archives of ice sheet evolution, past environmental cange, and the presence of life, in: Antarctic Sub-glacial Aquatic Environments, American Geophysical Union, Washington, D.C., 83–110, doi:10.1029/GM192, 2013. Christoffersen, P., Tulaczyk, S., Wattrus, N., Peterson, J.,
Quintana-Krupinski, N., Clark, C., and Sjunneskog, C.: Large subglacial lake beneath the Laurentide Ice Sheet inferred from sedimentary sequences, Geology, 36, 563–566, 2008.
Dowdeswell, J. and Siegert, M.: The dimensions and topographic setting of Antarctic subglacial lakes and implications for large-scale water storage beneath continental ice sheets, Geol. Soc. Am. Bull., 111, 254–263, 1999.
Duval, P.: The role of the water content on the creep rate of poly-crystalline ice, in: Isotopes and Impurities in Snow and Ice, IAHS Publication, Wallingford, 118, 29–33, 1977.
Fricker, H., Scambos, T., Bindschadler, R., and Padman, L.: An ac-tive subglacial water system in West Antarctica mapped from space, Science, 315, 1544–1548, 2007.
Glen, J.: The creep of polycrystalline ice, P. Roy. Soc. Lond. A, 228, 519–538, 1955.
Gray, L., Joughin, I., Tulaczyk, S., Spikes, V., Bindschadler, R., and Jezek, K.: Evidence for subglacial water transport in the West Antarctic Ice Sheet through three-dimensional satel-lite radar interferometry, Geophys. Res. Lett., 32, L03501, doi:10.1029/2004GL021387, 2005.
Greve, R.: Application of a polythermal three-dimensional ice sheet model to the Greenland ice sheet: response to steady-state and transient climate scenarios, J. Climate, 10, 901–918, 1997. Greve, R. and Blatter, H.: Dynamics of Ice Sheets and Glaciers,
Springer Science & Business Media, Springer-Verlag, Berlin, Heidelberg, 49–72, 2009.
Hindmarsh, R.: The role of membrane-like stresses in determining the stability and sensitivity of the Antarctic ice sheets: back pres-sure and grounding line motion, Philos. T. Roy. Soc. Lond. A, 364, 1733–1767, 2006.
Hindmarsh, R., Leysinger Vieli, G., and Parrenin, F.: A large-scale numerical model for computing isochrone geometry, Ann. Glaciol., 50, 130–140, 2009.
Hutter, K.: A mathematical model of polythermal glaciers and ice sheets, Geophys. Astro. Fluid, 21, 201–224, 1982.
Jacobson, H. and Waddington, E.: Recumbent folding of divide arches in response to unsteady ice-divide migration, J. Glaciol., 51, 201–209, 2005.
Kamb, B. and Echelmeyer, K.: Stress-gradient coupling in glacier flow: I. Longitudinal averaging of the influence of ice thickness and surface slope, J. Glaciol., 32, 267–284, 1986.
Kleiner, T., Rückamp, M., Bondzio, J. H., and Humbert, A.: En-thalpy benchmark experiments for numerical ice sheet models, The Cryosphere, 9, 217–228, doi:10.5194/tc-9-217-2015, 2015. Langley, K., Kohler, J., Matsuoka, K., Sinisalo, A.,
Scam-bos, T., Neumann, T., Muto, A., Winther, J., and Al-bert, M.: Recovery Lakes, East Antarctica: radar assessment of sub-glacial water extent, Geophys. Res. Lett., 38, L05501, doi:10.1029/2010GL046094, 2011.
Langley, K., Tinto, K., Block, A., Bell, R., Kohler, J., and Scam-bos, T.: Onset of fast ice flow in Recovery Ice Stream, East Antarctica: a comparison of potential causes, J. Glaciol., 60, 1007–1014, 2014.
Leysinger Vieli, G., Hindmarsh, R., and Siegert, M.: Three-dimensional flow influences on radar layer stratigraphy, Ann. Glaciol., 46, 22–28, 2007.
Palmer, S., Dowdeswell, J., Christoffersen, P., Young, D., Blanken-ship, D., Greenbaum, J., Benham, T., Bamber, J., and Siegert, M.: Greenland subglacial lakes detected by radar, Geophys. Res. Lett., 40, 6154–6159, doi:10.1002/2013GL058383, 2013. Parrenin, F. and Hindmarsh, R.: Influence of a non-uniform velocity
field on isochrone geometry along a steady flowline of an ice sheet, J. Glaciol., 53, 612–622, 2007.
Parrenin, F., Hindmarsh, R., and Rémy, F.: Analytical solutions for the effect of topography, accumulation rate and lateral flow di-vergence on isochrone layer geometry, J. Glaciol., 52, 191–202, 2006.
Pattyn, F.: Investigating the stability of subglacial lakes with a full Stokes ice-sheet model, J. Glaciol., 54, 353–361, 2008. Pattyn, F., De Smedt, B., and Souchez, R.: Influence of subglacial
Vostok lake on the regional ice dynamics of the Antarctic ice sheet: a model study, J. Glaciol., 50, 583–589, 2004.
Sergienko, O., MacAyeal, D., and Bindschadler, R.: Causes of sudden, short-term changes in ice-stream surface elevation, Geophys. Res. Lett., 34, L22503, doi:10.1029/2007GL031775, 2007.
Siegert, M.: Antarctic subglacial lakes, Earth-Sci. Rev., 50, 29–50, 2000.
Siegert, M. and Kwok, R.: Ice-sheet radar layering and the develop-ment of preferred crystal orientation fabrics between Lake Vos-tok and Ridge B, central East Antarctica, Earth Planet. Sc. Lett., 179, 227–235, 2000.
Siegert, M., Dowdeswell, J., Gorman, M., and McIntyre, N.: An inventory of Antarctic sub-glacial lakes, Antarct. Sci., 8, 281– 286, 1996.
Siegert, M., Le Brocq, A., and Payne, A.: Hydrological connections between Antarctic subglacial lakes, the flow of water beneath the East Antarctic Ice Sheet and implications for sedimentary pro-cesses, in: Glacial Sedimentary Processes and Products, Black-well Publishing Ltd., Oxford, UK, 3–10, 2007.
Stearns, L., Smith, B., and Hamilton, G.: Increased flow speed on a large East Antarctic outlet glacier caused by subglacial floods, Nat. Geosci., 1, 827–831, 2008.
Steinemann, S.: Results of preliminary experiments on the plasticity of ice crystals, J. Glaciol., 2, 404–412, 1954.
Studinger, M., Bell, R. E., Karner, G. D., Tikku, A. A., Holt, J. W., Morse, D. L., Richter, T. G., Kempf, S. D., Peters, M. E., Blankenship, D. D., Sweeney, R. E., and Rystrom, V. L.: Ice cover, landscape setting, and geological framework of Lake Vos-tok, East Antarctica, Earth Planet. Sc. Lett., 205, 195–210, 2003. Thoma, M., Grosfeld, K., Mayer, C., and Pattyn, F.: Interac-tion between ice sheet dynamics and subglacial lake circula-tion: a coupled modelling approach, The Cryosphere, 4, 1–12, doi:10.5194/tc-4-1-2010, 2010.
Waddington, E., Bolzan, J., and Alley, R.: Potential for stratigraphic folding near ice-sheet centers, J. Glaciol., 47, 639–648, 2001. Weertman, J.: Sliding-no sliding zone effect and age determination
of ice cores, Quaternary Res., 6, 203–207, 1976.
Wingham, D., Siegert, M., Shepherd, A., and Muir, A.: Rapid dis-charge connects Antarctic subglacial lakes, Nature, 440, 1033– 1036, 2006.
Wolovick, M., Creyts, T., Buck, W., and Bell, R.: Traveling slip-pery patches produce thickness-scale folds in ice sheets, Geo-phys. Res. Lett., 41, 8895–8901, doi:10.1002/2014GL062248, 2014.