Available online on 15.06.2019 at http://jddtonline.info
Journal of Drug Delivery and Therapeutics
Open Access to Pharmaceutical and Medical Research© 2011-18, publisher and licensee JDDT, This is an Open Access article which permits unrestricted non-commercial use, provided the original work is properly cited
Open Access
Research Article
Formulation, Development and Evaluation of Floating Microsphere of
Losartan Potassium Using Natural Polymer
Bharti Patel*, R S Kushwaha,
Shailesh Jain
Patel College of Pharmacy, Ratibad, Bhabdhada Road Bhopal (MP) 462044, India
ABSTRACT
Floating drug delivery system is one of the novel drug delivery system. Floating drug delivery system have a bulk density less than gastric fluids and so remain buoyant in the stomach without affecting gastric emptying rate for a prolonged period of time. Various approaches have been used to retain the dosage form in stomach as a way of increasing the gastric residence time, including floatation systems, high-density systems, mucoadhesive systems, magnetic systems, unfoldable, extensible, or swellable systems and superporous hydrogel systems. The objective of this study was to prepare and evaluate floating microspheres of losartan potassium for the prolongation of gastric residence time. The microspheres were prepared by solvent diffusion–evaporation method using ethyl cellulose, hydroxypropylmethylcellulose and sodium alginate as natural polymers. Ethanol/dichloromethane blend was used as solvent in a ratio of 1:2. The floating microspheres were evaluated for flow properties, particle size, zeta potential, drug entrapment, as well as In-vitro release studies and stability studies. The shape and surface morphology of the microspheres were characterized by optical and scanning electron microscopy. The floating microspheres showed particle size, buoyancy, drug entrapment efficiency and yield in the ranges of 331.6 nm, 69±3 to 81±2%, and 60.25±0.25 to 75.65±0.74% and 69.98±0.56 to81.47±0.52%, respectively. Maximum drug release after 12 hr was 99.45 % for formulations F4. Scanning electron micrographs indicate pores both on the surface and interior of the microspheres. Accelerated stability study was also performed for three months indicated that optimized formulation was stable. The developed losartan microsphere system is a promising floating drug delivery system for oral sustained administration of losartan.
Keywords: Losartan Potassium, Floating microspheres, Drug entrapment, In-vitro drug release, Ethyl cellulose, Hydroxyl propyl methylcellulose
Article Info:Received 25 April 2019; Review Completed 27 May 2019; Accepted 31 May 2019; Available online 15 June 2019 Cite this article as:
Patel B, Kushwaha RS, Jain S, Formulation, Development and Evaluation of Floating Microsphere of Losartan Potassium
Using Natural Polymer, Journal of Drug Delivery and Therapeutics. 2019; 9(3-s):223-228
http://dx.doi.org/10.22270/jddt.v9i3-s.2829 *Address for Correspondence:
Miss Bharti Patel, Patel College of Pharmacy, Ratibad, Bhabdhada Road Bhopal (MP) 462044, India
INTRODUCTION
Several approaches have been developed to prolong the
residence time of dosage forms in the stomach1. Various
approaches have been used to retain the dosage form in the stomach as a way of increasing the gastric residence time (GRT), including floatation systems, high-density systems, mucoadhesive systems, magnetic systems, unfoldable, extendible, or swellable systems and superporous hydrogel
systems2. Floating drug delivery systems (FDDS) or
hydrodynamically balanced systems (HBS) are among the several approaches that have been developed to increase the GRT of dosage forms. Both single and multiple unit systems have been developed. The single- unit floating systems are more popular but have a disadvantage owing to their all-or-nothing emptying process, leading to high variability of the
gastrointestinal transit time3,4. In contrast, multiple-unit
particulate dosage forms (e.g., microspheres) have the advantages that they pass uniformly through the gastrointestinal tract (GIT) to avoid the vagaries of gastric emptying and provide an adjustable release, thereby reducing the inter subject variability in absorption and risk of local irritation. Recently, hollow microspheres with a
lower density than that of the GI fluids were adopted5. The
floating microspheres were prepared by the emulsion solvent diffusion– evaporation technique using different
polymer solution systems6, 7. Microspheres can be defined as
it undergoes hepatic first pass metabolism. Its half-life (t1/2) is 1.5-2 hrs and it should be administered 3-4 times to
maintain plasma drug concentration8, 9. So, it requires
control release of a drug. Hence an alternative drug delivery system is needed for increasing therapeutic efficacy, reducing the dosing frequency of drug and improving its
half-life and bioavailability10. Therefore, it is necessary to
develop a newer formulation which releases the drug in a sustained release manner. Thus losartan potassium would become promising candidate for floating microspheres in the management of hypertension. Thus, the present study reports a novel attempt to prepare microspheres of antihypertensive drug losartan potassium by using natural polymers by solvent diffusion-evaporation method.
MATERIALS AND METHODS
Materials
Losartan potassium were obtained as pure sample from Sun
Pharmaceutical Industries Ltd.Dewas, as gift samples along
with their analytical reports. Dichloromethane, ethanol and isopropyl alcohol were purchased from E. Merck (India) Ltd., Mumbai. Ethyl cellulose, hydroxyl propyl methyl cellulose and sodium alginate was purchased from Loba Chem. Pvt. Ltd, Mumbai All the other chemicals used were of analytical grade.
Procedure for the determination of λ max
Accurately weighed 10 mg of losartan potassium separately and dissolved in 10 ml of 0.1 N HCl in 10 ml of volumetric flask and prepared suitable dilution to make it to a concentration of 10 μg/ml make adequate of sample with concentration range of 5-25 μg/ml losartan potassium calculate the spectrum of this solution was run in 200-400 nm range in U.V spectrophotometer. (Labindia UV 3000+)
Preparation of floating microspheres
Floating microspheres loaded with losartan potassium were prepared using solvent diffusion-evaporation method using HPMC, EC and sodium alginate in different ratio like 1:0.5, 1:0.75, 1:1 w/w. Drug and polymer in different proportion were dissolved in 1:2 mixture of solvent system of ethanol and dichloromethane. This clear solution was poured slowly in a thin stream into the aqueous solution of 1% polyvinyl alcohol. The emulsion was continuously stirred for 3 h at a speed of 500 rpm at 27±2°C. The floating microspheres were
collected by decantation, while the non-floating
microspheres were discarded. The microspheres were dried
overnight at 40±2°C and stored in desicator11. The
compositions of the formulations were shown in Table 1.
Table 1 Formulations of the floating microspheres of losartan potassium F. Code Losartan potassium (mg) HPMC
(mg) (mg) EC
Sod. alginate
F1 20 100 50 -
F2 20 100 75 -
F3 20 100 100 -
F4 20 100 - 50
F5 20 100 - 75
F6 20 100 - 100
F7 20 100 25 25
F8 20 100 37.5 37.5
F9 20 100 50 50
Evaluation of microspheres
Percentage yield
The prepared microspheres with a size range of 1μm to 1000μm were collected and weighed from different formulations. The measured weight was divided by the total amount of all non-volatile components which were used for the preparation of the microspheres.
Drug entrapment
The various formulations of the floating microspheres were subjected for drug content. 10 mg of floating microspheres from all batches were accurately weighed and crushed. The powder of microspheres were dissolved in 10 ml 0.1 N HCl and centrifuge at 1000 rpm. This supernatant solution is than filtered through whatmann filter paper No. 44. After filtration, from this solution 0.1 ml was taken out and diluted up to 10 ml with 0.1 N HCl. The percentage drug entrapment was calculated using calibration curve method.
Floating behavior
Ten milligrams of the floating microspheres were placed in 0.1 N HCl (100 ml). The mixture was stirred at 100 rpm in a magnetic stirrer. After 10 h, the layer of buoyant microsphere was pipetted and separated by filtration. Particles in the sinking particulate layer were separated by filtration. Particles of both types were dried in desiccators until a constant weight was obtained. Both the fractions of microspheres were weighed and buoyancy was determined by the weight ratio of floating particles to the sum of floating and sinking particles.
Measurement of mean particle size
The mean size of the microspheres was determined by Photo Correlation Spectroscopy (PCS) on a submicron particle size analyzer (Horiba Instruments) at a scattering angle of 90°. A sample (0.5mg) of the microspheres suspended in 5 ml of distilled water was used for the measurement.
Determination of zeta potential
The zeta potential of the drug-loaded microspheres was measured on a zeta sizer (Horiba Instruments) by determining the electrophoretic mobility in a micro electrophoresis flow cell. All the samples were measured in water at 25°C in triplicate.
Shape and surface characterization of microspheres by scanning electron microscopy (SEM)
From the formulated batches of microspheres, formulations (F2) which showed an appropriate balance between the percentage releases were examined for surface morphology and shape using scanning electron microscope Jeol Japan 6000. Sample was fixed on carbon tape and fine gold sputtering was applied in a high vacuum evaporator. The acceleration voltage was set at 10KV during scanning. Microphotographs were taken on different magnification and higher magnification (200X) was used for surface morphology.
In-vitro release studies
microspheres equivalent to 100 mg drug were dispersed in 900 ml of 0.1 N HCI (pH=1.2) maintained at 37±0.5°C and stirred at 55rpm. One ml sample was withdrawn at predetermined intervals and filtered and equal volume of dissolution medium was replaced in the vessel after each withdrawal to maintain sink condition. The collected samples analyzed spectrophotometrically at 277 nm to determine the concentration of drug present in the
dissolution medium12.
Drug release kinetic data analysis
A number of kinetic models have been planned to explain the release characteristics of a drug from matrix. The next three equations are usually used, because of their simplicity and applicability. Equation 1, the zero-order model equation (Plotted as cumulative percentage of drug released vs time); Equation 2, Higuchi’s square-root equation (Plotted as cumulative percentage of drug released vs square root of time); and Equation 3, the Korsemeyer-Peppas equation (Plotted as Log cumulative percentage of drug released vs Log time). To study the release kinetics of stavudine from the mucoadhesive microspheres the release data was fitted to
these three equations 13-15.
Zero order equation
When a graph of the cumulative percentage of the drug released from the matrix against time is plotted, zero order release is linear in such a plot, indicating that the release rate is independent of concentration.
Qt = k0.t ……… (1)
Where Qt is the percentage of drug released at time t and k0 is
the releaserate constant;
First order equation
In (100-Qt) = In 100- kI.t ……….. (2)
Where kI is the release rate constant;
Higuchi’s equation
Qt = kH.t1/2 ……….. (3)
Where KH is the Higuchi release rate constant
Korsemeyer-Peppas
The curves plotted may have different slopes, and hence it becomes difficult to exactly pin-point which curve follows perfect zero order release kinetics. Therefore, to confirm the kinetics of drug release, data were also analyzed using Korsemeyer’s equation.
Qt/Q∞ = kKP.tn
Where Qt/ Q∞ is the fraction of drug released at time t, kKPa
constant compromising the structural and geometric characteristics of the device and n is the release exponent. The slope of the linear curve gives the ‘n’ value. Peppas stated that the above equation could adequately describe the release of solutes from slabs, spheres, cylinders and discs, regardless of the release mechanism. The value of ‘n’ gives an indication of the release mechanism. When n = 1, the release rate is independent of time (typical zero order release / case II transport); n = 0.5 for Fickian release (diffusion/ case I transport); and when 0.5 < n < 1, anomalous (non-Fickian or coupled diffusion/ relaxation) are implicated. Lastly, when n > 1.0 super case II transport is apparent. ‘n’ is the slope
value of log Mt/M∞ versus log time curve16.
Stability studies for optimized formulation
Accelerated testing, are the studies designed to amplify the rate of chemical degradation or physical change of a drug substance or drug product by exaggerated storage conditions as part of the formal stability studies. The optimized formulation F4 was taken and accelerated stability study was performed by taking suitable quantity of microspheres. The microspheres were placed in air-tight glass container at 40±2°C/75±5% RH. At suitable sampling interval the samples were withdrawn and evaluated for various parameters.
RESULTS AND DISCUSSION
Solubility of losartan was freely soluble in water, 0.1N HCl, methanol and ethanol, slightly soluble in 0.1N NaOH and chloroform. The melting point and partition coefficient of losartan was found to be 183.5 -184.5°C and 1.21±0.001
respectively. The λ max of losartan was found to be 277 nm by
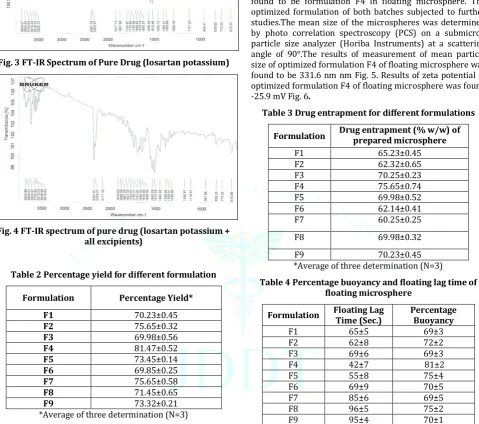
using U.V. spectrophotometer (Labindia-3000+) in linearity range 5-25 µg/ml Fig.1& 2. IR spectrum of any compound given information about the functional group present in particular compound. IR spectrum of losartan and with all excipients was taken using KBr pellet method. Various peaks in IR spectrum were interpreted for presence of different group in the structure of drug. The spectra of FTIR (Fig.3 to 4) indicate that the sample used was losartan and no interference with drug and excipients. The floating microspheres of losartan were prepared by solvent diffusion-evaporation method. Percentage yield of different formulation was determined by weighing the microspheres after drying. The percentage yield of different formulation was in range of 69.98±0.56 to 81.47±0.52 % Table 2.
Fig. 1 Determination of λmax of losartan potassium
Fig. 3 FT-IR Spectrum of Pure Drug (losartan potassium)
Fig. 4 FT-IR spectrum of pure drug (losartan potassium + all excipients)
Table 2 Percentage yield for different formulation
Formulation Percentage Yield*
F1 70.23±0.45
F2 75.65±0.32
F3 69.98±0.56
F4 81.47±0.52
F5 73.45±0.14
F6 69.85±0.25
F7 75.65±0.58
F8 71.45±0.65
F9 73.32±0.21
*Average of three determination (N=3)
The drug entrapment efficacies of different formulations were in range of 60.25±0.25 to 75.65±0.74 w/w Table 3. F4 microspheres entrapped maximum amount of the drug. To
assess the floating properties, the microspheres were placed in 0.1N hydrochloric acid. The microspheres floated for prolonged time over the surface of the dissolution medium without any apparent gelation. Buoyancy percentage of the microspheres was in the range of 69±3 to 81±2. The nature of the polymer influenced the floating behaviour of the microspheres Table 4. The maximum percentage yield, drug entrapment, percentage buoyancy and floating lag time was found to be formulation F4 in floating microsphere. The optimized formulation of both batches subjected to further studies.The mean size of the microspheres was determined by photo correlation spectroscopy (PCS) on a submicron particle size analyzer (Horiba Instruments) at a scattering angle of 90°.The results of measurement of mean particle size of optimized formulation F4 of floating microsphere was found to be 331.6 nm nm Fig. 5. Results of zeta potential of optimized formulation F4 of floating microsphere was found
-25.9 mV Fig. 6.
Table 3 Drug entrapment for different formulations
Formulation Drug entrapment (% w/w) of prepared microsphere
F1 65.23±0.45
F2 62.32±0.65
F3 70.25±0.23
F4 75.65±0.74
F5 69.98±0.52
F6 62.14±0.41
F7 60.25±0.25
F8 69.98±0.32
F9 70.23±0.45
*Average of three determination (N=3)
Table 4 Percentage buoyancy and floating lag time of floating microsphere
Formulation Floating Lag Time (Sec.) Percentage Buoyancy
F1 65±5 69±3
F2 62±8 72±2
F3 69±6 69±3
F4 42±7 81±2
F5 55±8 75±4
F6 69±9 70±5
F7 85±6 69±5
F8 96±5 75±2
Fig. 6 Zeta potential data of floating microsphere F4
The drug release from floating microspheres was found to be
99.45% at the end of 12 h for F4 Table 5. The In vitro drug
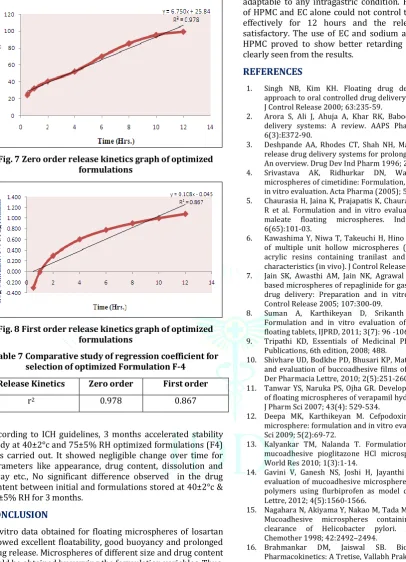
release data of the optimized formulation was subjected to goodness of fit test by linear regression analysis according to zero order and first order kinetic equation, in order to determine the mechanism of drug release. When the
regression coefficient values were compared, it was observed that an ‘r’ value of microsphere was maximum zero order i.e 0.978 hence indicating drug releases from
formulations was found to follow zero order for floating
microsphere Table 6 & 7 and Fig.7 & 8.
Table 5 Release study data of formulation F1-F9
Time % of Drug Release
(hr) F1 F2 F3 F4 F5 F6 F7 F8 F9
0.5 45.56 33.56 33.56 24.46 28.89 27.98 30.25 21.65 18.89
1 69.98 50.23 50.23 32.25 39.98 35.65 48.98 30.45 22.23
2 77.89 65.58 65.58 40.56 48.78 45.58 55.69 39.23 35.65
4 98.98 73.36 73.36 52.32 58.98 55.69 60.25 49.32 40.23
6 - 98.89 98.89 70.23 79.98 75.65 85.65 60.85 55.56
8 - - - 85.56 98.98 92.56 99.56 78.85 70.23
10 - - - 95.56 - 98.12 - 89.98 79.89
12 - - - 99.45 - - - 94.36 85.56
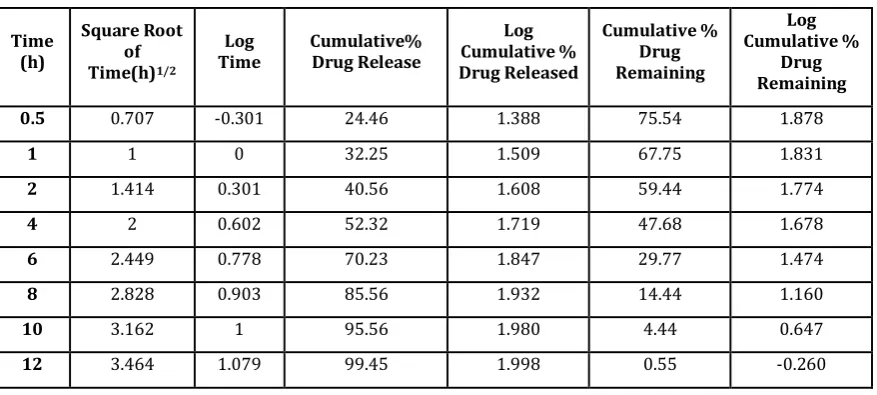
Table 6 Release kinetics of optimized formulation of microsphere F-4
Time (h)
Square Root of
Time(h)1/2
Log
Time Cumulative% Drug Release
Log Cumulative % Drug Released
Cumulative % Drug Remaining
Log Cumulative %
Drug Remaining
0.5 0.707 -0.301 24.46 1.388 75.54 1.878
1 1 0 32.25 1.509 67.75 1.831
2 1.414 0.301 40.56 1.608 59.44 1.774
4 2 0.602 52.32 1.719 47.68 1.678
6 2.449 0.778 70.23 1.847 29.77 1.474
8 2.828 0.903 85.56 1.932 14.44 1.160
10 3.162 1 95.56 1.980 4.44 0.647
Fig. 7 Zero order release kinetics graph of optimized formulations
Fig. 8 First order release kinetics graph of optimized formulations
Table 7 Comparative study of regression coefficient for selection of optimized Formulation F-4
Release Kinetics Zero order First order
r2 0.978 0.867
According to ICH guidelines, 3 months accelerated stability study at 40±2°c and 75±5% RH optimized formulations (F4) was carried out. It showed negligible change over time for parameters like appearance, drug content, dissolution and assay etc., No significant difference observed in the drug content between initial and formulations stored at 40±2°c & 75±5% RH for 3 months.
CONCLUSION
In vitro data obtained for floating microspheres of losartan showed excellent floatability, good buoyancy and prolonged drug release. Microspheres of different size and drug content could be obtained by varying the formulation variables. Thus, the prepared floating microspheres may prove to be potential candidates for multiple-unit delivery devices
adaptable to any intragastric condition. Hydrophilic matrix of HPMC and EC alone could not control the release of drug effectively for 12 hours and the release pattern was satisfactory. The use of EC and sodium alginate along with HPMC proved to show better retarding ability which was clearly seen from the results.
REFERENCES
1. Singh NB, Kim KH. Floating drug delivery systems: An approach to oral controlled drug delivery via gastro retention. J Control Release 2000; 63:235-59.
2. Arora S, Ali J, Ahuja A, Khar RK, Baboota S. Floating drug delivery systems: A review. AAPS Pharm Sci Tech 2005; 6(3):E372-90.
3. Deshpande AA, Rhodes CT, Shah NH, Malick AW. Controlled release drug delivery systems for prolonged gastric residence: An overview. Drug Dev Ind Pharm 1996; 22:531-39.
4. Srivastava AK, Ridhurkar DN, Wadhwa S. Floating microspheres of cimetidine: Formulation, characterization and in vitro evaluation. Acta Pharma (2005); 55:277-85.
5. Chaurasia H, Jaina K, Prajapatis K, Chaurasia D, Gupta R, Arya R et al. Formulation and in vitro evaluation of rosiglitazone maleate floating microspheres. Indian Pharm 2007; 6(65):101-03.
6. Kawashima Y, Niwa T, Takeuchi H, Hino T, Ito Y. Preparation of multiple unit hollow microspheres (microballoons) with acrylic resins containing tranilast and their drug release characteristics (in vivo). J Control Release 1991; 16:279-90. 7. Jain SK, Awasthi AM, Jain NK, Agrawal GP. Calcium silicate
based microspheres of repaglinide for gastroretentive floating drug delivery: Preparation and in vitro characterization. J Control Release 2005; 107:300-09.
8. Suman A, Karthikeyan D, Srikanth V, Wormakar V. Formulation and in vitro evaluation of losartan potassium floating tablets, IJPRD, 2011; 3(7): 96 -106
9. Tripathi KD, Essentials of Medicinal Pharmacology, Jaypee Publications, 6th edition, 2008; 488.
10. Shivhare UD, Bodkhe PD, Bhusari KP, Mathur VB, Formulation and evaluation of buccoadhesive films of losartan potassium, Der Pharmacia Lettre, 2010; 2(5):251-260
11. Tanwar YS, Naruka PS, Ojha GR. Development and evaluation of floating microspheres of verapamil hydrochloride. Brazilian J Pharm Sci 2007; 43(4): 529-534.
12. Deepa MK, Karthikeyan M. Cefpodoxime proxetil floating microsphere: formulation and in vitro evaluation. Iran J Pharm Sci 2009; 5(2):69-72.
13. Kalyankar TM, Nalanda T. Formulation and evaluation of mucoadhesive pioglitazone HCl microspheres. Int J Pharm World Res 2010; 1(3):1-14.
14. Gavini V, Ganesh NS, Joshi H, Jayanthi C. Formulation and evaluation of mucoadhesive microspheres of macromolecular polymers using flurbiprofen as model drug. Der Pharmacia Lettre, 2012; 4(5):1560-1566.
15. Nagahara N, Akiyama Y, Nakao M, Tada M, Kitano M, Ogawa Y. Mucoadhesive microspheres containing amoxicillin for clearance of Helicobacter pylori. Antimicrob Agents Chemother 1998; 42:2492–2494.
16. Brahmankar DM, Jaiswal SB. Biopharmaceutis and Pharmacokinetics: A Tretise, Vallabh Prakashan, New Delhi, 1st