World Maritime University World Maritime University
The Maritime Commons: Digital Repository of the World Maritime
The Maritime Commons: Digital Repository of the World Maritime
University
University
World Maritime University Dissertations Dissertations
11-5-2017
A business case for change management, using "change
A business case for change management, using "change
management return on investment" on the implementation of the
management return on investment" on the implementation of the
ISO-IMS project: a case of Tema port
ISO-IMS project: a case of Tema port
Joshua Owusu-Ansah
Follow this and additional works at: https://commons.wmu.se/all_dissertations
Part of the Business Intelligence Commons, and the Transportation Commons
Recommended Citation Recommended Citation
Owusu-Ansah, Joshua, "A business case for change management, using "change management return on investment" on the implementation of the ISO-IMS project: a case of Tema port" (2017). World Maritime University Dissertations. 547.
https://commons.wmu.se/all_dissertations/547
WORLD MARITIME UNIVERSITY
Malmö, Sweden
A BUSINESS CASE FOR CHANGE MANAGEMENT,
USING “CHANGE MANAGEMENT-RETURN ON
INVESTMENT”: A CASE STUDY OF THE
IMPLEMENTATION OF ISO INTEGRATED
MANAGEMENT SYSTEM AT THE TEMA PORT
By
JOSHUA OWUSU-ANSAH
Ghana
A dissertation submitted to the World Maritime University in partial fulfilment of the requirements for the award of the degree of
MASTER OF SCIENCE
In
MARITIME AFFAIRS
(PORT MANAGEMENT)
2017
Acknowledgement
I would first like to thank God for His unlimited care and shepherding throughout this
academic pursuit.
I thank my thesis advisor Prof. Michael Ekow Manuel, Head of Maritime Education and
Training (MET) and Nippon Foundation Chair at World Maritime University (WMU). The door to Prof. Manuel’s office was always opened whenever I needed to discuss
anything pertaining to this research or had a question about my research or writing. He
consistently allowed this paper to be my own work, but steered me in the right direction
whenever he thought I needed it.
I would also like to thank the staff of Ghana Ports and Harbours Authority, Tema, and the
members of the project team at the office of the General Manager of the Business
Development Department who were involved in the survey for this research project.
Without their passionate participation and input, the survey could not have been
successfully conducted.
I would also like to acknowledge my wife as my second reader of this thesis, and I am
gratefully indebted to her for her very valuable comments on this thesis.
Finally, I must express my very profound gratitude to my parents and to my wife for
providing me with unfailing support and continuous encouragement throughout my study
and through the process of researching and writing this thesis. This accomplishment
would not have been possible without them. Thank you.
Abstract
Title of Dissertation: A Business Case for Change Management, Using “Change Management-Return On Investment”: A Case Study of the
Implementation of ISO Integrated Management System at The Tema Port
Degree : MSc
This dissertation is a study that explores a way of making a business case for change
management, using project evaluation concepts of ROI and VOI. It examined a test case
within the Ghana Ports and Harbours setting, and applied the Change management return
on investment (CMROI) on a test project.
It is a well-known fact that organizations seek to develop by embarking on different
projects, in order to give clients quality services. However, every project has specific
value it intends to add up to the overall growth of the organization. In most cases, there
exist in projects a variance between expected project benefits and actual realized project
benefits (value). It is arguable that organizations, in order to ascertain project
effectiveness for value, evaluate projects using rigorous financial tools like IRR, ROI and
NPV. Their aim is to know how much of tangible benefits is the project bringing on board.
Another evaluation is to have a holistic view of the overall value the project brings instead
of the tangible aspects alone. This is the VOI concept, which many have argued that it is
the new ROI, thus a call to shift to this new method. A particular reference is made in this
dissertation to the originators of this latter evaluation method.
The concept in this dissertation was to apply the thought that individuals adopting and
using a project (change) affects the overall value realized from a project. This is the
human factor which this paper justified as the contributing factor that brings the variance
between expected and realized value. This factor is an intangible that was quantified to
help determine the CMROI (additional value added due to people adopting and using
management to drive it (adoption and usage) in order to make up for the variance created
by its absence.
Data was collected and processed for this test project (i.e. ISO-IMS project) employing
the PROSCI framework which lays out the processes for quantifying the adoption and
usage as well as the CMROI including the overall project benefits captured.
The concluding chapters examines the results and analyses them to make the case for
change management more data driven and analytical. A number of recommendations are
made concerning the need for further investigation in this subject.
KEY WORDS: Change management, ROI, VOI, Variance, Adoption and Usage,
CMROI
Table of contents
Declaration ... ii
Acknowledgement ... iii
Abstract ... iv
Table of contents ... vi
List of tables ... ix
List of Figures ... ix
List of Abbreviations ... xi
Chapter 1 ... 1
1.0 Introduction ... 1
1.1 Background ... 1
1.2 Problem Statement ... 3
1.3 Conceptual Framework for the Study ... 4
1.4 Purpose of the Study ... 5
1.5 Research Questions ... 5
1.6 Research Methodology ... 6
1.7 Significance of the Study ... 6
1.8 Limitations of the Study... 7
1.9 Format of the Study ... 7
Chapter 2 ... 9
2.0 Literature review ... 9
2.1 Introduction ... 9
2.2 Overall trends ... 9
2.3 Project evaluation models reviewed ... 11
2.3.1 Return On Investment (ROI) ... 11
2.3.2 Value On Investment (VOI)... 13
2.3.3 Quantifying intangible benefits of project ... 16
2.3.4 Relationship between ROI and VOI ... 18
2.3.5 People side of Change Management ... 19
2.3.6 ROI of Change Management (CMROI) ... 20
2.4 Conclusion ... 21
2.4.1 Summary of major contributions of significant studies ... 21
Chapter 3 ... 23
3.0 Research Methodology ... 23
3.1 Introduction ... 23
3.2 Research process ... 23
3.3 Hypotheses of the study ... 24
3.4.1 Quantitative research technique ... 27
3.4.2 Qualitative research technique ... 27
3.5 Research setting ... 27
3.5.1 Population ... 28
3.5.2 Sampling ... 28
3.6 Data collection ... 29
3.6.1 Data collection instruments... 30
3.7 Validity and reliability of the research instrument ... 31
3.8 Procedure ... 31
3.9 Data processing and analysis ... 35
3.10 Ethical considerations ... 36
3.10.1 Consent ... 36
3.10.2 Confidentiality and anonymity ... 36
3.11 Research limitations ... 37
Chapter 4 ... 38
4.0 Results and Data Analysis ... 38
4.1 Introduction ... 38
4.2 Methods of data analysis and presentation of data ... 38
4.3 Descriptive analysis ... 38
4.3.1 Demographics ... 38
4.4 Presentation of results and findings ... 41
4.4.1 Research Questions ... 42
4.5 Scenario Analysis... 57
4.5.1 With no change management ... 58
4.5.2 With minimal change management ... 58
4.5.3 With solid change management ... 59
4.6 Summary of results and analysis... 59
Chapter 5 ... 61
5.0 Conclusion and recommendations ... 61
5.1 Purpose of the study ... 61
5.2 Summary of study ... 61
5.3 Summary of findings/results ... 62
5.3.1 Employee adoption and usage contribution of the ISO-IMS project ... 62
5.3.2 CMROI ... 63
5.3.3 Factors affecting adoption and usage of the ISO-IMS... 65
5.4 Recommendations for future research ... 66
5.4.1 Adding of a financial aspect to the study ... 66
5.4.2 Considering longitudinal approach to the research ... 66
5.4.3 Conducting a complete sensitivity analysis to determine the most affected departments. ... 66
5.5 Recommendations for future practice ... 67
5.5.1 Preparing a complete benchmarking framework for GPHA... 67
Appendix I ... 74
List of tables
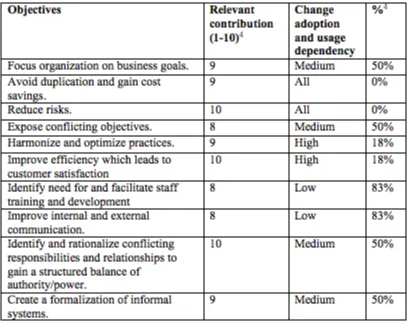
Table 1: Project objectives with their respective change adoption contribution
dependencies 42
Table 2: Percentage range of change adoption and usage contribution, PROSCI, 2016 43 Table 3: Factors affecting adoption and usage 47
List of Figures
Figure 1: VOI as the new ROI 18
Figure 2: A graph of people change against expected ROI, 20
Figure 3: Process flow adopted, 24
Figure 4: Departmental distribution 39
Figure 5: Respondents designation 40
Figure 6: Number of years of experience of respondent 41
Figure 7: Percentage contributions 43
Figure 8: A graph of adoption contribution against project benefits, 44 Figure 9: Adoption and usage percentage with project benefits captured, 45 Figure 10: Screen shot of scenario of comprehensive change management, 46 Figure 11: A graph showing responses concerning how often projects are undertaken in
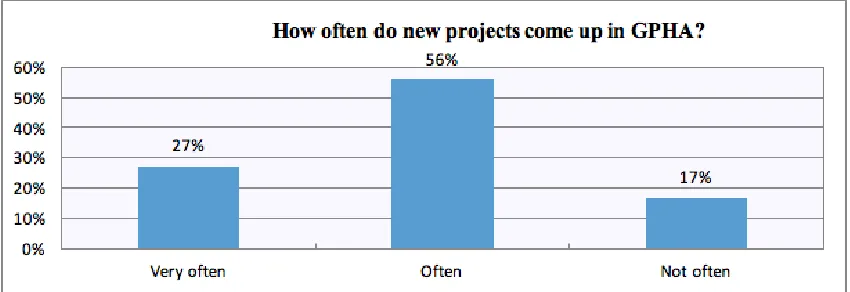
GPHA 48
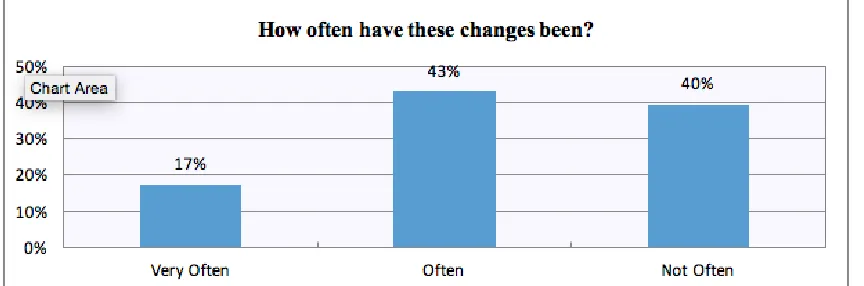
Figure 12: A graph showing responds concerning history of projects in GPHA 48 Figure 13: A graph showing responds concerning structures in terms of personnel
availability for change in GPHA 48
Figure 14: A graph showing responds concerning structure in terms of personnel
effectiveness for change in GPHA 49
Figure 15: A graph showing responds concerning infrastructure for change in GPHA 49 Figure 16: A graph showing responds concerning the perception of change in GPHA 49 Figure 17: A graph showing the number of times changes happened in the last 3 years 50 Figure 18: A graph showing the frequency of these changes within the 3years 50 Figure 19: A graph showing change awareness in GPHA 51 Figure 20: A graph showing response to reasoning for ISO-IMS project 52 Figure 21: A graph showing response to if the ISO-IMS replaces an existing system in
GPHA 52
Figure 22: A graph showing response to departure of change brought by the ISO-IMS 53 Figure 23: A graph showing response to whether there is resistance to change in GPHA
53
Figure 24: A graph showing respondents department being affected by ISO-IMS 54 Figure 25: A graph showing the quantum of effect 55 Figure 26: A screen shot showing the filtering of question in graph 18 above by
departments 55
Figure 27: A screen shot showing the filtering of question in graph 18 above by
Figure 28: A screen shot showing the filtering of question in graph 19 above by
department, 56
Figure 29: Percentage distribution of response in figure 7 by departments, 57 Figure 30: Screen shot of scenario with "no change management", PROSCI, 2016 58 Figure 31: Screen shot of scenario with minimal change management, from PROSCI,
2016 58
Figure 32: Screen shot of scenario with solid change management, PROSCI, 2016 59 Figure 33: Blown-up diagram showing the amount driven by CM. 64 Figure 34: Screen Shot from CMROI calculator 76 Figure 35: Analysis screen shot of CMROI calculator 76 Figure 36: Data capture with qualitative and quantitative mapping percentages of the
List of Abbreviations
ADKAR Awareness, Desire, Knowledge, Ability and Reinforcement
A&U Adoption and Usage
CMROI Change Management Return On Investment
GPHA Ghana Ports and Harbours Authority
ISO-IMS International Organization for Standardization – Integrated
Management System
ISO-QMS International Organization for Standardization – Quality
Management System
OECD Organization for Economic Co-operation and Development
ROI Return On Investment
UNCTAD United Nations Conference on Trade and Development
Chapter 1
1.0 Introduction
Many organizations exist to make profit, and in doing so there are several considerations
which come to play. One of such is to increase clientele through delivering higher quality
services. In order to do this, they undertake development projects that bring in this change.
However, in their quest to achieve this, it is normally the case that, expected outcomes do
not match actual outcomes, due to variations within the organization itself. This causes
the development of the organization to stall, and intended results are not fully realized.
This research, using the case study of a port, aims at studying one such cause of these
variations and the effect that it has on the overall benefits of a project to an organization.
Specifically, the research examines the people-side factor and the quantum of this
variation in order to make a case for top level managers buy-in for change management
in a port.
1.1 Background
Traditionally, ports have been seen as gateways between foreign and domestic markets
(UNCTAD, 2015, p. 72). However, changes in the maritime industry regarding logistics
integration and network orientation have redefined the traditional role of ports in the value
chain (Rodrigue & Notteboom, 2005, p. 297). Furthermore, the role of ports has taken
different forms within the supply chain. The development patterns of ports have also
changed. Today, ports are seen as integral components of distribution systems and for this
include general logistics services and value-added activities (Pettit & Beresford, 2009, p.
253). Due to these changes, there are new developments in ports.
Port development is seen as a catalyst that stimulates economic activity and also creates
employment. In the UK for example, it was estimated that 262,700 jobs were created as
a result of the provision of maritime services according to Oxford Economics, (as cited
in UNCTAD, 2013, p. 94). However, historically, the development of ports has been
related to major developments happening in the shipping industry. Such global
developments include the creation of the second Suez Canal and expansion of the Panama
Canal, which have had impacts on ports within the region and are likely to lead to an
increase in the number of ships calling at these ports (UNCTAD, 2015, p. 66). Arguably,
every port has development plans which take into account global trends in the industry as
well as the creation of wealth for the citizens of the country and the meeting of customer
needs. This is a trend in port development across the world. According to the UNCTAD
Review on Maritime transport (2013), several countries along the west coast of Africa are
involved in a variety of port development projects. They include, but are not limited to,
superstructure development, terminal building, quay extensions, dredging, and “dry port
development projects in landlocked countries like Niger” (World Bank Group, 2015, p.
1). Kruk and Julian (2007) have indicated that in developing countries, ports constitute a
key asset for economic development. In view of this, such ports need to operate efficiently
and be properly structured in order to support an increase in trade and in Gross Domestic
Product (GDP) by linking countries (both coastal and landlocked), productive hinterlands
and consumers to global markets.
In line with the preceding position, the Republic of Ghana (and for that matter the Ghana
Ports and Harbours Authority (GPHA)) has been engaged in such developments in ports.
In 2012, agreements were signed for work to begin infrastructure reconstruction in the
Takoradi Port. This work included reclamation (UNCTAD, 2013, p. 95). In 2016, a major
port expansion project was initiated by the Government of Ghana with the GPHA to increase the port’s container handling capacity of about 1 million TEUs at the time, to 3.5
million TEUs. This major development has given rise to the implementation of other
sub-projects that have the aim of supporting and upholding this major port expansion project.
Organization for Standardization (ISO) Integrated Management System project and so on
(Ghana Ports and Harbours Authority, 2016).
To be successful and as part of good port management, all of the aforementioned projects
need to be managed effectively and efficiently. In managing them, the port must consider
its stakeholders who have invested in these projects as well as the value addition it brings
to the entire port. Several teams are formed at different levels of management to help
foster the deployment of these projects successfully, in recognition of the fact that in order
to be the trade and logistics hub for the region (a vision of the port authority), GPHA like
any port must remain competitive within the region. Hence it plans, deploys and manages
these projects with the view of leveraging on new technology, procedures and ways of
working that come with such development projects, to provide quality service to its
customers, while maintaining a sustainable, clean and safe working environment for its
employees as well as the port community.
1.2 Problem Statement
While evidence of deployment of these projects exists in GPHA, there is difficulty in
realizing the full possible benefits in terms of value of these projects because of process
challenges and individual and organizational lapses. Money is being invested in these
projects, hence the bottom line is that it must add value to the port as a whole for the
money invested. This is a basic expectation of every stakeholder. Yet this appears not to
be the case in many projects; rather, it is much more likely that the value generated by
projects rarely equals what was estimated. Hence there is variance between the expected
value of projects and the actual value gained.
This variance exists despite the fact that each project has an aim and associated goals that
it intends to achieve in order to add value to the organization. Such projects come with
new processes, which challenge the old way of carrying out certain jobs in an organization
and require change. Achieving the aims does not only depend on the existence of perfectly
designed processes or procedures. A second important element is critical, which is the
have perfectly designed processes, technology and/or systems, if no one follows these
procedures, apply these technologies or employ these systems optimally in the work
context, there will be no additional value created for the organization and no sustained
results, with the end result being less value returned for the money invested.
Accordingly, and irrespective of the organization, it is obvious that the bridge between a
quality solution and benefit realization is the individuals embracing and adopting the
required change (Creasy, 2012, p.1).
Therefore, one of the greatest contributions to this variance in project value realization as
compared to the intended outcome, is the people side of change that is brought in by the
said project, which also is a bridge linking the so-called perfect solution to the actual
value realization of the project. The magnitude of this variance is dependent on how much
of the projects results depend on how people do their jobs differently. Thus, the greater
the dependence of the project outcome on people doing their jobs differently, the greater
the variance in the value obtained from the value desired.
1.3 Conceptual Framework for the Study
There are two concepts generally put forward by existing literatures to find out the
effectiveness of a project – the Return On Investment (ROI) concept and the Value On
Investment (VOI) concept (Norris, 2003; Permuth and Andrande, 2014; Harris, Grey and
Rozwell, 2001). In comparing these two concepts, Norris (2003, p. 3) suggests that “ROI
is based on return, which is generated by tangible outcomes, such as conventional
enhancements of productivity, cost reduction, enhanced revenues, and opening new markets”. On the other hand, he notes that “VOI measures the value of the intangible side
of a project in addition to the tangible benefits ROI measures”. Gartner say VOI is the
total measure of benefits derived from soft initiatives and that ROI is a component of VOI
(Harris et. al., 2001, p. 2). These definitions suggest that there is a relationship between
ROI as the objective quantitative aspects of project benefits and VOI as the qualitative
aspects of the benefits of the same project.
It is recommended that organizations, to determine the impact of projects must evolve to
However, this evolution requires senior management buy-in to show that less-tangible
assets are just as valuable as sales and productivity valuations (Permuth & Andrade, 2014,
p. 5).
The question does remain as to how one can gain management buy-in in this respect. In
order to gain top management, buy-in, this research seeks to examine one such project
with a view to examining the basis on which a case can be made and to determine how
much of the project’s benefits depend on employee “Adoption and Usage” (A&U). This
thus helps to find the ROI of Change Management (CMROI) of the project, which is defined as “the additional value created by a project due to employee adoption and usage”
(PROSCI, 2016).
Hence, the approach taken in this study is to use PROCSI’s process framework and the
CMROI calculator to find and quantify employee A&U of the test project for GPHA, and
thus to determine how this quantity impacts on the project management.
1.4 Purpose of the Study
This research therefore tries to make a case for change management in a different way by
making it more data driven, more rigorous and also more analytical. In this regard, it seeks
to create a different emphasis of how the benefits of change management are measured -
from the more technical to a more human side of the equation. New ideas are introduced
to help the easy to transition from ROI into VOI.
1.5 Research Questions
The following questions are raised to give direction to the research.
1. What will be the percentage of the benefits gained if no one changed the way they
work?
2. How can we connect the people side of change to the ultimate results, value, outcome
and benefits of change?
3. How can a quantification of “people-side benefits” be included/considered in CMROI
4. Which factors impact the Adoption and Usage (A&U) portion of the project?
5. Which part of the organization will be affected most by this project?
1.6 Research Methodology
The intention of this study was that of an exploratory and descriptive research. Chapter 3 gives details of the study’s research methods and activities. This study uses sequential
mixed methods research approach combining both qualitative and quantitative
methodologies, to find out what the ISO-IMS project is trying to achieve in its entirety,
explore the factors that affect the adoption and usage of the ISO- IMS system in the port
and also to determine the most affected department by the project. In discussing mixed
method approach, Manuel (2011, p. 75) indicates that mixed methods research aims at
what counts, and this include the tangibles and intangibles. Also the use of a mixed
methods research helps to complement one method with another in order to do justice to
the complex nature a research presents.
The study therefore used primarily quantitative data collection strategy and applied
qualitative strategy where appropriate. The data collected were mainly primary data. It
applied questionnaires as the data collection instrument with both open-ended questions
as well as closed-ended questions.
1.7 Significance of the Study
This research will create a platform for a closer look at the implementation process of the
ISO-IMS project. It will also open up opportunities to create a benchmark for future
projects that are to be implemented at the Port of Tema.
Arguably, it can be expected that what every organization is looking for in a project is the
overall tangible benefits which can be captured as ROI. However, there are some who
also argue and emphasize the intangible aspects of project benefits (Harris et. al., 2001;
Permuth & Andrade, 2014; Norris, 2003) giving rise to VOI, and concluding that VOI
approaches, it is obvious that there is a gap which this research fills through the use of the
CMROI, to provide the bridge that connects these two approaches through change
management. In other words, this study makes an academic contribution to the theory by
trying to conclude that one needs to use the CMROI as means to shift the discourse from
ROI exclusively to VOI.
1.8 Limitations of the Study
One key assumption was that there would be total cooperation from the Project Manager
and his team of implementers. It was also assumed that the side of the project not
dependent on A&U is delivered properly and has no technical issues. In other words, the
tangible side of the project benefits is without any known issues (extraneous variables)
that can affect the determined percentage of benefits arising from A&U. This of course
may not be the real case, since errors are bound to happen. In this case, the employment
of an external body to develop this system was not without problems especially as they
are also prone to errors in design application. This was seen as a potential limitation to
this research. It can increase the actual figure of the CMROI and hence make it an
exaggeration. To reduce the effect of this limitation, the project team for the ISO-IMS
was consulted throughout the study.
1.9 Format of the Study
This dissertation is laid out as follows.
Chapter 1: This is the introduction, giving a background to the whole research work and
also the motivation to embark on this research work.
Chapter 2: After the introduction is this chapter, which deals with the literature review
regarding the scope of ROI, VOI and Change Management in itself. It discusses the
academic work done in this area to give the big picture and show how this new idea of
Chapter 3: This section follows with the methods employed to undertake this research.
Since this research in change management is more data driven and analytical, a
framework from PROCSI which is built on the concept of CMROI was employed. In this
chapter, the data collection methods are discussed and the research instruments presented.
Chapter 4: This chapter discusses the results of the research and the procedures adopted
in analysing the various research questions, and presents them first in a descriptive way
and then based on specific scenarios.
Chapter 5: In this chapter, the research concluded with a view to gaining management
buy-in by showing the implications of the calculated CMROI on the project. It also
discusses some recommendations pertaining to aspects of this research which were not
Chapter 2
2.0 Literature review
2.1 Introduction
In order to measure the outcome of a project, there are four major components to be
considered, which according to Baratta (2009) are, realized value, project cost, decision
opportunity cost and identification opportunity cost. The main project outcome measure
of concern in this paper is the realized value of a project - the actual benefit experienced
after implementation of a project. In his view, this is one of the most important measures,
because it tells us how the project is doing overall across the organization. For many
organizations, realized value is delivered over time across organizational boundaries and
often not tracked for any meaningful period of time, giving rise to a situation where the
estimated/expected value of a project may vary greatly from its realized value after
implementation.
Accordingly, the focus for this research is tied to two main areas of project benefit
evaluation which are evaluation from the perspective of Return On Investment (ROI) and
Value On Investment (VOI).
2.2 Overall trends
Traditionally, project benefits have been evaluated using financial tools such as Return
on Investment (ROI), Net Present Value (NPV), Internal Rate of Return (IRR) etc.
Saleem, Salim & Fayoumi (2015), indicate that ROI “is the common method used to
assess the benefits generated from any type of investment using financial factors”. They
elaborate that ROI is the driver for most decisions made in organizations concerning
investments, and it is so in concept in most organizations. Phillips (2007) adds that ROI
Corporation Inc. (2002) also stresses the need to have ROI at the center of Information
Technology which is also a non-traditional area for ROI. For Botchkarev and Andru
(2011), ROI is a financial term that has been used for decades and defined as a concept
based on a rigorous and quantifiable analysis of financial returns and costs. Currently,
ROI is widely recognized and accepted in business and financial management in both the
private and public sectors. This wide proliferation of the ROI method, has led to a
situation where ROI is often experienced, as Botchkarev and Andru (2011) put it, as a “non-rigorous, amorphous bundle of mixed approaches, prone to the risks of inaccuracy and biased judgment”.
Value On Investment (VOI) on the other hand was a concept introduced in 2001 by the
Gartner Group, a research institution (Harris et. al., 2001). It focuses on the overall value
realized during and after project implementation. With this concept, there is arguably a
welcoming thought of going beyond ROI to consider the overall value generated not only
via the physical tangible side but more so the intangible aspects. It is “the most
comprehensive tool for assessing the value of a reward and recognition program”
according to Permuth and Andrade (2014). Mott and Granata (2016) agree that a
VOI-driven evaluation process promotes a broader, more strategic view of project
consideration and prioritization. They further argue that to focus on value instead of
return promotes more meaningful accessing of the benefits from investments. With this
in view, it appears that the general trend now is for organizations to consider more VOI
models which consider the overall value generated from projects instead of just the
foreseeable tangible aspect.
According to Permuth and Andrade (2014), companies, in recent times, are adopting this “new ROI” i.e. VOI to help in evaluating employee performance as well as recognition
programs. It seems that even though the trend is moving towards VOI, there is also the
question of whether it will prove to be as enduring as ROI has been. Nevertheless, the
triple constraint on projects stipulated by Baratta (2016) i.e. value, scope and capability,
shows clearly that the true way to measure the success of a project is by the delivered
value of the project. This according to him, is the way projects will be evaluated in the
which focuses on a single project, and is primarily based on a cost view. He explains that
the “value triple constraint” states that the value delivered is a function of the scope of
the business opportunity and of our capability to identify, decide on and deliver the
business opportunity.
Hence in today’s economy, the harder-to-quantify resources or intangibles such as
employee engagement, collaboration, networks etc. are the key to creating services and
products that have competitive advantage (Permuth and Andrade, 2014, p. 4).
2.3 Project evaluation models reviewed
2.3.1 Return On Investment (ROI)
2.3.1.1 Definition
A conceptual definition of ROI is given by Jeffery (2006) as “a project’s net output (cost
savings and/or new revenue that results from a project less the total project costs), divided
by the project's total inputs (total costs), and expressed as a percentage”. According to
Applied Geographic Inc. (2009), it is a calculation of the most tangible financial gains or
benefits that can be expected from a project versus the costs for implementing the
suggested program or solution. Using a strict business-school definition Mott and Granata
(2006) say it is a dollar-for-dollar return on a project.
Major (2013), defines ROI as “a measure that investigates the amount of additional profits produced due to a certain investment”. She elaborates that businesses use this calculation
to compare which of the different scenarios for investments would produce the greatest
profit and benefit for the company. According to this view, ROI can have three different
outcomes - positive, negative and zero. Any one of these outcomes guide the company in
taking a specific decision regarding whether to either undertake a project or reject a
project. Permuth and Andrade (2014) also suggest that ROI is the most common measure
of financial efficiency between benefits and costs of investments. They conclude that the
gains from the investments are the incremental financial benefits expected from the
In view of the above definitions, this work can conclude that, ROI is focused on tangibles,
and to be specific, the tangible/quantifiable financial/monetary benefits the project brings.
It is a rigorous financial tool whose focus is mainly in the bottom line of the business i.e.
profit.
2.3.1.2 Strengths of ROI
In considering its strengths, there are some views which are juxtaposed in order to gain
insight in this area. According to Thorne, Hilton & Langfield-Smith (2012), ROI can be
isolated into two components, which are return on sales and investment turnover. Any
action taken with the sole purpose of making these parts more favourable could have
adverse effect on performance in future years. However, it is emphasized that ROI
encourages managers to focus on both profits and the assets required to generate profits.
Another strength posited by Thorne et al. (2012) is that ROI can be used to evaluate
relative performance of investment centres, even when those business units have different
scales of operations.
Also as part of its strengths Agarwal (2015), states that ROI is a better measure of
profitability, in that it relates the net income to investments made in a division hence
ensuring a better measurement of profitability in that division. He also adds that; not only
does it help in measuring profitability but also the performance of an investment division
can be measured using ROI as well as the performance of the investment managers
themselves.
2.3.1.3 Limitations of ROI
In Permuth and Andrade’s (2014) view, while ROI estimation remains a useful tool in
making the economic case for investments in projects, its measurement ability when it
comes to business performance or project performance is one-dimensional, and therefore
it is restricted to capturing only a limited number of factors that impact performance. They
also suggest that gathering all the ROI inputs for the ROI formula is an complicated task
even in the best of circumstances, and the output provides an incomplete picture of project
Meanwhile, Thorne et. al. (2012), indicates a number of limitations associated with ROI
which include the fact that it can encourage managers to focus on short-term financial
performance at the expense of the long-term benefits of the business. This can be seen in
the excessive cutting down of costs in the term, thus increasing the ROI in the
short-term but reducing the long-short-term competitiveness of the business.
Furthermore, according to Kaplan Financials (2017), where ROI is a performance
measure, can lead to dysfunctional decision making. Management may take decisions that
affect only a divisional ROI regardless of the wider business benefit. Similarly, Agarwal
(2016) argues that, ROI could influence managers to select investments with higher rates
of return in line with their ROI and reject investments which have lower rates of return
but which could add value to the business. A division could invest in a project to increase
their ROI which may not impact the business as a whole. Agarwal notes, as indicated
earlier, that ROI increases the focus on short-term goals and not long-term goals of the
organization, hence possibly exposing the business to negative outcomes in the long-term.
2.3.2 Value On Investment (VOI)
2.3.2.1 Definition
According to Orr (2011), VOI is defined as the “measurement of the expected benefit of an investment”, and it considers both financial and intangible benefits. He further states
that VOI is the total measure of expected benefits. It can be employed alone as a tool and
it includes ROI. Harris et. al. (2001), also argue that the wealth created by investments
in intangibles can be considered as value on investment instead of return on investment.
They indicate that VOI is the measure of the total benefits gained from the intangible
initiatives of an investment and that ROI is a component of VOI, noting that businesses
focusing only on the quantifiable return on investments are missing the benefits of the
overall value they will reap from the soft initiatives from the investments (Harris et. al,
p.1, 2001). Phelps (2013), also states that VOI is the measure of the intangible benefits of
Permuth and Andrade (2014) also confirm this by saying that when it comes to intangibles
like recognition programs, leading companies are progressively realizing that the benefits
of such intangibles go beyond short-term financial calculations.
2.3.2.2 Concept of VOI
In their conceptual development, Harris et. al. (2001), posit that most enterprises often
treat soft or intangible initiatives as long-term, and not as short-term tactical investments.
While these enterprises perceptively recognize the value in these initiatives, most lack a
formal process for assessing the expected value from such initiatives and the process of
managing them to achieve this value.
However, they conclude that VOI is achieved through initiatives that include but not
limited to increased organizational competencies and that over time this value is
increasingly the source of competitiveness and increased value of brand among others.
They further suggest that, on one hand, since value is unique and tied closely to
enterprises, it must be framed within the enterprise’s strategic direction. Thus such soft
initiatives require strategic drivers and alignment. On the other hand, value may be
contextual and subjective and as such varies with varying perspectives.
Phelps (2013), builds her thinking about value on investment from the viewpoint of the “dreaded question” that always come up in business continuity programs. She argues that instead of trying to answer this daunting question of ‘what does this project do to the company’s bottom line?’ one needs to consider the value addition of projects to the
company instead of just the financial addition. She makes a case for the possibility of
tying the finances invested to the desired and realistic company outcomes like competitive
advantage, increased resilience, effective staff training etc. and thus to show that there is
the need to consider the value added instead of only the money added. In her
consideration, shifting to a VOI approach instead of an ROI approach provides the needed
However, in order to start shifting the thinking towards value on investment, one has to
consider her concept of “whiteboard activities”1 which takes into account what value is
being generated by the company now, what value is the project bringing on board and
what each person is doing now to add value to the overall value of the company. After
determining answers to these questions, it becomes clearer which of these values must be
communicated to decision makers and the company at large for buy-in.
2.3.2.3 Strengths of VOI
Permuth and Andradre (2014) observe that, as opposed to ROI, which tends to be limited
in capturing the breadth of program impact, the VOI model enables a long-term appraisal
of the value of the investment. While ROI may be sufficient for some tactical analyses,
VOI is a robust tool for assessing the strategic potential of intangibles to change
organizational dynamics like innovation over a long period of time. Harris et. al. (2001)
show that VOI for enterprise performance initiatives increases competitiveness or
competitive parity of enterprises. They also indicate that VOI is transformational in
nature, since it helps focus the strategic direction of the enterprise and pushes the
enterprise’s capabilities toward the vision which is embedded in the strategic direction.
This leads to competitive advantage. Saleem et. al. (2012) point out that the VOI approach
provides the needed environment to compute the level of services, knowledge, and other “soft” benefits, which cannot be measured by using the ROI methodology.
2.3.2.4 Limitations of VOI
As Phelps (2013) notes, VOI is a subjective endeavour and hence will be difficult to
measure with the same precision as ROI. Furthermore, it does not directly measure an investments’ impact on the bottom line (Mott and Granata, 2016).
1 Phelps uses “whiteboard activities” to describe activities that are done on a whiteboard. These are
2.3.3 Quantifying intangible benefits of project
2.3.3.1 Introduction
When you can measure what you are speaking about, and express it in
numbers, you know something about it; but when you cannot express it
in numbers, your knowledge is of a meagre and unsatisfactory kind; it
may be the beginning of knowledge, but you have scarcely in your
thoughts advanced to the state of science. Lord Kelvin
As indicated above, in order to enhance decision-making and give a defensible premise
for actions taken, it is worthwhile trying to measure the important intangibles that exist
and contribute to organizational performance. Such intangibles may be measured,
arguably, in non-quantitative ways, but when they are expressed quantitatively they help
to reduce uncertainty which is critical to organization development.
According to the OECD (as cited by Gyorgy, Vintila & Gaman, 2014), benefits are
defined as increases in human wellbeing or utility. Zwikael and Smyrk (2012) define
project benefits as “lows of value that arise from a project”. However, benefits of a project
can be either tangible or intangible. Emprend Inc. (2017), notes that although they should
be tied to a business goal, soft or intangible benefits are hard to measure in general as
opposed to tangible or hard benefits. Such benefits of the former include but are not
limited to the following: improved employee morale and engagement; increased customer
satisfaction; reduced risk; increased alignment with market trends etc. They often have
multiple sources and influences, thus while a project may help improve the overall
employee engagement, a variety of other factors may have the same effect, making it
difficult to pinpoint the impact of the project. Hartman (2017) also stipulates that when
evaluating intangible benefits one has to realize that there is a reliance on informed
predictions and secondary comparisons, which makes it a difficult task to perform
However, Keen (2003) states that handling intangibles can provide a big boost. Yet too
often, eligible but soft potential benefits are not assessed as valid results in organizations.
According to him, more than 25% of the value of enterprises is now based on intangible
assets, such as brand image. Unfortunately, when business cases are devoid of analyses
of intangible outcomes, projects vital to the enterprise go unfunded because intangibles
cannot add to the hard ROI numbers.
In this context, it is noteworthy that Harris et. al. (2001) suggest that in late 20th century
economies (leading into the 21st century), only progressive businesses recognize the value
of intangibles and the potential they have to create value for businesses.
2.3.3.2 Project specific intangible
2.3.3.2.1 Employee Adoption and Usage
In every organizational setting, the acceptance of any change is largely dependent on how
the individuals within the organization adopt and use the new change. It is therefore an
indicator of whether a change will be effectual or not. Rogers (1995) defines adoption intention as the individual’s intention to use, acquire, or purchase an innovation. It
represents a continued usage of a change over time and it is a precursor of the actual usage
of a change. By definition, according to him, the rate of adoption is usually measured by
the length of time required for a certain percentage of the members of a system to adopt
an innovation. In his work on diffusion of innovators, Rogers (1995) categorizes
innovators as being early adopters, early majority, late majority and laggards when
assessing how people adopt to technology. According to PROSCI (2017), a similar
pattern can be followed with regards to organizational change. This simply means that
different employees require different times to internalize and adopt a change to their work.
Hence the speed of adoption for the employees is impacted by their own transition with
respect to the change. How quickly employees adopt the change has a direct and
measurable impact on the return a project delivers overall.
As Hubbard (2010) notes, if something can be observed in any way at all, it lends itself
measurement if it is able to tell us something more than we knew before. This helps to
lessen the uncertainty that it carried with it earlier. Therefore, knowing this percentage
(A&U) gives us the assurance that we are able to help redeem the value which would
otherwise be lost to the organization.
2.3.4 Relationship between ROI and VOI
According to Donald (2003) as cited by Saleem et. al. (2012), ROI and VOI are interconnected and dynamically interact with each other, and today’s modification in VOI
can drive better ROI in the future, and better ROI today can manage improvement that
will guide towards complete VOI tomorrow. Permuth and Andrade (2014) use the
following diagram to depict the relationship between these two evaluation models for
today, tomorrow and always.
From Figure 1, it can be presupposed that, there is always going to be the need for both
models as far as business performance is concerned. However, the trend is to increasingly
recognize VOI as a surer way to evaluate projects and programs for business performance. Figure 1: VOI as the new ROI
It is also the case that though businesses are interested in the bottom line issues to stay
afloat in an ever-changing world, for sustainable business for the future, it is the overall
value which counts and this will affect the bottom line but not as directly as may be
perceived by businesses. The focus should therefore be on the “always” portion of figure
1, where both models meet.
2.3.5 People side of Change Management
2.3.5.1 Introduction
Nikols (2016) defines change management from four different perspectives which are,
the task of managing change, an area of professional practice, a body of knowledge and a control mechanism. It is “the making of changes in a planned and managed or systematic
fashion”. He concludes that the scope of such change is within an organization and as
such these changes could be triggered by some external events. He also indicates that
there is an aspect of the task of managing change which includes managing its impact on
people. He notes, however, that for many managers, this aspect of the task of managing
change is complicated due to the fact that there are two challenges they face. One
challenge is helping their people cope with the change and the other challenge is the
managers themselves coping.
In a more targeted definition Hiatt and Creasey (2012) view change management as “the
application of processes and tools to manage the people side of change from a current
state to a new future state so that the desired results of the change (and expected return on investment) are achieved”. They posit that change has occurred only when individuals
in an organization begin to do their work in a new way, and that the individual shifts in
behaviour is the cornerstone of change. In their view, organizational change requires
individual change. In reality, this assumption may be unfounded, as individuals may not
change their sentiments or activities to align with desired organizational change. Indeed,
PROSCI (2006) concludes that, effectively managing the human side of change can help
accelerate user adoption, increase the overall participation of employees and improve the
benefit each and every employee realizes from the change, thus increasing the ROI the
In light of this and building on these views of the people side of change management, it
is easy to consider the organization-wide change and loose track of the fact that it is the
collective individual change that makes the organization-wide change.
2.3.6 ROI of Change Management (CMROI)
2.3.6.1 CMROI Model
In their building of the Change Management-ROI model, PROSCI (2006), considers three
main contentions that need to be engaged with. PROSCI’s views are briefly presented
below.
i. The ROI delivered by a project rarely equals the expected ROI. This does not
mean that the delivered ROI is always less than the expected ROI. On the contrary,
there are some projects whose ROI delivered far exceeds the expected ROI.
ii. The more people are affected by a change, the less certain the ROI. The question
is put whether it is likely that the predictability of project outcomes differs
between projects. The general relationship between how certain one can be of the
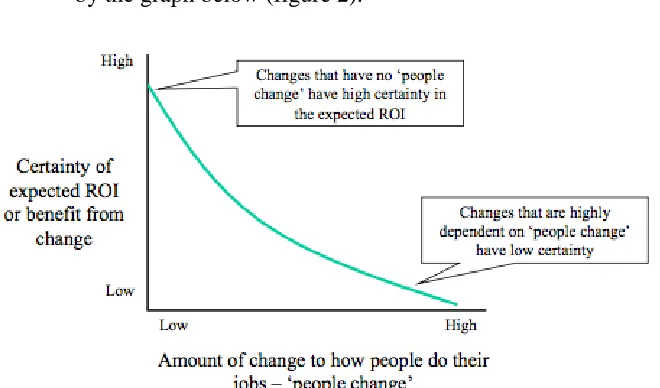
ROI of a project and the amount of 'people change' created by that project is shown
by the graph below (figure 2).
Figure 2: A graph of people change against expected ROI,
The graph in figure 2 shows the two extreme cases of “no change to how people do their
jobs” and “extraordinary change to how people to their job”. In PROSCI’s view, generally
projects that fall on the right-hand side of the graph are less predictable, but such projects
tend to be the types of changes that deliver the most value to the organization.
iii. There are three human factors that create variations in project ROI. These three
factors come from the analysis above, as well as an examination of the
consequences of poorly managing change. They are:
Speed of adoption - how quickly employees begin to use the new
processes, systems etc. that the change brings;
Ultimate utilization - the participation rate of employees in the change and
Proficiency - how effective employees are in relation to the change.
In conclusion, PROSCI (2006) make the observation that the expected speed of adoption,
ultimate utilization and proficiency contribute to the ROI that the project expects to
realize.
Given, however, that effective change management enables projects to deliver on, or even
exceed, these expectations and hence contributes directly to the ROI of the project,
PROSCI (2006) further states that even if a project has a good solution and good project
management, it is more likely to not meet its objectives if the people side of the change
is not managed, thus the need for a good model of Change Management-Return On
Investment.
2.4 Conclusion
2.4.1 Summary of major contributions of significant studies
On a broad scale, there is less literature on the concepts of VOI which makes it easier to
identify Gartner as the source of this concept (Harris et. al., 2001). On the other hand, and
as discussed previously, there is detailed and very elaborative literature available by
organizations to sustain their businesses because they need to remain competitive, there
is no doubt that studies such as those by Phelps, IBM group etc. which help to shift the
focus from ROI to VOI will remain significant.
It is clear that the two measures are related/coupled and will indeed underpin the way that
businesses thrive in the future. Given this, there is little doubt that there is a need to
strengthen further this relationship/coupling. To that end, the need for analysing Change
Management-Return On Investment will also remain high, irrespective of the kind of
project one is considering. This is because, all projects are to be used by or applied to
human beings and as such there will always be the issue of adoption by these humans -
the actual adoption and usage of any project. The optimal adoption and usage by the
people-side of projects help regain what could potentially be lost value of the project.
Chapter 3
3.0 Research Methodology
3.1 Introduction
This chapter discusses the research methods used in this study including the research
design, the setting, the population and the data collection instruments applied. It also
discusses the ethical considerations in this study as well as the limitations of this research.
A sequential mixed-method research approach was used combining both qualitative and
quantitative methods. The researcher started with a qualitative approach and subsequently
used the quantitative strategy to explore the factors that affect the adoption and usage of
the ISO-IMS system in the port.
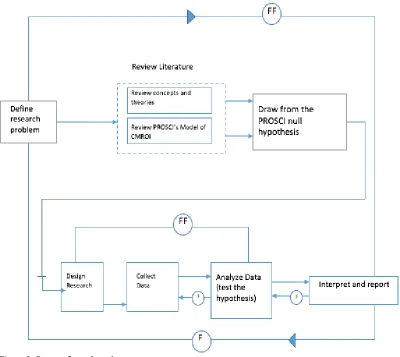
3.2 Research process
Drawing from Kothari (2004), the following research process was used to achieve the
Figure 3: Process flow adopted,
Source: Kothari, 2004, p. 11
In figure 3, FF represents feed forward. This means that the preceding process becomes
a check to the subsequent process and it serves the vital function of providing criteria for
evaluation. F represents feedback; these reflect the case where the subsequent process
becomes an input to the preceding process and thus helps in controlling the sub-system
to which it is transmitted.
3.3 Hypotheses of the study
This study’s hypothesis is built upon the conceptual framework in Chapter One. Given
that a portion of the project benefit (value) is dependent on employee adoption and usage
(A&U), null hypothesis for this work states that the value realized will be same as the
hypothesis to be true there should be maximum adoption and usage even if no one changes
the way they work at the port with the new ISO-IMS system in place and that there will
be no variance between value realized and value expected. On the other hand, a true
alternative hypothesis (falsifying the null hypothesis) proves that there is variance
between value realized and value expected, because adoption and usage of this system is
low. This latter outcome would mean that people will need to change the way they work
with the new ISO-IMS system in place (increased adoption and usage) to reduce the
variance between realized and expected values. For this to happen, there is the need to
lead and manage this change in order to contribute to the overall project ROI, which gives
rise to the captured value of the CMROI.
3.4 Research design and methods
According to de Vaus (2001), “research design” refers to the logical structure of an
enquiry. He states that the function of research design is to ensure that the evidence
obtained enables the researcher to answer the relevant question as unambiguously as
possible. Based on this, the exploratory research design is used in this research. According
to Kothari (2004), the main purpose of such studies is to formulate a problem for a more
precise investigation or for developing the working hypothesis from an operational point
of view. The major emphasis in such a study design is on the discovery of ideas and
insights. Since a business case requires the developing of reasoning to convince decision
makers, it was worthwhile to choose this design for this research. In order to satisfy the
objectives of this work, a combination of quantitative and qualitative (mixed-methods)
with explorative descriptive concept was adopted for this study, to first give room to
ascertain from the project development team their expectations after implementing the
ISO-IMS project, and further to check whether these expectations were met from the point
of view of the users of the system. This approach helped to bring to light the variance
between expected and realized values discussed in Chapter One of this study, which was
the problem formulated in the beginning.
Additionally, it was imperative that the researcher use this design to help come up with
add value to the overall project ROI. This goes to say that, the independent variable in
this research was the adoption and usage of the ISO-IMS, while the dependent variable
was the project value realized. However, this research does not find the actual value
realized but rather uses percentage of this value that is dependent on the adoption and
usage with the remaining percentage amount being the one not dependent on adoption
and usage. The combined percentages give us 100%, which is the total percentage value
realized.
The objective of research, particularly applied research, is to academically interrogate and
find a solution for a given problem. In view of this, the data available and the unknown
aspects of the problem have to be related to each other to make a solution possible
(Kothari, 2004, p. 7). During this research two methods were used to collect data so as to
arrive at the required solution. The two methods were also applied to establish
relationships between the data collected and the unknowns, and lastly to evaluate the
accuracy of the results obtained. These two techniques are derived from the broader
quantitative and qualitative methodological approaches. Tashakkori and Teddlie (2009)
broadly define this kind of mixed-method approach as research in which the researcher
collects and analyses data, integrates the findings and draws inferences by applying both
qualitative and quantitative methods in a single study of enquiry. Some associated merits
of the mixed methods approach according to Johnson and Onwuegbuzie (2004) are as
follows:
It can provide quantitative and qualitative research strengths
The researcher can generate and test a grounded theory
It can help answer a broader and more complete range of research questions
because the researcher is not confined to a single method or approach.
It gives room for one to use the strengths of an additional method to overcome the
weaknesses in another method by using both in a research study.
Applying both qualitative and quantitative research can produce more complete
3.4.1 Quantitative research technique
In this study, quantitative data was transposed using the PROSCI CMROI calculator into
numbers, specifically percentages, which were very objective and the result of a
systematic process to obtain information and describe the relationship between variables.
These variables showed the effect of A&U on the project objectives. Doing this, helped
to give grounds to be able to test the prove the underlying principle of the PROSCI
framework – examining what would be the effect if no one changed the way they worked
after the implementation of this project. The research also sought to understand how A&U
of the ISO-IMS would be affected by the environment itself. To answer this, a quantitative
method was used to collect specific data, based on the PROSCI framework and the
associated CMROI Calculator2. The framework gives the format and procedure for
analysing project benefits using the principle, while the CMROI calculator captures the
respective inputs and, based on the principle, quantifies the A&U, as well as the CMROI
indicating the overall captured project benefit. the researcher was able to determine what
to expect - either a higher adoption and usage percentage or a lower one for the scenario
analysis.
3.4.2 Qualitative research technique
Mehta (2013) states that qualitative research is used when a researcher attempts to
understand a larger reality and does so by examining it in a holistic way or by examining
components of that reality within their contextual setting. In this study the researcher
applied this method to gain insight into the general project aim and company benefits
from this project by the project team.
3.5 Research setting
The principle of maximization (Morse and Field, 1996) states that a location or setting of
a research study should be where the topic of study manifests itself most strongly. On this
basis, the researcher chose the Tema Port of Ghana where he found the effect of this
research to manifest strongly due to the fact that there are several new procedures, systems
and technologies that have been introduced in the port over recent years. All these have
come with new ways of doing the same work. Such projects are being deployed as a result
of a major port expansion project and according to the GPHA’s strategic direction, all
these projects must be in line with the ultimate goal of making GPHA the preferred port
in the sub-region. These projects may be said to have created a project bank for the
Authority, which in the short to long-term needs to be managed to ensure each of these
projects meet their respective set goals. Because these projects - like most projects - are
highly dependent on how efficiently and diligently people change their ways of doing
work and adopt the change, this setting was deemed to be the appropriate setting to
conduct this study.
3.5.1 Population
The population for this research data collection was the entire Ghana Ports and Harbours
Authority, Tema workforce.
3.5.2 Sampling
A sample consists of the cases, units or elements that will be examined and are selected
from a defined research population, according to Boeije (2009), to reflect the population.
Purposive sampling was done to arrive at two categories of participants for this research.
One category was the project team of the ISO-IMS project and the second category was
the Tema permanent staff of the GPHA both junior and senior staff respectively. The
justification for such a sampling method was firstly, to get the quantitative data mentioned
earlier and secondly the qualitative data from these two categories of participants. The
main quantitative data was from the project team of the ISO-IMS project and this was
used to test the hypothesis of the PROSCI framework and CMROI calculator. Some
quantitative data was also obtained from the staff. The latter set of quantitative data helped
ascertain which departments are affected most by this project. Qualitative data mainly
was obtained from the project team regarding the aims and objectives of the project and
the organizational benefits expected from the project. The questionnaires were sent to a
sample of 800 staff members.
3.5.2.1 Recruitment and access
In order to recruit participants for the second category of this study, the researcher wrote formally to the GPHA’s Headquarters Human Resource General Manager to request for
a formal release of the permanent staff mailing list for the purposes of this study. Access
was granted by the general manager from the IT department, and the mailing list was
released. The list comprised of the various departments’ permanent staff internal email
accounts. The questionnaires were disseminated to the participants using this list.
To be an eligible respondent for the first category of participants, one had to have been
part of the ISO-IMS project team. A formal request was also made to the General Manager
of the Business Development Department (the project developers), to grant access to
project specific data, in this case the project document information related to the
objectives and expected aim of the project.
3.6 Data collection
Kothari (2004) states that the task of data collection starts after a research problem has
been defined and research design has been laid out. In this study, in much the same way,
this aspect of data collection was performed using an online form which users could
access by scanning a QR code or clicking on a link created by the researcher and sent to
their emails to access the questionnaires. On the other hand, the data from the project
team had to be collected by mailing the relevant questions to the team for them to be
responded to and then sent back to the researcher.
Most of the data collected for this study was primary data (as opposed to secondary data