New Zealand Journal of Ecology (1999) 23(1): 45-51 ©New Zealand Ecological Society 2Department of Conservation, Private Bag 68-908, Newton, Auckland, New Zealand.
AN EVALUATION OF THE EFFICIENCY OF RODENT
TRAPPING METHODS: THE EFFECT OF TRAP
ARRANGEMENT, COVER TYPE, AND BAIT
__________________________________________________________________________________________________________________________________
Summary: Eradication of rodent species from some offshore islands has proved to be an effective means of conserving native animal communities and restoring natural ecological processes on the islands. As methods of eradication differ for different rodent species, a truthful monitoring method to detect species presence and relative density is essential for a successful eradication programme. This study compared two spatial arrangements (line vs. grid), 5 different baits (chocolate, cheese, soap, wax, oiled wood) and 3 cover types (transparent plastic, wire netting, galvanised iron) on the detection of 2 species of rodents on Browns (Motukorea) Island in June and August.
The two species of rodents present on the island were Norway rats (Rattus norvegicus) and mice (Mus musculus). Trapping using conventional trapping lines and trapping grids was carried out in June and August, respectively. The traps were set for 8 nights for both lines and grids. Trap lines caught 12.40 rats per 100 corrected trap-nights (100 ctn-1) and no mice; trap grids caught 5.3 rats 100 ctn-1 and 0.2 mice 100 ctn-1. Trap grids appeared to be better than trap lines for detecting the presence/absence of rodent species when two species coexist and one appears subordinate to the other. On trap lines the trapping rate of rats was
consistently high for five of the first six nights. On trap grids the trapping rate was variable on all nights with the first mice being caught on the third night. Three-night trapping sessions, conventionally used by most researchers, should be reliable for testing the relative densities of numerically dominant species but may not detect all rodent species present.
Of five different bait types tested for monitoring rodent presence, the preferred order was chocolate, cheese, soap, wax and oiled wood. The efficiency of covers made of different materials, (galvanised iron, plastic, and wire netting) was also tested. Wire netting covers had the highest trapping rate and galvanised iron covers had the lowest. Three blackbirds (Turdus merula) were caught under wire netting covers, indicating a risk to non-target organisms.
__________________________________________________________________________________________________________________________________
Keywords:Norway rats; Rattus norvegicus; mice; Mus musculus; trap line; trap grid; trap cover; bait.
Introduction
Introduced rodent species have been a major factor in the reduction or extermination of native animal populations in New Zealand (Atkinson, 1978; Whitaker, 1978; Moors, 1983, Bremner, Butcher and Patterson, 1984; McCallum, 1986; Miller and Miller, 1995), and continue to suppress or threaten native fauna. Among the four rodent species introduced to New Zealand, kiore (Rattus exulans Peale) is now found mainly on offshore islands, while the other three, Norway rats (R. norvegicus Berkenhout), ship rats (R. rattus L.) and mice (Mus musculus L.) are widely distributed on the mainland and many islands (Clout, 1980; Efford, Karl and Moller, 1988; Dowding and Murphy, 1994). Some islands have only one rodent species present (Bettesworth, 1972; Taylor and Thomas, 1989,1993), while others have been invaded by more than one species (Hickson,
Moller and Garrick, 1986). Determining which rodent species are present on an island in New Zealand typically relies on the setting of a line of kill traps with galvanised iron or mesh covers, often alternating mouse and rat traps (Cunningham and Moors, 1993), and is usually run for three nights.
Eliminating rodents from islands in New Zealand is now common practice, with 58 eradications successfully completed, 26 awaiting confirmation of success and only two recorded as failures (Veitch, 1995). The method of eradication varies for different rodent species (Veitch and Bell, 1990). As a consequence, correct assessment of the presence, distribution and relative density of rodent species is essential for successful eradication.
study it was not known if the invading Norway rats had caused a decrease in or eliminated the mouse population. Studies have shown that the presence of larger, and presumably more dominant, rat species may reduce the trappability of mice (Brown et al., 1996). In this study, we set out to test different methods of rodent capture and monitoring on Browns Island where more than one rodent species was believed to be present.
Methods
Browns Island, or Motukorea, is located in the Hauraki Gulf about 10 km east of central Auckland City, and has an area of 60 ha (Fig. 1). The northern and eastern part of the island is dominated by a volcanic cone rising to 68 m above sea level. The southern and western part is flat and extends to within 1600 m of the adjacent mainland.
The island has been grazed by cattle and sheep for more than 100 years. Most of the cover is now grassland dominated by kikuyu grass (Pennisetum clandestinum)1 except around the upper parts of the volcanic cone where the grass Microlaena stipoides is predominant. Patches of trees remain on the steep
north-western, northern and north-eastern sea cliffs. These comprise a canopy dominated by pohutukawa (Metrosideros excelsa) with a mixed understory of mainly exotics such as Rhamnus alaternus and Chrysantemoides monilifera and scattered natives such as Melicytis ramiflorus, Pseudopanax lessonii and Myoporum laetum. There are also small patches of rocky areas covered by Muehlenbeckia australis vines. Such areas were mainly distributed at the foot of the volcanic cone. Esler (1974) recorded the presence of 132 plant species, comprising 54 native and 78 exotic species.
Rodent capture
For all the operations described in this paper two types of trap were used: “Ezeset” wooden rat snap traps and “Ezeset” wooden mouse snap traps. All traps were baited with a rolled oats/peanut butter mixture. All traps were checked and bait renewed daily.
Two different methods of trapping, (a) trap lines and (b) trap grids, were used to assess the best way of detecting the presence of rodents.
a) Trap lines
Eight trap lines were established in three different habitats around the island (Table 1; Fig.1). Trap lines were operated for a total of 464 trap-nights for each trap type from 12 to 23 June 1995. Rat and mouse traps were set alternately along each trap line at 25-m intervals, giving a 50-m interval between traps of the same type. Seven mouse traps and three rat traps were in areas covered by Muehlenbeckia australisvines. Details of each line are given in Table 1. Trapping success is expressed as number of captures per 100 corrected trap-nights (100ctn), which accounts for the non-availability of sprung traps (Nelson and Clark, 1973). The trapping results for different habitats and covers were analysed with Maximum Likelihood ANOVA (SAS Institute, 1990) since the data were not normally distributed.
b) Trap grids
Two trap grids of 11 x 11 trap sites covering a total area of 12.25 ha, or 20.4% of the total area of the island (Fig. 1), were established in early August 1995. Traps with wire-netting covers were placed with a single mouse trap and rat/mouse pairs alternately at 25-m intervals on every second row of the grid, with single mouse traps at each site of the alternate rows. This resulted in each grid containing 25 rat traps and 121 mouse traps. Sixteen mouse traps and 4 rat traps were in areas covered by Muehlenbeckia australis vines. The remainder of the grid areas was grassland. Traps were operated for eight days, resulting in a total of 1936 trap-nights for mouse traps, and 400 trap-nights for rat traps.
Figure 1: Browns Island showing trap lines and trap grids.
The end of the trap line trial and the beginning of the trap grid trial were separated by an interval of just over one month so that we can assume little direct interference between the two sampling sessions.
Trap covers
Three types of trap cover were used: clear plastic, galvanised iron and wire-netting. Covers were used in sequence so that the first rat and first mouse traps had clear plastic, the next rat and next mouse traps had galvanised iron and the next rat and next mouse had wire netting, and so on. Trap covers are routinely used in poisoning operations to reduce the risk of capturing non-target animals such as birds.
Bait preferences
Five bait types were tested to determine which was most preferred and hence most useful for monitoring the presence of rodents. These included cheese (Anchor tasty), cooking chocolate, candle wax, soap (Sunlight) and soybean oil on wood.
The baits were cut into approximately 1-cm cubes and were held by U-shaped wires to the edge of a 5 cm x 5 cm x 1 m wood plank. Ten cubes of
each type were positioned, with 1-cm gaps between each cube, in a repeating order along the plank. Two such bait sample blocks were set up and used at a total of 10 different locations over five nights, from 15 to 19, June 1995. Baits were recorded as either not touched, chewed or eaten. All baits were replaced each day. The results were analysed using a Maximum Likelihood ANOVA to detect any preference for bait types.
Results
Trap lines
The 464 trap-nights for each trap type returned a total capture of 51 rats and no mice. Full details of the capture rates and numbers of sprung traps under different cover types and in different habitats are given in Table 2. Numbers of captures per 100 ctn-1 were similar for five of the eight nights but lower and varied considerably in the other three (Fig. 2,
2=15.22; d.f.=8; P<0.05). The average number of rats trapped was 12.40 (S.E.= 1.90) rats per 100 ctn. There was no significant difference in trapping rates of rats between the different habitats (2 = 4.11; d.f.=2;P>0.05) (Fig. 3).
Table 1: Numbers of rat and mouse traps under different cover type and in different habitat types on the trap lines. __________________________________________________________________________________________________________________________________
Number of covers
_____________________________________________________________
Trap line ____________________________________________________________________________________Number of traps Plastic Galvanised iron Wire netting Nights
Habitat type number Rat Mouse Rat Mouse Rat Mouse Rat Mouse operated
__________________________________________________________________________________________________________________________________
Bush 2,3,6 17 17 6 6 5 5 6 6 8
Hill grassland 4,7 23 23 7 7 8 8 8 8 8
Flat grassland 1,5,8 18 18 6 6 6 6 6 6 8
Total traps 58 58 19 19 19 19 20 20
Total trap nights 464 464 152 152 152 152 160 160
__________________________________________________________________________________________________________________________________
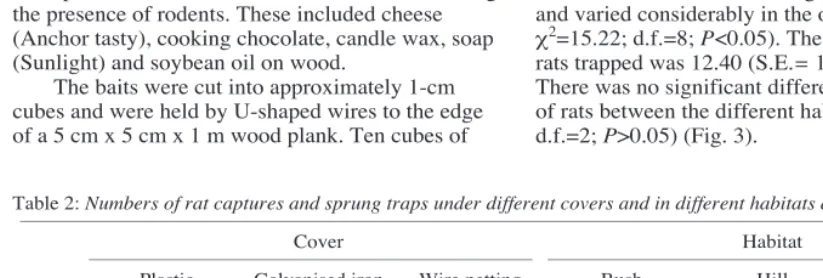
Table 2: Numbers of rat captures and sprung traps under different covers and in different habitats along the trap lines. __________________________________________________________________________________________________________________________________
Cover Habitat
__________________________________________________________ _____________________________________________________________ Plastic Galvanised iron Wire netting Bush Hill Flat grassland Rats Sprung Rats Sprung Rats Sprung Rats Sprung Rats Sprung Rats Sprung Night caught traps caughts traps caught traps caughts traps caught traps caughts traps __________________________________________________________________________________________________________________________________
1 2 2 2 1 3 3 4 4 1 1 2 1
2 3 1 3 3 2 1 3 2 2 2 3 1
3 3 2 2 1 2 4 3 3 3 2 1 2
4 1 3 0 4 3 5 0 4 3 1 1 7
5 2 3 1 2 5 2 2 3 3 0 3 4
6 3 0 2 1 5 1 4 0 4 1 2 1
7 2 1 0 2 3 2 3 2 0 0 2 3
8 0 1 0 0 2 1 1 1 1 1 0 0
Total 16 13 10 14 25 19 20 19 17 8 14 19
Trap grids
The total capture on the two grids was 21 rats and 5 mice (Table 3). Capture rates were highest (close to 10.0 rats 100 ctn-1) on nights 2,3, and 7, whereas capture rates on the other nights did not exceed 7.00 rats 100 ctn-1 (Fig. 4). Mice were first caught on the third night of trapping. All mice were caught in the centre of the grid whereas rats were more frequently caught on the other lines of the grid. The mice were all caught in small rocky areas covered with Figure 2: Mean (± S.E.) nightly rat capture rates100 ctn-1 on the trap lines with all three habitats combined (n= 3).
Table 3: The number of trap nights, sprung traps and uncorrected captures of rats and mice on both trapping grids combined.
______________________________________________________________ Trap nights Sprung traps Captures Day Rat Mouse Rat Mouse Rat Mouse ______________________________________________________________
1 50 242 6 8 1 0
2 50 242 7 18 4 0
3 50 242 10 15 4 2
4 50 242 8 18 2 1
5 50 242 5 19 2 1
6 50 242 5 10 1 0
7 50 242 3 6 4 1
8 50 242 4 5 3 0
Total 400 1936 48 99 21 5
______________________________________________________________ Figure 3: Mean (±S.E.) rat capture rates 100 ctn-1 of eight days (n = 8) along the trap lines in different habitats.
Muehlenbeckia australis. The average capture rates were 6.09 rats 100 ctn-1 (S.E. = 1.08) and 0.2 mice 100 ctn-1 (S.E.= 0.08).
Trap covers
Rat trapping success varied significantly with the different cover types used on the trap lines (2 = 7.47;d.f. = 2; P<0.05). The descending order of success for the different covers was wire-netting, clear plastic and galvanised iron (Fig. 5). Wire netting covers had a significantly higher catch rate than galvanised iron covers (S=47.5,P<0.05, Wilcoxon’s rank sum test). The only non-target animals caught were three blackbirds (Turdus merulaL.), all caught under netting covers.
Figure 4: Mean (±S.E.) captures rates100 ctn-1 of rats and mice on the two grids (n= 2).
Figure 5: Mean (±S.E.) rat capture rates 100 ctn-1 of eight days under different cover types, (n = 8).
Baits
Discussion
Rats were trapped in similar numbers in each of the three different habitat types on the island. The forested habitats were small and rats probably moved to and from the adjacent grasslands. The mice were all caught in two small rocky areas covered by dense Muehlenbeckia australis vines, which probably provided sheltered sites inaccessible to Norway rats. The presence of mice in dense ground cover microhabitats in areas containing another dominant rodent species has been reported before (Brown et al., 1996). During 928 trap-nights along trap lines in June, with equal numbers of traps set for rats and mice, 56 rats but no mice were caught. On Motuihe Island a reverse situation occurred where rats were not caught on trap lines,
while the trapping rate for mice was high (4.45 mice 100 ctn-1; Stubbs, 1996). Subsequent trapping on Motuihe Island confirmed the presence of rats (C. R.Veitch,unpubl. data). On Browns Island, both rats and mice were caught in two trapping grids operated a month later, during August. One possible
explanation for catching mice during the grid session is that a trapping grid, which is likely to remove a large proportion of the dominant species from the centre of the grid, is more effective than the
traditional trap line for determining the presence of a subordinate rodent species, particularly when the subordinate species is present in much smaller numbers (Brown et al., 1996). However, in the present study, mice began to appear in the traps before the rat trapping rates had decreased.
Alternative explanations for catching mice on grids but not on lines are firstly, that although there was a higher proportion of mouse traps in areas with Muehlenbeckia australis on trap lines (12%) than on trap grids (7%), trap grids are more likely to cover a
higher proportion of such microhabitats. Secondly, mouse abundance and /or trappability changed more between the two trapping periods than did that of rats. However, in two previous New Zealand studies on mouse population ecology by kill trapping, in Woodhill State Forest near Auckland (Badan, 1979) and Mana Island near Wellington (Efford et al., 1988), mouse numbers started to increase after a low in summer and reach a peak in late autumn and early winter, declining afterwards. This suggests that, in our study, when the trapping grids were operated in August (late winter), mice numbers were unlikely to be higher than when the trap lines were set in June (early winter). Thirdly, small difference in average nightly mouse trapping rates between the two trials (0 mice 100 ctn-1vs. 0.2 mice 100 ctn-1) may have been an artefact of the limited trapping effort.
The greatest catch along trap lines occurred during all except night four of the first six nights of trapping. This result suggested that the commonly used three-night trapping session (Cunningham and Moors, 1993) should allow an adequate measure of relative rodent densities. However, it may not demonstrate the presence of a less abundant rodent. The highest trapping rate for rats within the trap grids occurred on the second and third nights, whereas the first mice were not caught until the third night. Hence the standard three-night session may not confirm the presence of small populations of a second rodent (in this case mice).
Future trapping to determine the presence and absence of rodents needs to take into account the inter-relationships between species when setting trapping regimes. The operation of traps, especially in grids, for periods exceeding three days is recommended as the most effective regime. In this study, the operation of trap grids for periods exceeding three days was better than trap lines for detecting mice. Further conclusions cannot be drawn from this study because of small sample sizes and lack of replication. However, our results indicated that the accuracy of existing information on the distribution of rodents, based on trap lines run for three days, could be questionable.
Traps set under three different trap covers returned significantly different catches. Traps with wire netting covers had a catch rate 2.5 times higher than the ones with the traditionally used galvanised iron covers. However, wire netting covers did not deter blackbirds. This catch of non-target species, potentially disastrous in areas with endangered species, made clear recommendation regarding optimal cover-type difficult.
At permanent bait stations, five different bait types tested showed that Norway rats had clear preferences. The natural longevity of each bait type Figure 6: Preference of rodents for different baits
should also be considered before use in monitoring. The most preferred bait types, cheese and chocolate, decay or melt rapidly if not eaten by rats. Soap, the next most preferred item, would be longer lasting if kept dry in a bait station, but waterproof galvanised iron covers reduced rat interaction with the bait inside. Candle wax and oiled wood are the most durable baits but were also the least favoured ones in this study.
Although the study showed that the conventional methods of rodent trapping and monitoring may be improved, more experiments are required before clear recommendations can be made. We suggest that similar trials in different areas, independent tests of efficiency of the different trap covers, and independent tests of bait preference would improve methods of rodent monitoring.
Acknowledgements
We thank Sandra Anderson for her assistance throughout the study, and Athol Gardner, Sarah Mackinnon, Ian Fraser, Berry Green and Renee Grove for their help with the field work. We appreciate the help from Dianne Brunton for advice on statistical analysis and John Ogden and Ewen Cameron for identification of plants. Kay Clapperton, Colin O’Donnell, Josh Salter and an anonymous referee provided considerable assistance with earlier drafts.
References
Allan, H. H. 1961. Flora of New Zealand, Volume 1. Government Printer, Wellington, N.Z. 1085 pp. Atkinson, I.A.E. 1978. Evidence for effects of
rodents on the vertebrate wildlife of New Zealand islands. In: Dingwall, P.R.; Atkinson, I.A.E.; Hay, C. (Editors), The ecology and control of rodents in New Zealand nature reserves, pp. 7-30. Department of Lands and Survey Information Series No 4, Wellington, N.Z.
Badan, D. 1979 (unpublished). The ecology of mice (Mus musculus L.) in two forests near
Auckland.MSc thesis, University of Auckland, Auckland, N.Z. 175 pp.
Bettesworth, D.J. 1972 (unpublished). Aspects of the ecology of Rattus norvegicus on Whale Island, Bay of Plenty, New Zealand. MSc thesis, University of Auckland, Auckland, New Zealand. 60 pp.
Bremner, A.G.; Butcher, C.F.; Patterson, G.B. 1984. The density of indigenous invertebrates on three
islands in Breaksea Sound, Fiordland, in relation to the distribution of introduced mammals.Journal of the Royal Society of New Zealand 14: 379-386.
Brown, K.P.; Moller, H.; Innes J.; Alterio, N. 1996. Calibration of tunnel tracking rates to estimate relative abundance of ship rats (Rattus rattus) and mice (Mus musculus) in a New Zealand forest.New Zealand Journal of Ecology 20: 271-275.
Clout, M.N. 1980. Ship rats (Rattus rattus L.) in a Pinus radiata plantation. New Zealand Journal of Ecology 3: 141-145.
Connor, H. E., Edgar, E. 1987. Name changes in the indigenous New Zealand flora, 1960-1986 and Nomina Nova IV, 1983-1986. New Zealand Journal of Botany 25: 115-170.
Cunningham, D.M.; Moors, P.J. 1993. Guide to the identification and collection of New Zealand rodents. 2nd edition. Department of Conservation, Wellington, N.Z. 16 pp.
Dowding, J.E.; Murphy, E.C. 1994. Ecology of ship rats (Rattus rattus) in a kauri (Agathis australis) forest in Northland, New Zealand. New Zealand Journal of Ecology 18: 19-27.
Efford, M.G.; Karl. B.J.; Moller, H. 1988.
Population ecology of Mus musculus on Mana Island, New Zealand. Journal of Zoology (London) 216: 539-563.
Esler, A.E. 1974 (unpublished). Browns Island. Botany Division, Department of Science and Industrial Research, Auckland, N.Z. 12 pp. Hickson, R.E.; Moller, H.; Garrick, A.S. 1986.
Poisoning rats on Stewart Island. New Zealand Journal of Ecology 9: 111-121.
McCallum, J. 1986. Evidence of predation by kiore upon lizards from the Mokohinau Islands. New Zealand Journal of Ecology 9: 83-88.
Miller, C.J.; Miller, T.K. 1995. Population dynamics and diet of rodents on Rangitoto Island, New Zealand, including the effect of a 1080 poison operation.New Zealand Journal of Ecology 19: 19-27.
Moors, P.J. 1983. Predation by mustelids and rodents on eggs and chicks of native and introduced birds in Kowhai Bush, New Zealand. Ibis 125: 137-154.
Nelson, L.; Clark, F.W. 1973. Correction for sprung traps in catch/effort calculations of trapping results.Journal of Mammalogy 54: 295-298. SAS Institute 1990. SAS/STAT User’s guide, version
6.SAS Institute, Cary, North Carolina, U.S.A. 1028 pp.
Stubbs, A. 1996 (unpublished). Management and recommendation for the ecological
University of Auckland, Auckland, N.Z. 199 pp.
Taylor, R.H.; Thomas, B.W. 1989. Eradication of Norway rats (Rattus norvegicus) from Hawea Island, Fiordland, using brodifacoum. New Zealand Journal of Ecology 12: 23-32. Taylor, R.H.; Thomas, B.W. 1993. Rats eradicated
from rugged Breaksea Island (170ha), Fiordland, New Zealand. Biological Conservation 65: 191-198.
Veitch, C.R. 1995. Habitat repair: a necessary prerequisite to translocation of threatened birds. In: Serena, M. (Editor), Reintroduction biology of Australian and New Zealand fauna, pp. 97-104. Surrey Beatty & Sons, Chipping Norton, U.K.
Veitch, C.R.; Bell, B.D. 1990. Eradication of introduced mammals from the islands of New Zealand.In: Towns, D.R.; Daugherty, C.H.; Atkinson, I.A.E. (Editors), Ecological Restoration of New Zealand Islands. pp. 137-143. Conservation Sciences Publication No. 2, Department of Conservation, Wellington, N.Z. Whitaker, A. H. 1978. The effects of rodents on