I
I
n
n
t
t
e
e
r
r
n
n
a
a
t
t
i
i
o
o
n
n
a
a
l
l
J
J
o
o
u
u
r
r
n
n
a
a
l
l
o
o
f
f
B
B
i
i
o
o
l
l
o
o
g
g
i
i
c
c
a
a
l
l
S
S
c
c
i
i
e
e
n
n
c
c
e
e
s
s
2012; 8(6):802-810. doi: 10.7150/ijbs.4438Research Paper
Structural Dynamics and Epigenetic Modifications of
Hoxc
Loci along the
Anteroposterior Body Axis in Developing Mouse Embryos
Hyehyun Min
*, Ji-Yeon Lee
*, Myoung Hee Kim
Department of Anatomy, Embryology Laboratory, Brain Korea 21 project for Medical Science, Yonsei University College of Medicine, Seoul 120-752, Korea.
* These authors contributed equally to this work.
Corresponding author: E-mail: [email protected]. Tel: +82-2-2228-1647, Fax: +82-2-365-0700
© Ivyspring International Publisher. This is an open-access article distributed under the terms of the Creative Commons License (http://creativecommons.org/ licenses/by-nc-nd/3.0/). Reproduction is permitted for personal, noncommercial use, provided that the article is in whole, unmodified, and properly cited.
Received: 2012.04.04; Accepted: 2012.06.03; Published: 2012.06.06
Abstract
Hox genes are organized as clusters and specify regional identity along the anteroposterior body axis by sequential expression at a specific time and region during embryogenesis. However, the precise mechanisms underlying the sequential spatio-temporal, collinear ex-pression pattern of Hox genes are not fully understood. Since epigenetic modifications such as chromatin architecture and histone modifications have become crucial mechanisms for highly coordinated gene expressions, we examined such modifications. E14.5 mouse embryos were dissected into three parts along the anteroposterior axis: brain, trunk-anterior, and trunk-posterior. Then, structural changes and epigenetic modifications were analyzed along the Hoxc cluster using chromosome conformation capture and c
hromatin i
mmunoprecipi-tation-PCR methods. Hox non-expressing brain tissues had more compact, heterochroma-tin-like structures together with the strong repressive mark H3K27me3 than trunk tissues. In the trunk, however, a more loose euchromatin-like topology with a reduced amount of H3K27me3 modifications were observed along the whole cluster, regardless of their potency in gene activation. The active mark H3K4me3 was rather closely associated with the collinear expression of Hoxc genes; at trunk-anterior tissues, only 3' anterior Hoxc genes were marked by H3K4me3 upon gene activation, whereas whole Hoxc genes were marked by H3K4me3 and showed expression in trunk-posterior tissues. Altogether, these results indicated that loosening of the chromatin architecture and removing H3K27me3 were not sufficient for, but rather the concomitant acquisition of H3K4me3 drove the collinear expression of Hoxc genes.Key words: anteroposterior body axis; chromatin architecture; histone modification; collinear ex-pression; Hoxc cluster
Introduction
Hox genes encode a highly conserved family of homeodomain-containing transcription factors that play a pivotal role in specifying positional identity along the anteroposterior (AP) body axis during em-bryogenesis [1, 2]. In mammals, 39 Hox genes are or-ganized in four clusters (HoxA, -B, -C, and -D) and are transcribed sequentially depending on their relative positions within the genomic clusters. Genes located more in the 3’ region are expressed earlier and more
anteriorly than those located more in the 5’ region of the cluster. This collinear expression of the Hox gene is essential for providing correct positional identity to the developing embryo at the right time [3].
Epigenetic modifications in histones have been suggested in the mechanism underlying collinear Hox gene expression [4]. Since then, Polycomb-group (PcG) and Trithorax-group (TrxG) proteins, initially identified in Drosophila as epigenetic regulators of the
Ivyspring
homeotic genes, have also been revealed to control the collinear expression of Hox genes in mammals [5, 6]. PcG proteins are generally considered to maintain their target genes in a transcriptionally-inactive state by catalyzing histone H3K27 trimethylation (H3K27me3), while TrxG proteins antagonize the ac-tion of PcG proteins and activate target genes by in-ducing histone H3K4 trimethylation (H3K4me3). Several in vitro studies have shown such correlations between the histone modifications and transcriptional activities of target promoters in embryonic stem (ES) cells, as well as in other types of tissue culture cells [7-10]. In the case of Hox genes, sequential activation of Hoxd genes has been associated with the distribu-tion of H3K4me3 and H3K27me3 histone marks in developing mouse tail buds, suggesting that succes-sive Hox gene activation along the cluster was associ-ated with the directional and progressive transition of histone modifications as well as that the clustered organization was necessary for the successive collin-ear expression of Hox genes [11].
Meanwhile, spatial chromatin organization has been shown to be critical in controlling gene expres-sion and dynamically changed upon gene activation [12, 13]. Chambeyron et al. have shown the chromatin decondensation and nuclear reorganization of the Hoxb locus during mouse embryonic development using fluorescence in situ hybridization (FISH) tech-nique [14, 15]. The development of chromosome con-formation capture (3C) technology has made it possi-ble to measure physical contacts between specific genomic DNA segments [16]. So far, several groups have applied the 3C-based technique to prove chro-mosome conformational changes upon Hox gene ex-pression in vitro [17, 18] and in vivo [19].
The purpose of this study was to investigate the epigenetic status which appears to be required for the maintenance of collinear Hox gene expression patterns along the AP axis throughout embryogenesis. To ad-dress this issue, we examined whether histone modi-fications and chromosomal conformation changes are indeed associated with the collinear expression of Hox genes in vivo using developing mouse embryos. We divided E14.5 mouse embryos into three parts along its AP body axis and analyzed the dynamics of the spatial configuration and histone modifications using 3C and Chromatin immunoprecipitation (ChIP)-PCR techniques.
Materials and methods
Animal preparation
E14.5 embryos were collected by crossing ICR:CD1×ICR:CD1 mice. The day when the vaginal
plug was detected was defined as 0.5 days postcoitum (dpc) and E0.5 embryo. After 14 days, the pregnant female mice were euthanized, and then the E14.5 embryos were dissected free of the maternal and ex-traembryonic tissues in cold-PBS on ice. Each em-bryonic body was divided into the brain, trunk-anterior, and trunk-posterior after removing the internal organs and tail bud. The samples were properly preserved for RNA or chromatin prepara-tion. E11.5 embryos were also prepared as described previously [20, 21] and used for gene expression analysis. Experimental procedures were approved by the Animal Care and Use Committee of Yonsei Uni-versity College of Medicine.
RNA isolation and RT-PCR
Total RNA was isolated from the freshly dis-sected E14.5 embryos using the Trizol reagent (Invi-trogen, Carlsbad, CA, USA). Reverse transcription (RT) was performed with 1 μg of RNA using the Im-Prom-llTM Reverse Transcriptase (Promega, Madison,
WI, USA). PCR was performed in triplicate using the G Taq polymerase (Cosmogenetech, Seoul, Korea). PCR amplification was performed under the follow-ing conditions: the initial denaturation for 5 min at 94°C, and then 30 cycles of 94°C for 30 sec, 58°C for 30 sec and 72°C for 1 min. At least three independent biological replicates were analyzed. All PCR primers used for detecting Hox gene expression levels were the same as described previously [22]. A noncoding RNA AK035706 was amplified using a forward pri-mer (5'-GAC ACA CAA ATT GGC TTC TGA C-3') and a reverse primer (5'-AAG GGG TGG ACA GTG ATC TG-3'). The β-actin primer sequence was previ-ously described by Lee et al. [23]. For the quantifica-tion, the Multi Gauge V3.0 software (Fuji, Tokyo, Ja-pan) was used.
Chromatin immunoprecipitation (ChIP)-PCR
For ChIP analysis with mouse embryonic tissues, the X-ChIP protocol from Abcam was applied with minor modifications. Embryonic samples were cross-linked with 1% formaldehyde diluted in the serum-free Dulbecco’s modified Eagle’s medium(WelGENE Inc., Daegu, Korea) for 10 min at room temperature. The crosslinking reaction was stopped with 0.125 M Glycine for 5 min and then washed three times with PBS at room temperature. The cells (4×10⁷)
were lysed for 10 min on ice in 600 μl of sodium do-decyl sulfate (SDS) lysis buffer and then were soni-cated with 30 sets of 10-sec pulses by a VibracellTM
sonicator (VCX130, Sonics & Materials Inc., Newton, CT, USA) to obtain the average DNA size of 500 –
DNA/protein A/G agarose beads (Santa Cruz, CA, USA) and 1 to 2 µg of antibodies was incubated over-night at 4°C. The following day, bound complexes were washed and eluted from the beads and were purified using a PCR purification kit (Cosmogenetech, Seoul, Korea). PCR amplification of the immunopre-cipitated DNA fragments was performed by incuba-tion for 5 min at 95°C, followed by 32 cycles of 30 sec at 95°C, 30 sec at 58°C, and 30 sec at 72°C. The PCR primer sequences are shown in Supplementary Mate-rial: Table S1.
Chromosome conformation capture (3C)
The 3C assay was performed as described pre-viously [16] with minor modifications. For each set of experiments, cells from the fetal brains, fetal trunk-anterior and trunk-posterior tissues (approxi-mately 4x10⁷ cells) were passed through a cell-strainer(40 μM, SPL Lifesciences, Korea) to obtain a hom o-geneous single cell suspension. Formaldehyde (37%, Biosesang, Korea) was added (1% final) and the sam-ples were crosslinked for 10 min at room temperature. The reaction was quenched by the addition of glycine (0.125 M final). The cells were harvested, washed with PBS, and lysed in 5 ml of ice-cold lysis buffer (10 mM Tris-Cl [pH 8.0], 10 mM NaCl, 0.2% NP-40 [pH 8.0]) containing complete protease inhibitors (Roche, Basel, Switzerland). Isolated nuclei were washed with an appropriate restriction buffer and were resuspended in the same buffer (0.5 ml per 1 x 10⁷ cells) containing
0.3% SDS and incubated for 1 hr at 37°C with shaking. Triton X-100 was added (1.8% final), and then the nuclei were further incubated for 1 hr at 37°C to get rid of SDS. The crosslinked DNA was digested over-night with the restriction enzyme Hindlll (400 U per 1 x 10⁷ cells, TAKARA, Shiga, Japan). An aliquot of
DNA was collected before and after the digestion to determine the digestion efficiency. The restriction enzyme was inactivated by adding SDS (1.6% final) and incubating at 65°C for 20 min. The reaction was diluted with a ligase buffer (50 mM Tris-Cl [pH 7.5], 10 mM MgCl2, 10 mM DTT, and 1mM ATP). Triton
X-100 was added (1% final) and then the samples were incubated for 1 hr at 37°C. The DNA was ligated with T4 ligase (TAKARA 8,000 cohesive-end unit) for 4 hr at 16°C and then for 30 min at room temperature. Proteinase K was added, and the samples were incu-bated overnight at 65°C to reverse the crosslinks. The following day, the samples were incubated for 30 min
at 37°C with 30 μl of RNaseA (10 mg/ml), and then the DNA was purified by phenol/chloroform extrac-tion and ethanol precipitaextrac-tion. The DNA concentra-tion was carefully determined using a Nanodrop spectrophotometer. Mouse BAC clones carrying Hoxc
cluster genes (RP24-459N19 from CHORI BACPAC) were used as the 3C control templates. BAC DNA (2 μg) was digested with HindIII and religated so that a collection of all possible ligation products were pre-sent in equimolar amounts.
PCR analysis of the 3C templates
To determine the digestion efficiency of each 3C template, aliquots of undigested and digested sam-ples were decrosslinked, and DNA was isolated using phenol/chloroform extraction followed by ethanol precipitation. For assessing the digestion efficiency, 100 ng of the isolated DNA was used as a template. PCR was performed using the h-taq polymerase (Solgent, Seoul, Korea) under the following condi-tions: the initial denaturation for 5 min at 95°C, and then 26 cycles of 95°C for 30 sec, 58°C for 30 sec, and 72°C for 1 min. We introduced a touchdown PCR method to detect a genomic band from a combination of cP series primers. The PCR cycle consisted of initial denaturation for 3 min at 95°C, 10 cycles of touch-down PCR, wherein the beginning annealing tem-perature of 67°C was decreased by 0.5°C per cycle for 10 cycles with extension at 72°C for 30 sec; denatura-tion at 95°C for 1 min; and the following 40 cycles were at 95°C for 1 min, 62°C for 20 sec, and 72°C for 30 sec. The resulting PCR products were analyzed by conventional agarose gel electrophoresis. For quanti-fication, Multi Gauge V3.0 software was used. The sequences of all the PCR primers in Hoxc loci have been reported previously [24]. 3C PCR quality was verified by measuring the compaction of the gene desert control region (Chr15: 102,650,000-102,870,000). 3C interaction frequencies in the Hoxc cluster was normalized by calculating the average value of con-tacts with the corresponding gene desert in each 3C templates. The primer sequences in the gene desert region were shown in Supplementary Material: Table S2.
3C efficiency control
The 3C efficiency control test was performed as described previously [17] with minor modification. In brief, the beta-actin locus was chosen to perform the 3C efficiency control. The frequency of crosslinking of the HindIII genomic fragment containing the be-ta-actin gene to its adjacent upstream HindIII frag-ment was quantified (Supplefrag-mentary Material: Fig. S1). First, a 25 cycle PCR was performed on the 3C templates using the primers ActNestA:
5’-ACTTAGGTGTACCTGTGTGTGCCT-3’ and
ActAdj: 5’-AGCAGTGGTTTCTATTGGCTGTCG-3’.
94°C; 20 sec at 94°C, 30 sec at 60°C, 1 min at 72°C for 25 cycles. 3C PCR was performed on 1/100 of this first amplification using the nested primer ActA:
5’-CTTCTGACCTAGAACTCTTGATCCC-3’ and the
ActAdj primer using the same PCR conditions, except for the number of cycles: 2 min at 94°C; 20 sec at 94°C, 30 sec at 60°C, 1 min at 72°C for 35 cycles. To compare the 3C signal of the genomic HindIII fragment con-taining the beta-actin gene in the different samples, PCR was performed using 3C templates of mouse tissues with the primers ActA and ActB:
5’-CCCTCTACACACACTCAGAATTCATC-3’. This PCR amplified fragments located within the HindIII genomic fragment containing the beta-actin gene. The resulting PCR products were analyzed by conven-tional agarose gel electrophoresis. For quantification, the Multi Gauge V3.0 software was used. This cross-linking efficiency was used to normalize the signal representing the crosslinking of the HindIII genomic fragment containing the beta-actin gene to its adjacent fragment located immediately upstream in the
dif-ferent 3C template.
Results
Spatial collinear expression of Hox genes along
the AP body axis in developing mouse
em-bryos
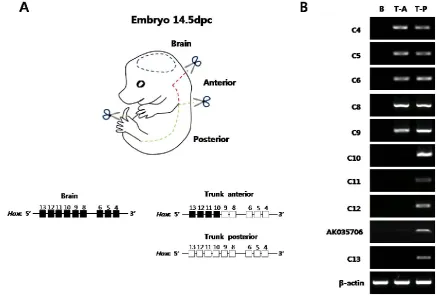
Before examining the histone modification status and the architectural organization of the chromo-somes of Hox loci in vivo, the collinear expression patterns of Hox genes were examined in mouse em-bryos. The E14.5 embryos were divided into three parts (brain, trunk-anterior, and trunk-posterior) and then were subjected to semi-quantitative RT-PCR for the genes in the Hoxc cluster (Fig. 1A). Internal organs, limbs, and tail buds were removed to focus on the Hox machinery in the main body axis of the embryos. As shown in Fig. 1B, distinct expression patterns of Hoxc genes were observed in the brain, trunk-anterior, and trunk-posterior tissues. In the brain tissues, none of the Hoxc gene was expressed (Fig. 1B).
The trunk-anterior tissues expressed only the anterior genes (Hoxc4 to Hoxc9) located in the 3’ re-gion of the cluster. The trunk-posterior tissues ex-pressed posterior genes (Hoxc10 to Hoxc13) located in the 5’ region of the cluster together with the anterior genes. A noncoding RNA, AK035706, located in be-tween Hoxc12 and -c13 was also expressed in a col-linear expression manner with respect to its position in the cluster (Fig. 1B). In addition to the Hoxc genes, other Hox genes located in the Hoxa, Hoxb, and Hoxd clusters showed similar expression patterns (Sup-plementary Material: Fig. S2A). These results con-firmed the spatial collinear expression of Hox genes along the AP body axis, so that the genes located near the 3’ end of the cluster were expressed more anteri-orly than the genes located near the 5’ end.
Histone modifications of Hoxc loci in
devel-oping mouse embryos
Since it was confirmed that Hox genes were dif-ferentially expressed along the AP body axis in E14.5
mouse embryos, next we asked whether the chroma-tin isolated from the three embryonic tissues (brain, trunk-anterior, trunk-posterior) have different epige-netic modifications in histones. We first validated the ChIP protocol by performing a control assay using primers specific for the promoter region of the GAPDH gene constitutively expressed in most cell types. As expected, the GAPDH promoter region was enriched with the active chromatin mark H3K4me3 in all three body tissues, while the inactive chromatin mark H3K27me3 was not detected (Supplementary Material: Fig. S3).
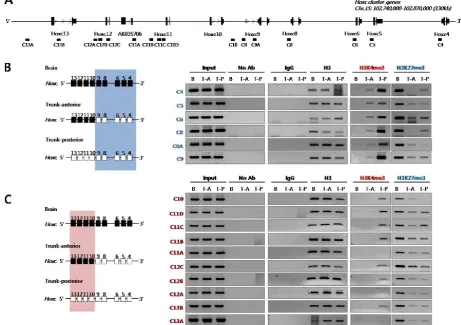
Next, we examined histone modifications in the Hoxc loci using PCR primers designed to amplify ge-nomic regions across the Hoxc cluster (Fig. 2A). As shown in Fig. 2B, the inactive chromatin mark H3K27me3 was strongly enriched across the Hoxc loci tested in the brain tissues where Hox genes were not expressed.
However, the level of H3K27me3 was signifi-cantly reduced in the trunk tissues (both trunk-anterior and -posterior tissues), regardless of whether the genes were activated or not. In the case of the active chromatin mark H3K4me3, the chromatin isolated from the anterior trunk region where the 3’-located anterior Hoxc genes (Hoxc4 to Hoxc9) were expressed had such modification only in the anterior genes tested, but not in the posterior Hoxc genes (Hoxc10 to Hoxc13) (Fig. 2B). On the contrary, the trunk-posterior tissues where all Hoxc genes were expressed were highly modified with the active mark H3K4me3 across most of the Hoxc loci tested. The deposition of the active chromatin mark H3K4me3 was not found in the brain which did not express any Hox genes (Fig. 2B). All ChIP-PCR values were nor-malized for histone H3 occupancy (Supplementary Material: Table S3). These results suggest not only that the loss of the H3K27me3 mark both in trunk-anterior and -posterior tissues might contribute to the ready state for activation, but also that the H3K4me3 mark could be a crucial signal for returning it to a fully eu-chromatic chromatin state.
Chromatin organization of the Hoxc cluster in
mouse embryonic brain and trunk tissues
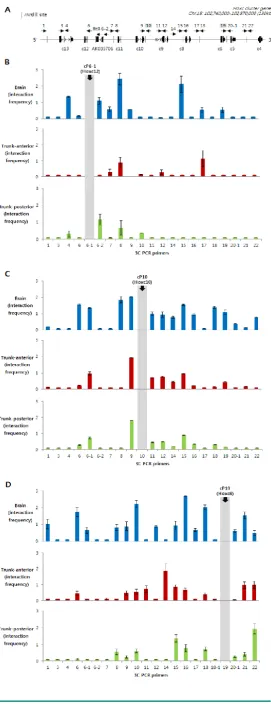
To see whether the histone modifications ob-served in developing embryos were associated with the chromosomal structures, in respect to Hox gene expression, the 3C technique was applied using the same embryonic tissues (brain, trunk-anterior and trunk-posterior tissues). After fixing the tissues with formaldehyde, the crosslinked chromosomal DNAs in their original architecture were digested with HindIII restriction endonuclease to separate non-crosslinked DNA from crosslinked chromatin. After in-tra-molecular ligation, interaction frequencies be-tween anchor/bait and other HindIII fragments were determined by 3C-PCR throughout the Hoxc locus, and then normalized with those analyzed with BAC DNA containing the entire Hoxc cluster and a gene desert region (see Materials and Methods). The posi-tion of each primer used for 3C-PCR is shown in Fig. 3A along with the schematic map of the Hoxc cluster.
3C PCR was performed with three different an-chor primers: cP6-1, which is located between Hoxc11 and Hoxc12; cP10, which is between Hoxc9 and Hoxc10; and cP19, which is between Hoxc5 and Hoxc6. Especially, the cP10 anchor primer was designed in the boundary region dividing the actively expressed (Hoxc4 to Hoxc9) and non-expressed genes (Hoxc10 to Hoxc13) in the trunk-anterior tissues (Fig. 1B and 3B).
The Hoxc loci in the chromatin isolated from the Hox non-expressing brain tissues (enriched with H3K27me3, Fig. 2B) showed high interaction fre-quencies with different genomic regions across the Hoxc cluster (Fig. 3A-C). In contrast, regardless of whether the anchor primer was located in the region of active genes or not, the trunk-anterior tissues showed much lower interaction frequencies, and so did the trunk-posterior tissues. These results may imply that brain has a more compact structure than the trunk region. The 3C-PCR results, however, did not show any significant differences between the trunk-anterior and trunk-posterior tissues within the Hoxc cluster. We therefore concluded that loosening of the chromatin structure might be important to maintaining a transcriptionally ready state in trunk tissues, but the concomitant acquisition of histone marks, such as H3K4me3, at specific loci might permit collinearity of Hox gene expression.
Discussion
We have shown that spatial collinear Hox gene expression in developing embryos is accompanied by changes in spatial organization and histone modifica-tion. Our results have shown that the brain tissues that never express Hox genes during development have a heterochromatin-like condensed chromatin. In the trunk tissues, however, structural changes make the chromatin loose and transcriptionally poised, and then accompanying histone modifications at the ap-propriate loci along the AP axis allow them to be ac-tivated sequentially.
Figure 3. Identification of intra-chromosomal interac-tions in Hoxc loci in brain and trunk tissues. (A) A sche-matic presentation of the Hoxc cluster on chromosome 15. A linear diagram of the Hoxc gene cluster shows the po-sition of 3C primers (cP with a dotted arrow with its head pointing to the 5’ direction) as well as HindIII restriction sites (dotted vertical lines). (B-D) Chromatin structural changes at Hoxc genomic loci were measured in the brain (blue), as well as anterior (red) and posterior (green) trunk tissues. The y-axis indicates the normalized interaction frequency. The x-axis shows the primer number as shown in (A). The position of anchor primers cP6-1 (B), cP10 (C) and cP19 (D) were indicated in gray color. Interaction frequencies represent the average of the three inde-pendent PCRs.
loops when transcriptionally inert in the brain tissues, probably because of a need to avoid temporally or spatially irrelevant expression of Hox genes during development. In contrast, our results showed that the looping structure was relatively rare in the trunk tis-sues, regardless of whether they originated from the posterior or anterior region. It is not clear from our model whether the chromosomal compartment for the active genes are separated from the domain of inac-tive genes, as shown in the data from Noordermeer et al. [19]; however, we partly agree with this view, as a result of our experiments with the ‘cP19’ anchor pri-mer. This primer, which is located near Hoxc6 and transcriptionally active in trunk tissues, more fre-quently interacted with other genomic regions within the anterior genes (Hoxc4 to Hoxc9), which are active in trunk-anterior tissues, compared to the inactive posterior genes (Hoxc10 to Hoxc13). Obviously, it is evident that this association was stronger in brain tissues. Taken together, our results suggest that a local loosening of the chromatin structure might be func-tionally important to establishing the transcripfunc-tionally competent chromatin status.
Although topological changes of chromatin are a common feature in gene regulation [17, 25-31], the role of other epigenetic changes such as histone mod-ifications must be taken into account in order to un-derstand the delicate nature of gene regulation. Our in vivo data revealed that combinatorial modification pattern of H3K27me3 and H3K4me3 along the Hoxc cluster in trunk seemed to provide an important functional link between chromatin remodeling and the establishment of transcriptional competency. Ac-cording to the previous reports [11,19], H3K27me3 seemed to disappear upon gene activation, although there were small regions slightly overlapping with transcriptionally active regions. In contrast, our data proved that H3K27me3 broadly defines transcrip-tionally competent portions of the genome, regardless of whether the regions are transcriptionally active or not. We might also consider the possibility that the expression boundary of Hoxc genes in trunk tissues, which is normally determined epigenetically, is less strict compared to other Hox clusters, i.e., Hoxa, Hoxb, and Hoxd. Supportingly, the correlation of H3K27me3 marks with Hoxc gene expression levels in a previous study using E10.5 mouse tissues [19] was not strong enough to achieve consistent results across four dif-ferent Hox clusters. Another possibility is that some-what different levels of epigenetic programs might drive the maintenance of Hox gene expression at a given stage. Altogether, our data suggest that re-moving the inactive chromatin mark H3K27me3 alone is not sufficient to induce gene expression, but
ac-quiring H3K4me3 provides epigenetic marks for driving spatial collinear expression of Hox genes.
These results were in agreement with a recent study that examined epigenomic reorganization of Hox genes in mouse ES cells [32]. Their results showed that the placing of H3K4me3 activating marks and inducing transcription precede complete erasure of H3K27me3 [32]. Together with our data, these results indicate that the complete removal of H3K27me3 was not necessary to initiate Hox transcription. Our results show that both H3K4me3 and H3K27me3 marks are examined at the same locus in trunk tissues, however, it is not easy to say exactly whether bivalent modifi-cation is correlated with gene activation, since the embryonic cells used in this study were heterogene-ous and therefore the ChIP results are probably the summation of the state that was from many different types of cells located in a certain region. Hence, we cannot distinguish whether the chromatin was biva-lently modified or monovabiva-lently marked with either H3K4me3 or H3K27me3 at this moment.
Previously, chromatin decondensation and nu-clear reorganization upon induction of mouse Hoxb and -d genes have been reported in ES cells as well as in embryos [14, 15, 33]. The progressive looping of the genes from the chromosome territory along the AP axis in developing neural tube was coherent with the collinear sequential expression of Hox genes. Alt-hough the cells we used in this study were not only from the neural tube but also from most of the ecto-derm- and mesoecto-derm-derived tissues in the later stages of the embryos (E14.5), decondensation of Hox cluster seems to occur in trunk tissues, compared to those in the Hox non-expressing brain tissues.
In conclusion, we propose here that collinear Hox gene expression patterns along the AP axis estab-lished during early embryogenesis are strictly main-tained while the process of organogenesis is com-pleted. This is accomplished by cooperation between histone modifications and chromosome conforma-tional changes. Our findings provide a good clue as to how Hox genes display spatially restricted patterns of expression in embryos at a fixed time point.
Supplementary Material
Table S1 - S3 and Figure S1 - S3.
http://www.biolsci.org/v08p0802s1.pdf
Acknowledgments
the National Research Foundation (NRF) and in part by 20070401-034-030 from the BioGreen21 Program, Rural Development Administration (RDA), Korea.
Competing Interests
The authors have declared that no competing interest exists.
References
1. McGinnis W and Krumlauf R. Homeobox genes and axial patterning. Cell 1992; 68: 283-302.
2. Krumlauf R. Hox genes in vertebrate development. Cell 1994; 78: 191-201.
3. Kmita M, van Der HF, Zakany J, et al. Mechanisms of Hox gene colinearity: transposition of the anterior Hoxb1 gene into the posterior HoxD complex. Genes & Development 2000; 14: 198-211.
4. Soshnikova N and Duboule D. Epigenetic regulation of Hox gene activation: the waltz of methyls. BioEssays 2008; 30: 199-202.
5. Soshnikova N and Duboule D. Epigenetic regulation of vertebrate Hox genes: a dynamic equilibrium. Epigenetics 2009; 4: 537-40.
6. Margueron R and Reinberg D. The Polycomb complex PRC2 and its mark in life. Nature 2011; 469: 343-349.
7. Bernstein BE, Kamal M, Lindblad-Toh K, et al. Genomic Maps and Comparative Analysis of Histone Modifications in Human and Mouse. Cell 2005; 120: 169-181.
8. Bracken AP, Dietrich N, Pasini D, et al. Genome-wide mapping of Polycomb target genes unravels their roles in cell fate transitions. Genes & Development 2006; 20: 1123-1136.
9. Barski A, Cuddapah S, Cui K, et al. High-resolution profiling of histone methylation in the human genome. Cell 2007; 129: 823-837.
10. Lee TI, Jenner RG, Boyer LA, et al. Control of Developmental Regulators by Polycomb in Human Embryonic Stem Cells. Cell 2006; 125: 301-313. 11. Soshnikova N and Duboule D. Epigenetic temporal control of mouse
Hox genes in vivo. Science 2009; 324: 1320-3.
12. Fraser P and Bickmore W. Nuclear organization of the genome and the potential for gene regulation. Nature 2007; 447: 413-417.
13. Gondor A and Ohlsson R. Chromosome crosstalk in three dimensions. Nature 2009; 461: 212-217.
14. Chambeyron S and Bickmore WA. Chromatin decondensation and nuclear reorganization of the HoxB locus upon induction of transcription. Genes & Development 2004; 18: 1119-1130.
15. Chambeyron S, Da Silva NR, Lawson KA, et al. Nuclear re-organisation of the Hoxb complex during mouse embryonic development. Development 2005; 132: 2215-2223.
16. Dekker J, Rippe K, Dekker M, et al. Capturing Chromosome Conformation. Science 2002; 295: 1306-1311.
17. Würtele H and Chartrand P. Genome-wide scanning of HoxB1-associated loci in mouse ES cells using an open-ended Chromosome Conformation Capture methodology. Chromosome Research 2006; 14: 477-495.
18. Fraser J, Rousseau M, Shenker S, et al. Chromatin conformation signatures of cellular differentiation. Genome Biology 2009; 10: R37. 19. Noordermeer D, Leleu M, Splinter E, et al. The Dynamic Architecture of
Hox Gene Clusters. Science 2011; 334: 222-225.
20. Ruthala K, Gadi J, Lee J-Y, et al. Hoxc8 downregulates Mgl1 tumor suppressor gene expression and reduces its concomitant function on cell adhesion. Molecules and Cells 2011; 32: 273-279.
21. Min H, Lee J-Y, Bok J, et al. Proliferating cell nuclear antigen (Pcna) as a direct downstream target gene of Hoxc8. Biochemical and Biophysical Research Communications 2010; 392: 543-547.
22. Yu SJ, Lee J-Y, Kim SH, et al. Synthetic maternal stress hormone can modulate the expression of Hox genes. J. Exp. Biomed. Sci 2009; 15: 249-255.
23. Lee J-Y, Khan A, Min H, et al. Identification and characterization of a noncoding RNA at the mouse Pcna locus. Molecules and Cells 2012; 33: 111-116.
24. Lee J-Y, Min H, Wang X, et al. Chromatin organization and transcriptional activation of Hox genes. Anat Cell Biol 2010; 43: 78-85. 25. Ferraiuolo MA, Rousseau M, Miyamoto C, et al. The three-dimensional
architecture of Hox cluster silencing. Nucl. Acids Res. 2010; 38: 7472-7484.
26. Tolhuis B, Palstra R-J, Splinter E, et al. Looping and Interaction between Hypersensitive Sites in the Active [beta]-globin Locus. Molecular Cell 2002; 10: 1453-1465.
27. Spilianakis CG and Flavell RA. Long-range intrachromosomal interactions in the T helper type 2 cytokine locus. Nat Immunol 2004; 5: 1017-1027.
28. Tiwari VK, McGarvey KM, Licchesi JDF, et al. PcG Proteins, DNA Methylation, and Gene Repression by Chromatin Looping. PLoS Biol 2008; 6: e306.
29. Hakim O, John S, Ling JQ, et al. Glucocorticoid Receptor Activation of the Ciz1-Lcn2 Locus by Long Range Interactions. J. Biol. Chem. 2009; 284: 6048-6052.
30. Sexton T, Bantignies F, and Cavalli G. Genomic interactions: Chromatin loops and gene meeting points in transcriptional regulation. Seminars in Cell & Developmental Biology 2009; 20: 849-855.
31. Ktistaki E, Garefalaki A, Williams A, et al. CD8 Locus Nuclear Dynamics during Thymocyte Development. J Immunol 2010; 184: 5686-5695. 32. Kashyap V, Gudas LJ, Brenet F, et al. Epigenomic reorganization of the
clustered Hox genes in embryonic stem cells induced by retinoic acid. J Biol Chem 2011; 286: 3250-60.