Address for correspondence
ICAR-National Institute of Agricultural Economics and Policy Research, New Delhi, India
E-mail: rajni.jain@icar.gov.in Access this article online Publisher Website:
http://www.ndpublisher.in
DOI: 10.5958/0976-4666.2016.00068.1 ©2016 New Delhi Publishers. All rights reserved
Farm level technical efficiency for pulse production in India
Rajni Jain
1, Sonia Chauhan
1, S.K. Srivastava
1, Kingsley I.T.
1, S.S. Raju
2,
Jaspal Singh
1and Amrit Pal Kaur
1 1ICAR-National Institute of Agricultural Economics and Policy Research, New Delhi, India 2ICAR-Central Marine Fisheries Research Institute, Regional Centre, Visakhapatnam, IndiaABSTRACT
Pulses are complementary to cereals both in production as well as in consumption. During the production process, pulses help in improving sustainability by (i) fixing the atmospheric nitrogen into the soil (ii) consuming less water and (iii) controlling diseases and pests. On consumption front, pulses reduce malnutrition and improve human health being a rich and most viable source of protein for vegetarians and poor people. Realizing the importance of pulses, the government of India announces various schemes and programs from time to time to promote the cultivation of pulses in the country. However, pulse production in India has not achieved the targeted level. The paper analyses the production trend of pulses over the last decade and identifies the gap between the targets and achievements. Plot level data from cost of cultivation scheme across major pulses growing states has been used to estimate technical efficiencies of the pulses using data envelopment analysis. The paper also highlights the yield gap of the pulses across major pulse growing states and suggests suitable measures for improving farm level profitability and sustainability by increasing technical efficiency. The study postulated the hypothesis that technical efficiency of the pulses is low and the yield potential of the pulses are not fully harnessed. The results revealed that increase of technical efficiency by 1% will reduce the yield gap by 9 kg per ha and increase total pulse production of the country by 225 thousand tons.
Keywords: Pulses, technical efficiency, data envelopment analysis, cost of cultivation
Pulse crops have been an important component of agriculture since ancient times. Pulses are complementary to cereals production as biological nitrogen fixation of pulses contributes at least four
India is the largest producer, consumer and processor of the pulses in the world (Srivastava et. al., 2010). The position of India in the world market of pulses is rather peculiar (Mruthyunjaya, 1997). Though in quantity term, its position is dominant, yet the country is in short supply of pulses by 2-3 mt per annum. The domestic production of pulses has been hovering between 13 to 19 mt which is coming from 23 to 25 million hectare area. Notwithstanding, the pulses production in India increased from 13.12 million tonnes (mt) during 2004-05 to 19.25 mt during 2013-14. However, inspite of increasing pulses production during the recent years, gap between demand and supply is expected to widen in coming years (IIPR, 2013).
If the population continues to grow at the rate of 1.4% per annum then the demand for pulses is estimated as 39 mt for 1.69 billion population by the year 2050 (IIPR, 2013). Thus, an increase in production of about 0.6 mt per annum will be required to meet the projected demand for pulses. Consequently, both the yield and area under pulses need to be raised to about 1200 kg per ha and 3-5 million ha respectively. However, as the scope of area expansion under pulses is limited, a paradigm shift in research and technology dissemination is required to increase the pulse production (IIPR, 2013). Inefficiency
in crop production is considered as one of the major
factors hindering the exploitation of full potential of the
innovated technologies (Sekhon et al., 2010). Therefore, it is pertinent to examine the existing level of technical efficiency and estimate the yield which can be increased by improving production efficiency. The study postulated the hypotheses that technical efficiency of the pulses is low and the yield potential of the pulses are not fully harnessed.
Data and Methodology
The study is based on the unit-level data collected under “Comprehensive Scheme for Cost of Cultivation (CCS) of Principal Crops” of Directorate of Economics and Statistics, Ministry of Agriculture and Farmers Welfare, Government of India for the year 2012-13 for all major pulse growing states. The study covered major pulses viz., red-gram, bengal-gram, lentil, green-gram and black-gram.
Technical efficiency (TE) is defined as the ability to derive maximum output per unit of resource. It is a key to effectively address the challenge of achieving food
security in the country (Bakhsh et al., 2006).
Farms having same level of output from lower level of inputs or higher level of output from same level of inputs are considered having better resource use efficiency. The study compares the technical efficiency of farms in different states and among various size-groups. To enable the comparison of efficiencies of farms in different regions that operate under different technologies the meta-frontier production function is used in literature (Battese et al., 2004). The meta-frontier production function is an envelope of different frontier production functions. Since pulses are cultivated in marginal and rain-fed land with poor agronomy practices, the meta-frontier production function with no technical gap ratio is suitable for comparing technical efficiency. That is equal to conducting DEA (Data Envelopment Analysis) crop-wise together for all the states. Thus, technical efficiency of each of the major pulses has been estimated under the assumption of homogeneous production environment in different states.
DEA is a Linear Programming technique for constructing a non-parametric piece wise linear envelop to a set of observed output and input data (Coelli, 1998; Worthington, 1999). Technical efficiency score of each farm is estimated in relation to the farms with minimum input-output ratio. The score of the most efficient farms being one, the score of each farm will lie between zero and one. The data for each crop has been pooled
state-wise for employing DEA analysis so that the coefficients
of each crop can be compared among the states.
Mathematically, let us assume that we have K farmers Decision Making Unit (DMU) using N inputs to produce
M outputs. Inputs are denoted by xjk (j=1,2,……., n) and the outputs are represented by yik (i=1,2,…….., m) for each farmer k (k=1,2,………, K). The technical efficiency (TE) of the farmers can be measured as (Coelli, 1998; Worthington, 1999):
1 1
/
m n
k i ik j jk
i j
TE u y v x
= =
where, Yik is the quantity of the ith output produced by the kth farmer, x
jk is the quantity of jth input used by the
kth farmer, and u
i and vj are the output and input weights respectively. For the present analysis, labour use, fertilizer (NPK), insecticide cost, seed rate and irrigation hours were taken as inputs per hectare and yield of respective pulse crop was taken as output. The farmer maximizes the technical efficiency, TEk, subject to,
1 1
/ 1
m n
k i ik j jk
i j
TE u y v x
= =
=
∑
∑
≤where, ui and vj ≥ 0
The above equation indicates that the technical efficiency measure of a farmer cannot exceed one, and the input and output weights are positive. The weights are selected in such a way that the farmer maximizes its own technical efficiency which is executed separately. To select optimal weights, technical efficiency of each farmer (TEk) is minimized subject to the following constraints,
1
0
m
i ik jk i
u y y w
=
− + ≥
∑
where, k = 1,2…………,k
1
0
n
jk j jk
j
x u x
=
−
∑
≥and ui ≥ 0; vj ≥ 0
In the present study the value zero is used for w. The zero value of w signifies that the TE estimations in this paper are under the assumption of constant returns to scale. TE value of one implies that the DMU is the best performer located on the production frontier and has no reduction potential. Any value of TE lower than one indicates that the DMU uses inputs inefficiently (Mousavi-Avval et al., 2011).
Based on estimated technical efficiency, yield gap in pulse crops across different states was estimated as follows:
Potential Yield = Existing Yield * (1-Technical Efficiency) Yield gap = Potential Yield – Existing yield
Results and Discussion
Pulses scenario in India
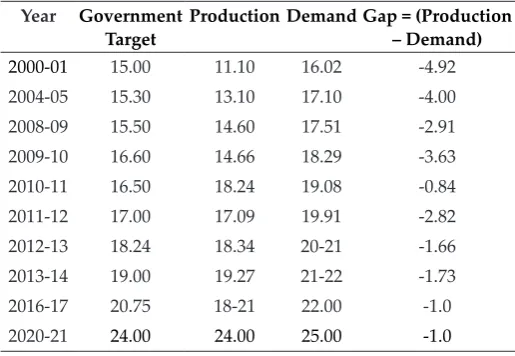
India is the largest producer of the pulses in world but on yield front its rank is very poor. Reasons for low productivity are poor spread of improved varieties and technologies, abrupt climatic changes and vulnerability to pests and diseases (CII, 2010). Table 1 reports the production targets set by the government, domestic supply and demand for pulses in India. By and large the production of pulses has always remained below the government set targets. The gap between production and demand has resulted in shortage of pulses in the country (negative values in Table 1). Therefore to meet the pulses requirement, 2-3 mt of pulses are imported every year. Moreover, daily per capita availability of pulses has drastically declined from a comfortable position of 60.7 gm/person/day in 1951 to 31.6 gm/person/day during TE 2010 against ICMR (Indian Council of Medical Research) recommendation of 40 gm/person/ day (Srivastava et al., 2013) which is a serious concern for government, policy makers and researchers.
Table 1: Target, domestic supply and demand for pulses in India (mt)
Year Government
Target Production Demand Gap = (Production – Demand)
2000-01 15.00 11.10 16.02 -4.92 2004-05 15.30 13.10 17.10 -4.00
2008-09 15.50 14.60 17.51 -2.91
2009-10 16.60 14.66 18.29 -3.63
2010-11 16.50 18.24 19.08 -0.84
2011-12 17.00 17.09 19.91 -2.82
2012-13 18.24 18.34 20-21 -1.66
2013-14 19.00 19.27 21-22 -1.73
2016-17 20.75 18-21 22.00 -1.0
2020-21 24.00 24.00 25.00 -1.0
Source: 1. Pocket Book of Agricultural Statistics, 2015, Ministry of Agriculture and Farmers Welfare, Government of India
2. IIPR, 2013
reduction in pulse imports for some of the years but that could not be sustained in long run (Chauhan and Chauhan, 2011). In order to achieve self-sufficiency in pulse production and reduction in pulse import, it is important to improve pulses productivity. That can be achieved by harnessing the full potential of the Indian farms by improving the existing level of farm level efficiencies. The prevailing farm level efficiency are estimated and explained in next section.
Estimation of resource use efficiencies
Red-gram, chickpea, lentil, green-gram and black-gram are the major pulses grown in India. State-wise technical efficiencies of these five pulses are presented in Table 2. The table shows that average inefficiency in most of the pulses is more than 50% except in the case of lentil. The farmers of the country are unable to harness the farm potential fully in most of pulse crops. The average technical efficiency of red-gram cultivation is merely 41%.
Approximately 60% of the farm potential of red-gram could not be harnessed. Some states particularly Madhya Pradesh and Uttar Pradesh are found to be technically more efficient than the other states. These two states are better off in terms of farm resource use efficiency than national average and have managed to reduce inefficiency below 50%.
In chickpea, technical efficiency in almost each state is less than 40% except Rajasthan where it is 43% (Table 2). Average technical efficiency of chickpea is as low as 35%. Rajasthan, Maharashtra and Chhattisgarh are the states which are obtaining more output from the given inputs than other states. As per our estimates, Rajasthan cultivates chickpea most efficiently among all major chick pea growing states.
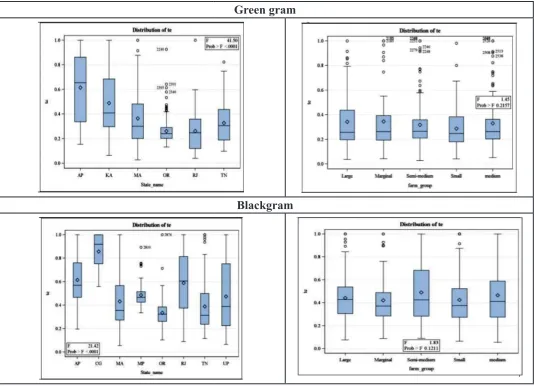
It is interesting to observe that among all pulse crops country is technically most efficient in cultivation of lentil as its technical efficiency is found to more than 60% in all major lentil growing states. West Bengal and Uttar Pradesh have technical efficiency as 65% and 66% respectively. On the contrary for green-gram, average technical efficiency for the country is nearly 32%. Among states Andhra Pradesh is reported as technically
most efficient in green gram cultivation followed by Karnataka and Maharashtra respectively.
Table 2: State-wise technical efficiencies of major pulses of India
States Redgram Chickpea Lentil
Green-gram Black-gram Andhra
Pradesh 0.32 0.34 — 0.61 0.61
Bihar — 0.26 0.60 — —
Chhattisgarh — 0.36 — — 0.86
Gujarat 0.38 — — — —
Karnataka 0.31 0.24 — 0.49 —
Madhya
Pradesh 0.57 0.33 0.62 — 0.49
Maharashtra 0.40 0.39 — 0.37 0.43
Odisha 0.34 — — 0.26 0.33
Rajasthan — 0.43 — 0.26 0.59
Tamil Nadu — — — 0.33 0.39
Uttar
Pradesh 0.56 0.34 0.66 — 0.47
West Bengal — — 0.65 — —
All India* 0.41 0.35 0.62 0.32 0.45 Source: Computed by the Authors
*It includes the average of sample data from selected states.
Chhattisgarh is observed as most efficient in cultivating black gram with technical efficiency as high as 86%. Andhra Pradesh, Rajasthan and Madhya Pradesh are the other states which have ability to produce more output using the given inputs as compared to the national average.
To understand the distribution of inefficient farmers in pulse growing states, an attempt has been made to
compute percentage of the farmers below the national average (Table 3). It is shocking to observe that around
60% of the farmers in the country are technically lagging behind than the national average of technical efficiency
for each pulse crop. The condition of the farmers of the
state like Odisha is critical as about 90% farmers have been found technically inefficient than the national
inefficient in production of these crops. It is interesting
to observe that pulses growers in one pulse are highly
inefficient whereas in other pulses they are efficient. For example in case of red gram, Andhra Pradesh witnesses 75% farmers having lesser technical efficiency
than the national average whereas in black-gram it is
just 19%. The reason could be that natural resources
and climatic conditions of particular state are more
suitable for cultivation of a specific pulse crop. Thus, the crop specific and region specific cultivation plans are required to harness the full farm potential. In case of chickpea, more than 82% farmers of Bihar are having technical efficiency less than national average of 35%. As in Table 2, the situation is better in case of lentil. In case of green gram, in Odisha nearly 84% farmers are less than national average technical efficiency of 32%. The situation is worst for black-gram in Odisha where 89% farmers are below national average of TE i.e. 45%.
Table 3: Farmer below National Average in TE-2011 (%)
State Redgram Chickpea Lentil
Green-gram Black-gram Andhra
Pradesh 75.0 61.3 21.7 18.8
Bihar 82.3 66.5
Chhattisgarh 50.0
Gujarat 67.1
Karnataka 73.1 74.6 29.2
Madhya
Pradesh 35.0 57.2 55.0 42.0
Maharashtra 60.2 47.2 54.9 61.9
Odisha 76.5 83.9 88.5
Rajasthan 32.7 65.3 35.1
Tamil Nadu 52.5 72.1
Uttar
Pradesh 22.8 65.6 41.9 59.5
West Bengal 47.1
All India 57.9 55.4 58.1 65.6 59.6
Source: Computed by authors
*It includes the average of sample data from selected states. To study the effect of farm-size on technical efficiency, the farm households were classified into five categories according to their farm sizes, viz. marginal, small,
semi-medium, medium and large (Table 4). Technical efficiency of each crop was estimated for all classes and the results reveal that overall situation is not different across farm size categories. Farm sizes do not play significant role in harnessing the potential of the pulse farms as the difference of technical efficiency between any two farm-size category is not significant. It may be inferred that none of the farm-size groups are giving importance to the cultivation of pulses because pulses are considered as non-lucrative. Interestingly, the table shows that the marginal farms are found to be better than semi-medium and medium farms for some pulses. This could be because they use very less amount of inputs or most of the operations are done by family members themselves and remain unreported. The significance level of differences across farm size categories were studied with help of Analysis of Variance (ANOVA) as presented in Fig. 1.
Table 4: Farm-size wise technical efficiency of major pulses
Farm Size
Red-gram Bengal-gram Lentil Green-gram Black- gram
Marginal
(less than 1ha) 0.39 0.35 0.6 0.34 0.42 Small
(1-2 ha) 0.43 0.34 0.59 0.29 0.42
Medium
(2-4 ha) 0.41 0.34 0.62 0.32 0.49 Semi-medium
(4-6 ha) 0.41 0.35 0.62 0.33 0.46
Large
(greater than 6 ha) 0.40 0.37 0.71 0.34 0.44
Source: Computed by the authors
INTER-STATE-WISE FARM HOLDING SIZE-WISE
Redgram
Chickpea
Lentil
differences across farm size categories. The Jenkins box in each figure represents distribution of farm technical efficiency between first and third quartile. The diamond in the middle of each box in Fig. 1 represents the mean of TE in the corresponding state. The horizontal line inside the box represents median TE. We observe that in each pulse crop, most of the states have more than 50% farms having TE less than the state average. This suggests that there is a lot of scope to improve the technical efficiency of the farms with extensive dissemination of technology and favorable government policies.
Joshi and Saxena (2002) observed the need to tap
yield potential for improving pulse production in the country. However, the yield gap estimates were
based on potential yield observed from demonstration
experiments. Thus, the used potential yield was far from
realistic situation. In this paper, the potential yield has
been estimated using farm level data as explained in the methodology. The yield gap between existing yield
and potential yield of all pulse crops in major pulse growing states have been estimated and presented in
Table 5. It can be inferred from Table 5 that there exist
a yield gap to the tune of 770 kg/ha of red-gram, 735 kg/ha of chickpea, 340 kg/ha of lentil, 300 kg/ha of green-gram and 323 kg/ha of black-gram. Further, it is observed that the yield levels in major pulse growing states can be improved by harnessing the potential yield of the pulses. We estimated that if the technical
Green gram
Blackgram
efficiency is increased by one per cent with improved
and recommended crop practices then nearly 9 kg/ha of pulses can be additionally produced.
Table 5: Yield gap of selected pulse crops in major pulse growing states of India (Kg/ha)
State Red gram Bengal
gram Lentil Green gram Black gram Andhra
Pradesh 460 760 — 229 339
Bihar — 512 308 — —
Chhattisgarh — 662 — — 130
Gujarat 536 — — — —
Karnataka 655 493 — 351 —
Madhya
Pradesh 443 825 380 — 432
Maharashtra 1178 749 — 387 300
Odisha 258 — — 257 250
Rajasthan — 666 — 275 341
Tamil Nadu — — 326 367
Uttar Pradesh 411 697 372 — 254
West Bengal — 360 — —
All India 770 735 337 299 323
Source: Computed by Authors
*It includes the average of sample data from selected states.
Thus total production will increase by 225 thousand tons. It will improve the per capita availability of pulses and also reduce the import bill.
Conclusion
Pulses are the main components of a diet in our country as majority of the people are vegetarian. The demand for the pulse will be more with the ever growing population
in India. It will be difficult to fill the gap between
demand and supply of pulses in future. To ensure
self-sufficiency and reduce the dependence on import, it is necessary to improve the resource use efficiency of the pulses. About 60% pulse growers are reported to be inefficient than the national average efficiency. State wise estimation of technical efficiencies of major pulses
have indicated that there are significant differences in technical efficiency of each pulse crop among states. Madhya Pradesh, Rajasthan, Uttar Pradesh, Andhra Pradesh and Chhattisgarh are observed to be leading in
redgram, bengal gram, lentil, greengram and blackgram
respectively in term of technical efficiency. From insignificant differences in technical efficiency across
farm size categories, it can be inferred that pulses are less preferable by farmers. There are huge yield gaps for
different pulses which can be eliminated in most of the states by increasing the technical efficiency by 45%. For improving technical efficiency, the success model with improved techniques, better credit and infrastructural
facilities should be adopted. Investment in R&D on pulses, improved and pest resistant varieties of seeds and reduction in post-harvest losses of pulses may also help farmers to improve the pulse production and
their profitability. Productivity enhancement through the optimum use of inputs is required for sustainable agricultural growth. Further region specific crop plans
should be developed with due importance to pulse cultivation. There is a need for pulse revolution to
ensure adequate pulse supply and reduce dependence
on imports.
Acknowledgements
The paper is drawn from the ongoing network project on “Regional Crop Planning for Improving Resource Use Efficiency and Sustainability” funded by Indian Council of Agricultural Research (ICAR). The authors duly acknowledge ICAR for providing funds for the project which facilitated conduct of the study.
References
Ali Masood and Sanjeev Gupta 2012. “Carrying capacity of Indian agriculture: pulse crops”, Current Science, 102(6).
Bakhsh, K., Ahmad, B. and Hassan, S. 2006. “Food security through increasing technical efficiency”, Asian Journal of Plant Sciences 5(6): 970-976.
Battese, G.E., Rao, D.S.P. and O’Donnell, C.J. 2004. “A
Meta-frontier Production Function for the estimation of Technical
Burns and Hardy 1975. “Nitrogen fixation in bacteria and higher
plants”, Molecular Biology Biochemistry and Biophysics, 21: 1-189. Chauhan, Sonia and Mangal Singh Chauhan 2011. “Are we
moving towards self-sufficiency in pulses?”, Agriculture Today,
August issue, 2011.
CII, 2010. Overcoming the pulse crisis, Report by Confederation of Indian Industry (CII), New Delhi.
Coelli, T. 1998. A Muti-stage methodology for solution of
orientated DEA Models, Operation Research Letters, 23(3-5): 143-149.
IIPR 2013. Vision 2050, ICAR-Indian Institute of Pulses Research,
Kanpur.
Joshi, P.K. and Raka Saxena, 2002. “A profile of pulses production in India: Facts, trends and opportunities”,Indian Journal of Agricultural Economics, 57(3): 326- 339.
Mousavi-Avval S.H., Rafiee, S., Jafari, A. and Mohammandi, A. 2011. Optimization of energy consumption for soyabean
production using Data Envelopment analysis (DEA), Applied Energy. 35: 2156-2164.
Mruthyunjaya 1997. Pulses in India: An Explorative Assessment,
Palawija News, The CGPRT Centre New letter.
Pocket Book of Agricultural Statistics 2015. Ministry of Agriculture and Farmers Welfare, Government of India.
Sekhon M.K., Amrit Kaur Mahal, Manjeet Kaur and Sidhu, M.S.
2010. “Technical efficiency in crop production: A region-wise
analysis”, Agricultural Economics Research Review, 23: 367-374.
Srivastava S.C., Singh, B.K., Sudeep S Tomar and Yadava, H.S.
2013. “Growth pattern of major pulses in eastern Uttar
Pradesh” A International Journal of Farm Sciences3(2): 1-9. Srivastava S.K., Sivaramane, N. and Mathur, V.C. 2010. “Diagnosis
of Pulses Performance in India”, Agricultural Economics research Review, 23: 137-148.
Sundaram, Satya 2010. “India Needs A Pulses Revolution”,
Market Survey, December 2010.
Worthington, A.C. 1999. Measuring Technical efficiency in