Income Inequality in Rural Economy of
West Bengal, India
Snehasish Karmakar and Debashish Sarkar
Department of Agricultural Extension, Agricultural Economics and Agricultural Statistics (EES), Palli Siksha Bhavana (Institute of Agriculture), Visva-Bharati, Sriniketan, West Bengal, India
Email: debashis.sarkar@visva-bharati.ac.in
Paper no: 63 Received: 25 January , 2013 Accepted: 15 May , 2013
Abstract
Income inequality is closely related with poverty and food security in developing as well as under developed economy. The present study has been conducted based on primary data collected from rural households in Birbhum district, West Bengal. Present status of income inequality and its decomposition by sources of income (agricultural income and non-agricultural income) and by different categories of farms has been analysed. It has been observed that the income inequality is more prominent in marginal farms than that of small and medium farms. The contribution of non-agricultural income to the overall income inequality is 94.12 per cent. So it is evident that the overall income inequality commonly occurs due to non-agricultural income rather than agricultural income. Similarly, the income inequality within sub-groups is little bit high as compared to BETWEEN sub-groups. © 2013 New Delhi Publishers. All right reserved
Keywords: Income inequality, decomposition, income share and population share
Introduction
The pattern of income distribution is a matter of great concern to the economists for a long time (Clarke et al., 2003). This is because income inequality indicates underlying structural problems that can lead to hindrance in economic growth, food security, poverty and social unrest. Inequality in income distribution compels to live in poverty for a substantial portion of population. A smaller reduction of income inequality, even in absence of growth, can lead to substantial decline in poverty (Bruno et al., 1996). High income inequality measure indicates that a major portion of the population of the society do not participate equally in socio-economic life. Income inequality in rural areas indicate unequal access to land or other productive capital, a discriminatory labour market, barriers to social mobility, unequal educational achievements and other factors. In policy frame work, the study of inequality is very vital and crucial to provide the equal opportunity for the people irrespective of caste, creed and minority.
poverty (modified Expert Group) also declined from 40.80 per cent in 1993-94 to 31.7 in 1999-2000 and to 24.7 per cent in 2003. However, in fact the scenario of overall poverty is more deplorable in rural areas than in urban areas.
Under this back ground, an attempt has been made to study the nature of income inequalities among the different categories of farms in Birbhum district, West Bengal, where uniqueness prevails in terms of high rate of incidence of poverty in spite of high literacy rate as compared to other districts in West Bengal.
This study intends to fulfil three specific objectives. First is to access the present status of inequality in terms of household income and population share in rural areas. Second is to decompose the contributions of the income sources (agriculture and non-agriculture) to overall income inequality and third is to decompose the income inequality by size of land holdings.
Data base and Methodology
The study has been conducted based on primary data collected through personal interview with the help of pre-tested household schedule. Birbhum district, West Bengal comprises of 19 blocks in three sub-divisions namely Suri (Sadar), Rampurhat and Bolpur. Out of 19 blocks in the district, three blocks i.e. one block from each sub-division has been chosen considering the concentration of inhabited villages in the block. Thus Sainthia Block from Suri Sub-division, Rampurhat–I Block from Rampurhat Sub-division and Bolpur-Sriniketan Block from Bolpur Sub-division has been selected for the present study.
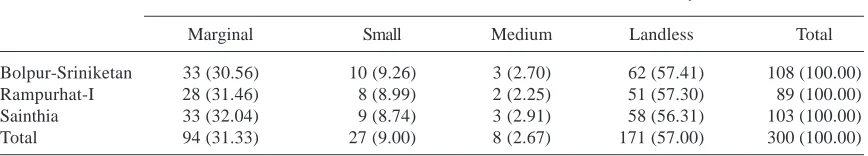
Table 1: Distribution of the selected household by size class
BlockDistribution of households (number) by size class
Marginal Small Medium Landless Total
Bolpur-Sriniketan 33 (30.56) 10 (9.26) 3 (2.70) 62 (57.41) 108 (100.00) Rampurhat-I 28 (31.46) 8 (8.99) 2 (2.25) 51 (57.30) 89 (100.00) Sainthia 33 (32.04) 9 (8.74) 3 (2.91) 58 (56.31) 103 (100.00)
Total 94 (31.33) 27 (9.00) 8 (2.67) 171 (57.00) 300 (100.00)
Note: Figures in brackets indicate the percentage over total
In the next stage the list of households of each block has been collected. The households have been subdivided into various categories based on size of land holdings. These are marginal (below 1.0 ha), small (1.0-2.0 ha), medium (above 2.00 ha) farms and landless labourers. Then 100 households have been selected from each block based on the basis of simple random sampling. Thus, all total 300 households have been selected as the ultimate sample unit of the study. The primary data relates to 2008-09. The distribution of the selected households is presented in Table-1.
Where,
y = Income
F(y) = Cumulative distribution function of income
Cov = Covariance
Assuming an income distribution with m different income sources, we can write:
Where,
y = kth source of income
F (yk) = cumulative distribution function of income
In view of the above, the Gini Index of the distribution of total income is equal to the sum (over m income sources) of the Gini coefficients calculated by using the covariance between the kth income source and the cumulative distribution function of total income. The Gini Index in this case is perfectly decomposable.
To split overall inequality among different size of farms, its decomposability of inequality measures requires a consistent relation between overall inequality and its parts. More specifically, while dealing with decomposability by sub-groups, two types of inequality arises viz. within inequality (WIT) and between quality (BET). The within inequality element captures the inequality due to the variability of income within each group, while the between quality captures the inequality due to the variability of income across different groups.
It worth noting that Gini Index by sub-groups, in our study is not perfectly decomposable as it has a non-zero residual K besides the within and between inequality. Assuming four sub-groups i.e. marginal, small, medium and landless - the within element of the Gini Index (GWIT) is estimated by the following formula:
Where,
Gi = Gini Index measured on sub-group
(Ni/N) = Population share of the ith group
(Yi/Y) = Income share of each group of the ith group
Where,
= Distribution of income obtained by replacing actual incomes with sub-group means
The Gini from the original distribution is decomposed as:
In general, the Gini Index is perfectly decomposable (i.e. K=0) when ranking by subgroup incomes from the poorest to the richest do not overlap, i.e. the relative position of each individual is the same as in the total income distribution. The residual K is positive instead when ranking by subgroup incomes overlaps, i.e. when the relative position of a given individual in the subgroup income distribution differ from its position in the total income distribution.
Results and Discussion
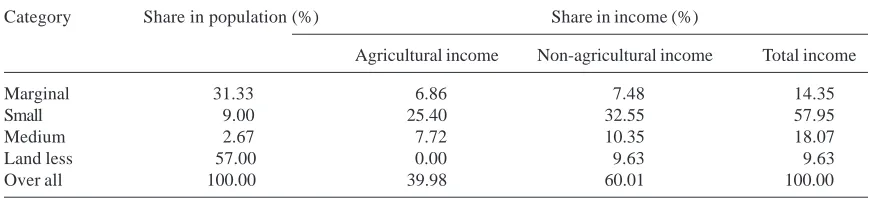
In the study area, marginal, small and medium farms are those below 1 hectare, 1-2 hectares and above 2 hectares of land, respectively. These are farms for whom farming is one of the major livelihood activities, yet who have other non-agricultural occupations. Thus the income profile is sub-divided basically into two categories i.e. agriculture and non-agriculture (Table-2). Agricultural income relates to those who have operated land. Net return from agriculture is considered as agricultural income, whereas income from all sources other than agriculture is considered as non-agricultural income. In the sample, marginal farms constitutes 31.33 per cent of the total sampling unit but are contributing only 14.35 per cent of the overall income, out of which income from non-agricultural sources (7.48 per cent), exceed the income from agricultural sources (6.86 per cent). Similar feature also observed while studying the income profile of small, medium and landless categories. The proportions of small, medium and landless in the sampling unit are 9.00, 2.67 and 57.00 per cent and these three categories contribute 57.95, 18.07 and 9.63 per cent of the overall income, respectively. Out of the overall income, the contributions of agriculture and non-agriculture sources are 25.40 per cent and 32.55 per cent in case of small farms and 7.72 per cent and 10.35 per cent in case of medium farms. The income of landless is fully dependent on non-agricultural source; there is no scope to point out the minute details of these sources in our case. In nutshell, it is clear from these findings that inequality in income exists when it is explained in terms of population share. Similarly inequality also prevails when income is sub-divided into two sources irrespective of the category of farms.
Table 2: Size-class wise share of income by different sources in Birbhum
Category Share in population (%) Share in income (%)
Agricultural income Non-agricultural income Total income
Marginal 31.33 6.86 7.48 14.35
Small 9.00 25.40 32.55 57.95
Medium 2.67 7.72 10.35 18.07
Land less 57.00 0.00 9.63 9.63
Over all 100.00 39.98 60.01 100.00
The total income inequality exhibits in Table 3 is highest in marginal farms (0.54) followed by small (0.53), landless (0.36) and medium (0.32) farms. The inequality is low when agricultural income is considered as compared to its counterpart irrespective of category of farms. When the decomposability of income inequality is analysed by source within and across the size-class, the highest (98 per cent) inequality in total income arises in marginal farms for non-agricultural income. Though not relevant, but for better perceptive of the total rural income profile, the overall inequality is estimated. It has been found that the overall inequality arises to 94.12 per cent for non-agricultural income. The contribution of non-agricultural income to the total income inequality is much higher than that of agricultural income irrespective of size-classes. As the size of the land holding increases, there is an evidence of increase in income inequality for the contribution of non-agricultural income.
Table 3: Decomposition of income inequality
Size-Class Total Income Agricultural income Non-agricultural Income
Marginal 0.54 (100.00) 0.01 (11.85) 0.53(98.15)
Small 0.53(100.00) 0.01 (11.84) 0.52 (98.13)
Medium 0.32 (100.00) 0.04 (12.50) 0.28 (87.50)
Landless 0.36 (100.00) - 0.36 (100.00)
Overall 0.51 (100.00) 0.03 (5.88) 0.48 (94.12)
Note: Figures in brackets indicate percentages over total Source: field survey
Considering the contribution of each sub-group to the within income inequality, the share of landless households is highest (53.01 per cent) followed by marginal farms (41.64 per cent). The least, almost negligible, contribution comes from the medium farms.
Table 4: Gini by sub-groups and its contribution
Size-class Gini by sub-groups Contribution to G(WIT)
Marginal 0.5378 0.0436 (41.64)
Small 0.5265 0.0047 (4.49)
Medium 0.3190 0.0009 (0.86)
Landless 0.1799 0.0555 (53.01)
Over all 0.4692 0.1045 (100.00)
Note: Figures in brackets indicate percentages over total Source: field survey
Table 5: Decomposition of Gini
Gini(WIT) Gini(BET) Gini(WIT)+Gini(BET) Gini (original distribution) The value of K
0.1045 (22.27) 0.0102 (2.18) 0.1147 (24.45) 0.4692 (100.00) 0.3545
While decomposing the Gini by sub-groups, 2.18 per cent of total inequality is explained by the Between the groups inequality and 22.27 per cent is explained by the within the groups inequality. Hence, 24.45 per cent of total inequality by sub-groups is explained by within and between elements of the income distribution. The value of K, 0.3545 is high because the income ranks within each sub-groups change substantially as we rearrange the income distribution taking altogether. This is the case of overlapping that affects group ranks considerably.
Conclusion
In rural income profile, there are two sources of income i.e. agricultural income and non-agricultural income. In general, agriculture plays a pivotal role in the rural economy. It believes that major livelihood activities of the farming community are dependent on agriculture. In analysing the fact, it has been found that the non-agricultural income is considerably conscientious for creating income inequality in rural income profile. However, there are some issues in interpreting a Gini coefficient. The same value may result from many different distribution curves. Even knowing the limitation of Gini coefficient, it is fact that inequality remains within and between the sub-groups even by source of income of the rural economy which may aggravate the severity of poverty in a real sense. If eradication of poverty is one of the major objectives of the national agenda, it is call for the day to reduce the income inequality particularly in non-agricultural sector by creating employment generation opportunities in the right direction.
References
Bhalla, G.S. and Singh, G. 1997. Recent Development in Indian Agriculture: A State Level Analysis, Economic and
Political Weekly,A.8-A.12.
Bruno, Michael, Martin, Ravallion and Lyn, Squire. 1996. Equity and Growth in Developing Countries: Old and New Perspectives on the Policy Issues, Policy Research Working Paper 1563, The World Bank, ISSN 1813-9450. Clerke, G.,L. Colin, X.H. Zon 2003. Finance and Income Inequality: Text of Alternative Teories. World Bank Policy
Research Working Paper 2984. Washington D.C., World Bank.
Lerman, I. Robert and Shlomo, Yitzhaki. 1985. Income inequality effects by income source: A new approach and applications to the United States, The Review of Economics and Statistics, 67(1), p.151.
Rawal, Vikas and Madhura Swaminathan 1998. Changing Trajectories: Agricultural Growth in West Bengal, 1950 to 1996, Economic and Political Weekly, 33(40).
Sawant, S.D. and Achuthan, C.V. (1995). Economic Growth Across Crops and Regions: Emerging Trends and Patterns,