Science World Journal Vol 9 (No 4) 2014 www.scienceworldjournal.org
ISSN 1597-6343
MODELING THE EFFECT OF BANDWIDTH ALLOCATION ON
NETWORK PERFORMANCE
Moses E. Ekpenyong1* and Paul J. Udoh2
1Department of Computer Science, University of Uyo, Nigeria
mosesekpenyong@{uniuyo.edu.ng, gmail.com}
2Department of Mathematics and Statistics, University of Uyo, Nigeria
*Corresponding Author
ABSTRACT
In this paper, a new channel capacity model for interference-limited systems was obtained by transforming the Shannon-Hartley theorem for channel capacity. To emulate an operational system, a dashboard Motorola monitoring device was used to collect data from a group of Base Stations (BSs) serving (a section of) the Nigerian air space and belonging to one of the existing network carriers. Our findings revealed that the uplink and downlink throughputs of the existing system were not impressive even when there was uniform sharing of bottlenecks across the BSs. Using MATLAB, simulations were then performed by extending these data, subject to ideal environmental constraints. Results obtained revealed the following: (i) The Shannon-Hartley model performed as expected for no-interference systems (TDMA and FDMA), but as the bandwidth improved, only limited number of users could access the network in the presence of increased SNR; (ii) The proposed model showed improved performance for CDMA networks, but further increase in the bandwidth did not benefit the network; (iii) A reliability measure such as the spectral efficiency is therefore useful to redeem the limitation in (ii).
Keywords: Coverage capacity, CDMA, mobile network,
network throughput.
INTRODUCTION
Wireless network is one of the rapidly growing aspects in today’s communication technology. Advances in interactive multimedia applications such as audio phone, movie/video on demand, video conferencing, video gaming, etc., have resulted in spectacular studies on the progress of wireless communication systems. These advances have necessitated the continuous transmission of data, thus placing high demands for increased bandwidth. Consequently, bandwidth has become a critical resource in wireless networks, prompting the employment of efficient mechanisms for available bandwidth utilization. With the recent reduction in cell size, coupled with the increased demand for wireless connectivity, limitations are however placed on resource availability which erupts frequent handovers and in turn permits numerous blocked/dropped calls (Kamaluddin, Sharif and Almaini, 2008).
Many solutions have been proffered regarding bandwidth allocation and management in mobile telecommunication networks. One of these solutions is by sorting inbound or outbound network traffic into classes of applications and service types. Traffic is then scheduled accordingly to meet with the minimum and maximum bandwidth configuration for each traffic type. Intranet or Internet services that share
information and Web navigation have an increased demand on bandwidth, but simply upgrading to wider connections may not address bandwidth issues because availability is not certain. Hence, in distributed adaptive bandwidth allocation and management, admission control schemes are proposed to improve end-to-end availability (Qiu, Bahl and Adya, 2002). As such, using effective bandwidth management for the allocation of bandwidth to applications or users during peak periods could prevent traffic congestion in the network and guarantee minimum bandwidth with prioritized traffic based on rules/policies created on the bandwidth interface by a control algorithm that regulates the amount of bandwidth allocated to each application or users (Kassim and Kassim, 2011).
This paper therefore investigates the effect of bandwidth on network performance. To achieve this goal, we observed the throughputs of an operational Code Division Multiple Access (CDMA) network and propose a new bandwidth allocation scheme using the Shannon-Hartley channel capacity theorem. A simulation of the model under various congestion settings would certainly assist network operators during planning, development and optimization of their networks.
PROBLEM STATEMENT
Ensuring that each user experiences a satisfactory quality of service (QoS) is an important challenge for network designers, especially wireless networks – where resources are relatively scarce and interference is relatively high. The wireless communication networks allow different types of services such as voice, data, images and video. These services have various requirements in terms of bandwidth, cell loss, latency, etc. Ismail (2002) have illustrated four bandwidth problems, and have described solutions to these problems. His work which motivated this paper aimed at providing a practical solution to mitigating the bandwidth challenges highlighted as follows:
(i) Topology design: Ability to dynamically configure
a network and derive efficient benefits from the network resources
(ii) Flow control and congestion avoidance:
Bandwidth management protocols are required to regulate the acceptance and rejection of newly arrived calls
(iii) Bandwidth allocation: The successful integration
of link capacities through the different service types
(iv) Assignment of bandwidth to virtual paths: A
logical link is composed of some virtual circuits between any two nodes, and is required to optimize performance for all users.
F
u
ll
L
en
g
th
R
es
ear
ch
A
rt
ISSN 1597-6343
The design problem therefore consists of choosing the allocated bandwidth and associated parameters required to optimize the overall system’s performance, which demand satisfying certain operational constraints. The goal therefore is to efficiently manage network resources (bandwidth in this case) to serve users who generate random demands on the network.
RELATED WORKS
A mobile network supporting multilevel QoS has been proposed in (Chou and Shin, 2004). They investigated two new user-perceived QoS metrics: degradation ratio and upgrade/degrade frequency instead of only focusing on bandwidth utilization or blocking/dropping probability. A markov model was then used to derive the QoS metric and the effects of adaptive bandwidth allocation on user-perceived QoS. They also proved the existence of tradeoffs between system performance and user-perceived QoS and how to exploit adaptive bandwidth allocation to increase system utilization.
Qiu, Bahl and Adya (2002) considered the evaluation of several first-hop allocation schemes, to determine their effectiveness. They characterized throughput using traces collected from a popular website with the aim of improving the end-to-end performance. Results of their analysis revealed that different clients experienced widely varied throughput, but a significant portion of clients received very low throughput (less than 20 kbps). They also appraised several bandwidth allocation schemes for various congestion scenarios, and remarked that schemes which took into account both the application data rate and path bandwidth plus full adaptation to the changing path properties, yielded better results.
An energy-efficient bandwidth allocation scheme for wireless networks have been presented in (Wang, Wang, and Nilsson, 2006). They studied the intrinsic relationship between energy consumption and transmission rates of mobile terminals, where the transmission rate is determined through channel allocations, and proposed two schemes for congestion admission control, with the intent of minimizing energy consumption at each terminal. The performance of their system was then evaluated with respect to the rate of energy consumed and each successfully transmitted bit, throughput and call blocking probability.
Isabona and Ekpenyong (2009) focused on the computation and performance measurements of normalized bandwidth for single code (SC) and multi code (MC) CDMA systems under multi-path propagation. They presented a performance analysis for the uplink transmission – a link considered most critical in CDMA systems, and remarked that MC transmissions with higher spreading gain offered higher capacity than SC transmissions, with variable spreading gains (depending on the bit rates of the services. The MC transmission was also found to improve flexibility for time-varying traffic in realistic scenarios.
Current trends in telecommunication infrastructure with packet oriented networks and huge multimedia traffic have raised serious concerns on QoS support. As such, efficient dynamic resource management algorithms become vital for the optimization of the QoS of networks. The main goal of these algorithms is to offer services that satisfy the QoS requirements of individual users while guaranteeing
simultaneously, efficient utilization of the network resource. Network bandwidth design, simulation, and management tools therefore represent a viable alternative for network planners to rapidly determine correct configurations based on actual mission requirements and current systems availability. The results yield effective utilization of the available bandwidth and contribute to determining the prioritization of the data rate. Where traffic statistics change significantly, a deployment of solutions that can dynamically track traffic statistics for efficient allocation of network resources and satisfy the QoS requirements of users while maximizing (at the same time) resource utilization and network revenue are necessary. Dynamic bandwidth allocation has attracted numerous research interests and many algorithms have been proposed in the literature (see, Campbell and Liao, 2004; Schulzrinne and Wang, 2005; Ahmed, Boutaba and Mehaoua, 2005; Mahajan Parashar and Ramanathan, 2004; Kelly, 1997). Many tools and techniques have also been developed to predict the performance of cellular networks. Broadly speaking, all these tools fall under one of the following approaches: discrete event simulation and mathematical modeling (Wombell, 1999). In the first approach, bandwidth utilization and network performance are estimated by modeling every individual packets traversing the network. On the other hand, the main idea of mathematical modeling lies in building an abstract framework of the network consisting of a number of equations founded on sound theoretical concepts. This model is then used to compute traffic patterns, infer bandwidth utilization trends and compute the expected network performance. The Network Simulator (NS) (McCanne and Floyd, 2007), and the Georgia Tech Network Simulator (Riley, 2003), are network simulation tools based on the descrete event approach. Network bandwidth utilization is estimated using a simulation engine that tracks packet transmissions from origin to destination (Breslau, Estrin, Fall, Floyd, Heidemann, Helmy, Huang, McCanne, Varadhan, Xu and Yu, 2000). Some tools have incorporated additional features to increase the accuracy of estimations, such as queing behaviour and parallel processing. The Mathematical modeling approach includes a significant number of tools such as CACI Network Simulation Suite and NetraMet (Brownlee, 1997). These tools collect statistical information from the network in order to produce an overall picture of the traffic and link utilization patterns. This can be achieved by either actively probing the network to collect data or by other passive means that rely on different networking protocol characteristics to deduce the required information.
In this paper, we employed the Shannon-Hartley theorem for channel utilization capacity as a basis for investigating the network throughput, and tranformed the theorem by introducing an additional constraint in order to establish a relationship between the data rate and channel capacity. The constraint is defined by the model architecture adopted – the multi-cell uplink/downlink structure in the presence of interference, typical of CDMA cellular networks.
SYSTEM MODEL
The Shannon-Hartley Theorem
ISSN 1597-6343
capacity of a link in bits per second (bps) as a function of the available bandwidth and the signal-to-noise ratio of the link. Shannon’s theorem proposed that:
A given communication system possesses a
maximum information rate C, called the channel capacity
If the data/information rate R is below C, then arbitrary negligible error probabilities are achievable using intelligent techniques
Lower error probabilities are achievable if the encoder processes longer signal data blocks, which entails longer latency and higher computational requirements.
Thus, if
R
C
, then, transmissions may beaccomplished without error in the presence of noise. Unfortunately, Shannon’s theorem does not represent a constructive proof – it merely states the existence of such a coding method. The proof is therefore not reliable if we desire a coding method that approaches the channel capacity. The negation of this theorem also holds: if R>C, the errors are unavaoidable regardless of the coding technique used.
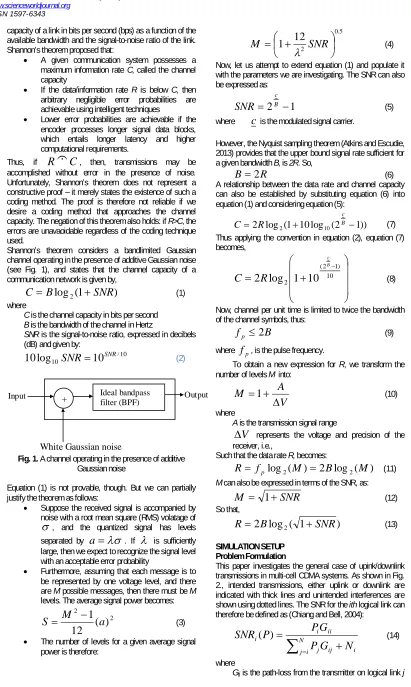
Shannon’s theorem considers a bandlimited Gaussian channel operating in the presence of additive Gaussian noise (see Fig. 1), and states that the channel capacity of a communication network is given by,
)
1
(
log
2SNR
B
C
(1)where
C is the channel capacity in bits per second B is the bandwidth of the channel in Hertz
SNR is the signal-to-noise ratio, expressed in decibels
(dB) and given by:
10 /
10
10
log
10
SNR
SNR(2)
Fig. 1. A channel operating in the presence of additive
Gaussian noise
Equation (1) is not provable, though. But we can partially justify the theorem as follows:
Suppose the received signal is accompanied by noise with a root mean square (RMS) volatage of
, and the quantized signal has levels separated bya
. If
is sufficiently large, then we expect to recognize the signal level with an acceptable error probability Furthermore, assuming that each message is to be represented by one voltage level, and there are M possible messages, then there must be M levels. The average signal power becomes:
2 2
)
(
12
1
a
M
S
(3) The number of levels for a given average signal power is therefore:
5 . 0
2
12
1
SNR
M
(4)Now, let us attempt to extend equation (1) and populate it with the parameters we are investigating. The SNR can also be expressed as:
1
2
Bc
SNR
(5)where
c
is the modulated signal carrier.However, the Nyquist sampling theorem (Atkins and Escudie, 2013) provides that the upper bound signal rate sufficient for a given bandwidth B, is 2R. So,
R
B
2
(6)A relationship between the data rate and channel capacity can also be established by substituting equation (6) into equation (1) and considering equation (5):
))
1
2
(
log
10
1
(
log
2
2
10
Bc
R
C
(7)Thus applying the convention in equation (2), equation (7) becomes,
10 ) 1 2 (
2
1
10
log
2
B c
R
C
(8)Now, channel per unit time is limited to twice the bandwidth of the channel symbols, thus:
B
f
p
2
(9)where
f
p, is the pulse frequency.To obtain a new expression for R, we transform the number of levels M into:
V
A
M
1
(10)where
A is the transmission signal range
V
represents the voltage and precision of the receiver, i.e.,Such that the data rate R, becomes:
)
(
log
2
)
(
log
2M
B
2M
f
R
p
(11)M can also be expressed in terms of the SNR, as:
SNR
M
1
(12)So that,
)
1
(
log
2
B
2SNR
R
(13)SIMULATION SETUP Problem Formulation
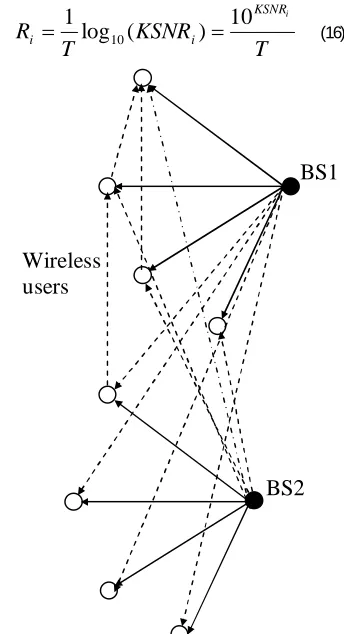
This paper investigates the general case of upink/downlink transmissions in multi-cell CDMA systems. As shown in Fig. 2., intended transmissions, either uplink or downlink are indicated with thick lines and unintended interferences are shown using dotted lines. The SNR for the ith logical link can therefore be defined as (Chiang and Bell, 2004):
Ni
j j ij i ii i i
N
G
P
G
P
P
SNR
(
)
(14)where
Gij is the path-loss from the transmitter on logical link j
Ideal bandpass
filter (BPF) Output
+
White Gaussian noise
InputISSN 1597-6343
to the receiver on logical link i,taking into account propagation loss and normalization factors
Gii is the path gain for the intended transmission on
logical link i, taking into account propagation loss and other factors such as spreading gain and the effect of beamforming (directional signal transmission or reception).
For a large class of modulations, typical of our case, the attainable data rate can be rewritten as:
)
1
(
log
1
10 i
i
KSNR
T
R
(15)where
T is the symbol time
K is a constant depending on the modulation type and
desired bit error probability
Due to the high spreading gain, KSIRi is always above unity
for medium to high SNR environments, thus reducing equation (14) to:
T
KSNR
T
R
i
KSNR
i i
10
)
(
log
1
10
(16)Fig. 2. Multi-cell uplink/downlink case with interference
Extending equation (7) over i cells, and substituting equation (16), we derive the new channel capacity for interference limited CDMA systems as follows:
10 ) 1 2 (
2
1
10
log
2
B c
i
i
R
C
(17)We note here that since there exists a direct relationship between bandwidth and channel capacity, channel capacity and throughput are mostly often equatable (Blahut, 1990).
Blahut’s (1990) assumption holds for practical
communication systems, and is adopted in this paper.
Throughput Analysis of The System Under Study
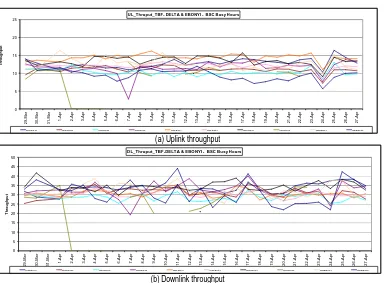
Data for the study were obtained from base stations (BSs) serving the following locations in Nigeria: (Abia and Akwa Ibom), (Benue and Anambra), (Bayelsa and Cross River), (Delta and Ebonyi), (Enugu and Imo), and (Kogi and Rivers). Both uplink and downlink throughput data were collected and analysed (see Figs. 3-8). The line plots show the throughputs obtained from the various BSs serving the coverage zone/area. The figures show throughput instability, and is typical of the interference limited nature of third generation (3G) systems. We also observed that the uplink transmissions had lower throughputs, compared to downlink transmissions. The reason behind this is that uplink transmissions require lower frequency because of free space path-loss, which increases as the frequency increases. As mobile phones being battery driven devices have limitations in terms of power, we should always seek lower path-losses; whereas, BS antennas can transmit the signal (in the downlink channels) with comparatively higher powers, to compensate for the losses.
BS1
BS2
Wireless
users
ISSN 1597-6343
(a) Uplink throughput
(b) Downlink throughput
Fig. 3. Throughput recordings at peak period for Abia and Akwa Ibom BSs
(a) Uplink throughput
(b) Downlink throughput
Fig. 4. Throughput recordings at peak period for Benue and Anambra BSs
UL_Thruput_TBF- IBOM- BSC Busy Hours
0 5 10 15 20 25 2 9 -M a r 3 0 -M a r 3 1 -M a r 1 -A p r 2 -A p r 3 -A p r 4 -A p r 5 -A p r 6 -A p r 7 -A p r 8 -A p r 9 -A p r 1 0 -A p r 1 1 -A p r 1 2 -A p r 1 3 -A p r 1 4 -A p r 1 5 -A p r 1 6 -A p r 1 7 -A p r 1 8 -A p r 1 9 -A p r 2 0 -A p r 2 1 -A p r 2 2 -A p r 2 3 -A p r 2 4 -A p r 2 5 -A p r 2 6 -A p r 2 7 -A p r T h ro u g h p u t
MAIBS10 MA IBS25 MAIBS49 MAKBS09 MAKBS 11 MAKB S12 MAK BS16 MAKBS22 MAKBS40
`
DL_Thruput_TBF-ABIA & AWKA IBOM- BSC Busy Hours
0 5 10 15 20 25 30 35 40 45 50 2 9 -M a r 3 0 -M a r 3 1 -M a r 1 -A p r 2 -A p r 3 -A p r 4 -A p r 5 -A p r 6 -A p r 7 -A p r 8 -A p r 9 -A p r 1 0 -A p r 1 1 -A p r 1 2 -A p r 1 3 -A p r 1 4 -A p r 1 5 -A p r 1 6 -A p r 1 7 -A p r 1 8 -A p r 1 9 -A p r 2 0 -A p r 2 1 -A p r 2 2 -A p r 2 3 -A p r 2 4 -A p r 2 5 -A p r 2 6 -A p r 2 7 -A p r T h ro u g h p u t
MAIBS10 MAIBS25 MAIBS49 MA KBS09 MAK BS11 MAK BS12 MAK BS16 MAKB S22 MAKB S40
`
UL_Thruput_TBF- BENUE & ANAMBRA- BSC Busy Hours
0 5 10 15 20 25 2 9 -M a r 3 0 -M a r 3 1 -M a r 1 -A p r 2 -A p r 3 -A p r 4 -A p r 5 -A p r 6 -A p r 7 -A p r 8 -A p r 9 -A p r 1 0 -A p r 1 1 -A p r 1 2 -A p r 1 3 -A p r 1 4 -A p r 1 5 -A p r 1 6 -A p r 1 7 -A p r 1 8 -A p r 1 9 -A p r 2 0 -A p r 2 1 -A p r 2 2 -A p r 2 3 -A p r 2 4 -A p r 2 5 -A p r 2 6 -A p r 2 7 -A p r T h ro u g h p u t
MANBS15 MANBS19 MANBS27 MANBS38 MBNBS02 MBNBS03 MBNBS07
``
DL_Thruput_TBF-BENUE & ANAMBRA- BSC Busy Hours
0 5 10 15 20 25 30 35 40 45 50 2 9 -M a r 3 0 -M a r 3 1 -M a r 1 -A p r 2 -A p r 3 -A p r 4 -A p r 5 -A p r 6 -A p r 7 -A p r 8 -A p r 9 -A p r 1 0 -A p r 1 1 -A p r 1 2 -A p r 1 3 -A p r 1 4 -A p r 1 5 -A p r 1 6 -A p r 1 7 -A p r 1 8 -A p r 1 9 -A p r 2 0 -A p r 2 1 -A p r 2 2 -A p r 2 3 -A p r 2 4 -A p r 2 5 -A p r 2 6 -A p r 2 7 -A p r T h ro u g h p u t
MANBS15 MANBS19 MANB S27 MANBS38 MBNBS02 MB NBS03 MBNBS07
``
ISSN 1597-6343
(a) Uplink throughput
(b) Downlink throughput
Fig. 5. Throughput recordings at peak period for Bayelsa and Cross River BSs
(a) Uplink throughput
(b) Downlink throughput
Fig. 6. Throughput recordings at peak period for Delta and Ebonyi BSCs
UL_Thruput_TBF- BYELSA & CROSS RI-ER BSC Busy Hours
0 5 10 15 20 25 2 9 -M a r 3 0 -M a r 3 1 -M a r 1 -A p r 2 -A p r 3 -A p r 4 -A p r 5 -A p r 6 -A p r 7 -A p r 8 -A p r 9 -A p r 1 0 -A p r 1 1 -A p r 1 2 -A p r 1 3 -A p r 1 4 -A p r 1 5 -A p r 1 6 -A p r 1 7 -A p r 1 8 -A p r 1 9 -A p r 2 0 -A p r 2 1 -A p r 2 2 -A p r 2 3 -A p r 2 4 -A p r 2 5 -A p r 2 6 -A p r 2 7 -A p r T h ro u g h p u t
MBYBS14 MBYBS50 MCRBS08 MCRBS23 MCRBS46
``
DL_Thruput_TBF-BYELSA & CROSS RI-ER BSC Busy Hours
0 5 10 15 20 25 30 35 40 45 50 2 9 -M a r 3 0 -M a r 3 1 -M a r 1 -A p r 2 -A p r 3 -A p r 4 -A p r 5 -A p r 6 -A p r 7 -A p r 8 -A p r 9 -A p r 1 0 -A p r 1 1 -A p r 1 2 -A p r 1 3 -A p r 1 4 -A p r 1 5 -A p r 1 6 -A p r 1 7 -A p r 1 8 -A p r 1 9 -A p r 2 0 -A p r 2 1 -A p r 2 2 -A p r 2 3 -A p r 2 4 -A p r 2 5 -A p r 2 6 -A p r 2 7 -A p r T h ro u g h p u t
MBYBS14 MBYBS50 MCRBS08 MCRBS23 MCRBS46
``
UL_Thruput_TBF- DELTA & EBONYI - BSC Busy Hours
0 5 10 15 20 25 2 9 -M a r 3 0 -M a r 3 1 -M a r 1 -A p r 2 -A p r 3 -A p r 4 -A p r 5 -A p r 6 -A p r 7 -A p r 8 -A p r 9 -A p r 1 0 -A p r 1 1 -A p r 1 2 -A p r 1 3 -A p r 1 4 -A p r 1 5 -A p r 1 6 -A p r 1 7 -A p r 1 8 -A p r 1 9 -A p r 2 0 -A p r 2 1 -A p r 2 2 -A p r 2 3 -A p r 2 4 -A p r 2 5 -A p r 2 6 -A p r 2 7 -A p r T h ro u g h p u t
M DLBS18 M DLBS20 MDLBS29 MDLBS30 MDLBS31 M DLBS42 MDLBS44 MDLBS45 MEBBS34 MEBBS39
``
DL_Thruput_TBF-DELTA & EBONYI - BSC Busy Hours
0 5 10 15 20 25 30 35 40 45 50 2 9 -M a r 3 0 -M a r 3 1 -M a r 1 -A p r 2 -A p r 3 -A p r 4 -A p r 5 -A p r 6 -A p r 7 -A p r 8 -A p r 9 -A p r 1 0 -A p r 1 1 -A p r 1 2 -A p r 1 3 -A p r 1 4 -A p r 1 5 -A p r 1 6 -A p r 1 7 -A p r 1 8 -A p r 1 9 -A p r 2 0 -A p r 2 1 -A p r 2 2 -A p r 2 3 -A p r 2 4 -A p r 2 5 -A p r 2 6 -A p r 2 7 -A p r T h ro u g h p u t
MDLBS18 MDLBS20 MDLBS29 MDLBS 30 MDLBS31 MDLBS42 MDLBS44 MDLBS45 MEBBS34 MEBBS39
``
ISSN 1597-6343
(a) Uplink throughput
(b) Downlink throughput
Fig. 7. Throughput recordings at peak period for Enugu and Imo BSs
(a) Uplink throughput
(b) Downlink throughput
Fig. 8. Throughput recordings at peak period for Kogi and Rivers BSs
UL_Thruput_TBF-ENUGU & IMO - BSC Busy Hours
0 5 10 15 20 25 2 9 -M a r 3 0 -M a r 3 1 -M a r 1 -A p r 2 -A p r 3 -A p r 4 -A p r 5 -A p r 6 -A p r 7 -A p r 8 -A p r 9 -A p r 1 0 -A p r 1 1 -A p r 1 2 -A p r 1 3 -A p r 1 4 -A p r 1 5 -A p r 1 6 -A p r 1 7 -A p r 1 8 -A p r 1 9 -A p r 2 0 -A p r 2 1 -A p r 2 2 -A p r 2 3 -A p r 2 4 -A p r 2 5 -A p r 2 6 -A p r 2 7 -A p r T h ro u g h p u t
MENBS28 MENBS36 MENB S37 MIMBS17 MIMB S26 MIMBS41 MIMB S47 MENBS21
```
DL_Th rupu t_TBF-ENUGU & IMO - BSC Bu sy Hours
0 5 10 15 20 25 30 35 40 45 50 2 9 -M a r 3 0 -M a r 3 1 -M a r 1 -A p r 2 -A p r 3 -A p r 4 -A p r 5 -A p r 6 -A p r 7 -A p r 8 -A p r 9 -A p r 1 0 -A p r 1 1 -A p r 1 2 -A p r 1 3 -A p r 1 4 -A p r 1 5 -A p r 1 6 -A p r 1 7 -A p r 1 8 -A p r 1 9 -A p r 2 0 -A p r 2 1 -A p r 2 2 -A p r 2 3 -A p r 2 4 -A p r 2 5 -A p r 2 6 -A p r 2 7 -A p r T h ro u g h p u t
MENB S28 ME NBS 36 MENBS37 MIMB S17 MIMBS26 MIMB S41 MIMBS47 MENB S21
```
UL_Thruput_TBF-KOGI & RIVER-BSC Busy Hours
0 5 10 15 20 25 2 9 -M a r 3 0 -M a r 3 1 -M a r 1 -A p r 2 -A p r 3 -A p r 4 -A p r 5 -A p r 6 -A p r 7 -A p r 8 -A p r 9 -A p r 1 0 -A p r 1 1 -A p r 1 2 -A p r 1 3 -A p r 1 4 -A p r 1 5 -A p r 1 6 -A p r 1 7 -A p r 1 8 -A p r 1 9 -A p r 2 0 -A p r 2 1 -A p r 2 2 -A p r 2 3 -A p r 2 4 -A p r 2 5 -A p r 2 6 -A p r 2 7 -A p r T h ro u g h p u t
MKGBS01 MKGBS05 MKGBS43 MRVBS04 MRVBS13 M RVBS24 MRVBS32 MRVBS33 MRVBS35 MRVBS48
````
DL_Thruput_TBF-KOGI & RIVER-BSC Busy Hours
0 5 10 15 20 25 30 35 40 45 50 2 9 -M a r 3 0 -M a r 3 1 -M a r 1 -A p r 2 -A p r 3 -A p r 4 -A p r 5 -A p r 6 -A p r 7 -A p r 8 -A p r 9 -A p r 1 0 -A p r 1 1 -A p r 1 2 -A p r 1 3 -A p r 1 4 -A p r 1 5 -A p r 1 6 -A p r 1 7 -A p r 1 8 -A p r 1 9 -A p r 2 0 -A p r 2 1 -A p r 2 2 -A p r 2 3 -A p r 2 4 -A p r 2 5 -A p r 2 6 -A p r 2 7 -A p r T h ro u g h p u t
MKGBS01 MKGBS05 MKGBS43 MRVBS04 MRVBS13 MRVBS24 MRVBS32 MRVBS33 MRVBS35 MRVBS48
````
ISSN 1597-6343
A summary of the average throughput range obtained from the various base stations are tabulated in Table 1:
Table 1 shows that some locations within the study area did not transmit or showed poor transmissions (had zero
throughput values), both at the uplink and downlink. Our findings revealed that the overall average throughputs in the uplink and downlink were not impressive (majority were below 20 kbps).
Table 1. Summary of the average throughput range for the various base stations within the study area.
Location
Uplink Downlink
Min Max Min Max
Abia and Akwa Ibom 0.80 15.96 0.53 46.50
Benue and Anambra 4.99 18.82 18.26 49.98
Bayelsa and Cross River 3.08 16.74 8.39 52.14
Delta and Ebonyi 0.00 16.41 0.00 44.05
Enugu and Imo 5.84 20.83 20.21 69.70
Kogi and Rivers 0.00 16.62 0.00 49.59
Average throughput 3.68 17.56 11.85 51.99
In judging the sharing of bottlenecks in the system, we applied a figure of merit known as the throughput fair index. Given a resource allocation schedule, the fairness index is a real number that measures how fair or unfair the network resource is shared among the competing hosts. We define this index in consonance with the Jain’s fairness index (Jain, Chiu and Hawe, 1984) as follows:
Ni i N
i i
T
N
T
FI
1 2 2 1
.
)
(
(18)
where
N is the number of cells
Ti is the throughput of the ith cell
From the relationship above, it is expected that as FI increases, the better fairness the system can gain. Considering uplink transmissions, the throughput fairness index of the operational network is:
while the throughput fairness index for the downlink transmission is:
%
97
42171.93
49
1999474
FI
From these computations, we discovered that there was equal sharing of bottlenecks in the system (at both uplink and downlink transmissions), but there also exist some unseen bottlenecks elsewhere in the system, as evident in the low (overall) throughput experienced by the system. A solution to this problem is to impose an optimal fairness criteria at each node.
SIMULATION INPUT AND RESULTS SIMULATION INPUT
The simulation inputs for this paper is shown in Table 2. The values were empirical evidence obtained from an ideal CDMA network. The simulation of the proposed model enabled the emulation of the system under study and the investigation of why the system still experienced some challenges even when there was fair sharing of bottlenecks at both transmission phases within the system..
Table 2. Simulation input parameters and values
Parameter Value
Bandwidth (Mbps) 1, 3, 5.
Modulated signal carrier 4-QAM.
Signal-to-noise ratio 2 – 20.
Symbol time 0.05 – 0.5.
RESULTS AND DISCUSSION
The Shannon-Hartley theorem gives the theoretical tightest upper-bound on the data/information rate (excluding error correction codes) of clean (or arbitrarily low bit error rate) – data that can be transferred with a given average signal power, S, through an analog communication channel subject to Additive White Gaussian Noise (AWGN) of power, N. The above description implies that at higher SNRs, we expect a constant rise in capacity as the bandwidth improves, and more power is required in the presence of noise to achieve the same capacity.
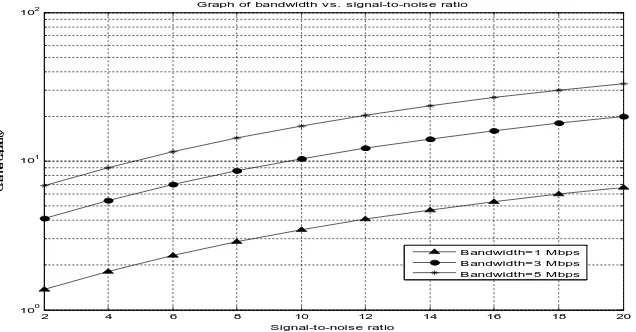
In Fig. 9, the effect of interference on channel capacity, at specific bandwidths is studied. We observed that the channel capacity increased with incease in SNR, but only limited users could access the network (even with improved bandwidth); which led to a reduction in the amount of error-free digital data at specified bandwidth in the presence of noise.
%
95
5761.24
49
268290.3
ISSN 1597-6343
Fig. 9. Graph of channel capacity vs. SNR – Shannon model
Increasing the signal power involves splitting the signal level into multiple levels even while ensuring low probability of error. The effect of this is a corresponding rise in capacity. However, as observed in Fig. 9, the coverage capacity is a logarithmic function of power, and any further increase in capacity will certainly diminish the system performance. Increasing the bandwidth allocation, therefore has two effects: (i) more transmissions per second, and hence, higher capacity, (ii) increased noise power at the receiver.
Fig. 10. shows that as the bandwidth allocation increased in the presence of interference, the throughput of the system degraded instead of improving. This indicates that at higher SNRs, there is no gain allocating more bandwidth to the network, as increased noise is most likely to influence the coverage distance and degrade the system performance. If the noise power is maintained at unity, i.e., a case of no interference (typical of TDMA and FDMA networks); there is
hope to obtain the maximum achievable capacity with increased bandwidth, thus proving the former effect caused by increased bandwidth. A solution to the latter effect is to depend on the overall system reliability, by introducing the
spectral efficiency. This alternative will contribute to boosting
the communication signal. Mathematically, a plot of spectral efficiency vs. energy per bit, Eb/N0) is given as,
0
2
1
log
N
E
r
r
b(19)
where r is the spectral efficiency. Equation (19) would split the graph area in Fig. 10. into two regions. Reliable communication is then possible in the region below the curve, and not possible in the region above the curve. Also, the closer the performance of the communication system is to the curve, the more optimal the system.
Fig. 10. Graph of channel capacity vs. signal-to-noise ratio – Improved model
Transmitted symbols can then be mapped to different quantized samples or constellation points due to the additive noise of the channel, and this contributes to the achievable data rate with oversampling. In this paper, we have introduced the Quadrature Amplitude Modulation (QAM) to improve the bit transmission rate. Fig. 10. Have illustrated
the effect of SNR on channel capacity, at specified bandwidths, using an average mutual information of 4-QAM without a phase shift between the transmitter and the receiver.
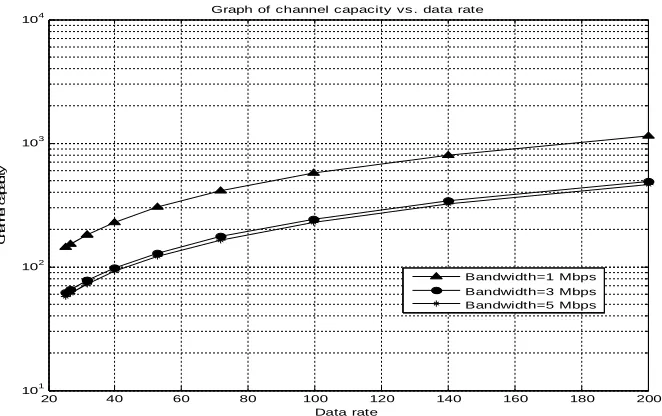
Figs. 11 and 12. show the effect of symbol time and data rate on the channel capacity. We observed that oversampling
2 4 6 8 10 12 14 16 18 20
100
101
102 Graph of bandwidth v s . s ignal-to-nois e ratio
Signal-to-nois e ratio
C
h
a
n
n
e
l
c
a
p
a
c
it
y
B andwidth=1 Mbps B andwidth=3 Mbps B andwidth=5 Mbps
2 4 6 8 10 12 14 16 18 20
101
102
103
104 Graph of c hannel c apac ity v s . s ignal-to-noise ratio
Signal-to-noise ratio
C
h
a
n
n
e
l
c
a
p
a
c
it
y
Bandwidth=1 Mbps Bandwidth=3 Mbps Bandwidth=5 Mbps
ISSN 1597-6343
does not improve the channel capacity. As the bandwith is increased from 1 Mbps to 5 Mbps, the channel capacity shrinks, but maintained a near constant trend for bandwidths of 3-5 Mbps. These results indicate that in order to benefit the network, efforts are required to reverse the decreased channel capacity in the presence increased bandwidth. A solution to the problem is to control users access to the system such that not much interference occurs. But, there still exists a small loss for SNR values in the range of 5 dB to 10 dB (See Fig. 10).
In principle, oversampling reduces the uncertainty of a received symbol by providing more quantized samples per
transmitted symbol. For the Q-AM size simulated in this paper (4-QAM), this effect is dominated by an increased uncertainty as a result of the higher noise variance when compared to the case of symbol-rate sampling. The observation is however different when there is a phase offset between the transmitter and the receiver. When AWGN channel is employed, oversampling yields a signal reception with higher resolution than the quantization would originally allow, with sampling at symbol rate. Higher order modulation schemes with a quantization resolution is therefore necessary, and higher QAMs such as 16-QAM, 64-QAM, etc. would permit a higher achievable data rate than 4-QAM with oversampling.
Fig. 11. Graph of Channel capacity and symbol time – Improved model
Fig. 12. Graph of channel capacity and data rate – Improved model
0.05 0.1 0.15 0.2 0.25 0.3 0.35 0.4 0.45 0.5
101
102
103
104
Graph of channel c apacity v s. sy mbol time
Sy mbol time
C
h
a
n
n
e
l
c
a
p
a
c
it
y
B andwidth=1 Mbps B andwidth=3 Mbps B andwidth=5 Mbps
20 40 60 80 100 120 140 160 180 200
101 102 103
104 Graph of channel capacity vs . data rate
Data rate
C
h
a
n
n
e
l
c
a
p
a
c
it
y
Bandwidth=1 Mbps Bandwidth=3 Mbps Bandwidth=5 Mbps
ISSN 1597-6343
ModelingThe Effect Of Bandwidth Allocation On Network Performance In practical systems, we offer the following remarks: If the
bandwidth of the receiver is below the sampling rate, the additive noise of the channel would correlate well, which is expected to provide minimal improvements. Therefore, even when practical systems possess a higher fair index, impairments such as multi-path fading could inhibit the performance of a system leading to undue congestion. A possible solution would then be to integrate a pseudo-noise signal of the required bandwidth before quantization. Hence, establishing appropriate pseudo-noise signals is a topic for further research.
CONCLUSION
With the proliferation of mobile communication, allocation of resources such as the bandwidth in mobile cellular network has become increasingly important. The CDMA cellular technology have presented numerous challenges to network operators, and deciding the most preferred technique to optimize network resources and increase the network performance remains the most critical of these challenges. This paper has proposed an efficient bandwidth allocation scheme for CDMA networks. The Shannon-Hartley Theorem was used as a basis to derive a simulation model for a functional network environment. The uplink and downlink throughputs of the operational network were also investigated. The simulation model, which represents an improved form of the Shannon-Hartley model was then implemented by extending the test data obtained from the study environment while observing the necessary thresholds for ideal network environmets.
REFERENCES
Ahmed, T., Boutaba, R. and Mehaoua, A. (2005). A Measurement-Based Approach for Dynamic QoS Adaptation in DiffServ Network. Journal of Computer Communications, 28(18): 2020-2033.
Atkins, T. and Escudie, M. (2013). A Dictionary of Mechanical Engineering. Oxford University Press.
Blahut, R. E. (1990). Digital Transmission of Information. Addison Wesley Publishing Company.
Breslau, L., Estrin, D., Fall, K., Floyd, S., Heidemann, J., Helmy, A., Huang, P., McCanne, S., Varadhan, K., Xu, Y. and Yu, H. (2000). Advances in Network Simulation. IEEE Computer Society Press, CA, U.S.A.
Brownlee, N. (1997). Traffic Flow Measurement: Experiences with NeTraMet, RFC2123, http://rfc.net/rfc2123.html.
Campbell, A. T. and Liao, R. R.-F. (2004). Dynamic Core Provisioning for Quantitative Differentiated Services. IEEE/ACM Transactions on Networking, 12(3): 429–442.
Chiang, M. and Bell, J. (2004). Balancing Supply and Demand of Bandwidth in Wireless Cellular Networks: Utility Maximization Over Powers and Rates. In Proceedings of the 23rd Annual
Joint Conference of the IEEE Computer and Communications Societies, 4: 2800-2811.
Chou, C-T. and Shin, K. G. (2004). Analysis of Adaptive Bandwidth in Wireless Networks with Multilevel Degradable Quality of Service. IEEE Transactions on Mobile Computing, 3(1): 5-17.
Isabona J. and Ekpenyong M. (2009). Normalised Bandwidth Evaluation of Single and Multi Code CDMA Systems with Multi-Class Services. International Journal of Numerical Mathematics. 4(1):122-136.
Ismail, I. A., (2000). Bandwidth problems in High-Speed Networks. IBM Journal Research and Development, 44(6): 919-938.
Jain, R., Chiu, D. and Hawe, W. (1984). A Quantitative Measure of Fairness and Discrimination for Resource Allocation in Shared Computer Systems. Tech. Rep. TR-301.
Kamaluddin, K., Sharif, M., and Almaini, A. (2008). Bandwidth Management in Mobile Wireless cellular Network in Heavy Load conditions-Time Slot Division Method. Innovations in Information Technology, IIT.: 510-514.
Kassim, M., and Kassim, H., (2011). An Analysis on Bandwidth Utilization and Traffic Pattern for Network Security Management. Journal of International Conference on Future Information Technology IPCSIT, 13:51-56.
Kelly, F. (1997). Charging and rate control for elastic traffic. European Transactions on Telecommunications, 8: 33–37.
Mahajan, M., Parashar, M. and Ramanathan, A. (2004). Active Resource Management for the Differentiated Services Environment. International Journal of Network Management, 14(3): 149–165.
McCanne, S. and Floyd, S. (2007). Network Simulator NS-2, available at, http://www.isi.edu/nsnam/ns
Qiu, L., Bahl, P. and Adya, A. (2002). The effect of First-Hop Wireless Bandwidth Allocation o End-to-End Network Performance. In ACM Proceedings of NOSSDAV’02, Miami, Florida.
Riley, G. F. (2003). The Georgia Tech Network Simulator. In Proceedings of the ACM SIGCOMM Workshop on Models, Methods and Tools for Reproducible Network Research, Karlsruhe, Germany.
Schulzrinne, H. and Wang, X. (2005). Incentive-Compatible Adaptation of Internet Real-Time Multimedia. IEEE Journal on Selected Areas in Communications, 23(2): 417–436.
Wang, W., Wang, X. and Nilsson, A. A. (2006). Energy-Efficient Bandwidth Allocation in Wireless Networks: Algorithms, Analysis and Simulations. IEEE Transactions on Wireless Communications. 5(5): 1103-1111.
Wombell, S. (1999). Network Capacity Planning. IEEE Review, 45(2): 79-80.