Natural Hazards and Earth System Sciences (2003) 3: 491–503
© European Geosciences Union 2003
Natural Hazards
and Earth
System Sciences
Rockfall hazard and risk assessment in the Yosemite Valley,
California, USA
F. Guzzetti1, P. Reichenbach1, and G. F. Wieczorek2
1CNR – IRPI, via della Madonna Alta, 126, 06128 Perugia, Italy
2U.S. Geological Survey, National Center – MS 926A, Reston, Virginia, USA
Received: 27 August 2002 – Revised: 11 November 2002 – Accepted: 12 November 2002
Abstract. Rock slides and rock falls are the most frequent
types of slope movements in Yosemite National Park, Cal-ifornia. In historical time (1857–2002) 392 rock falls and rock slides have been documented in the valley, and some of them have been mapped in detail. We present the results of an attempt to assess rock fall hazards in the Yosemite Valley. Spatial and temporal aspects of rock falls hazard are consid-ered. A detailed inventory of slope movements covering the 145-year period from 1857 to 2002 is used to determine the frequency-volume statistics of rock falls and to estimate the annual frequency of rock falls, providing the temporal com-ponent of rock fall hazard. The extent of the areas potentially subject to rock fall hazards in the Yosemite Valley were ob-tained using STONE, a physically-based rock fall simulation computer program. The software computes 3-dimensional rock fall trajectories starting from a digital elevation model (DEM), the location of rock fall release points, and maps of the dynamic rolling friction coefficient and of the coefficients of normal and tangential energy restitution. For each DEM cell the software calculates the number of rock falls pass-ing through the cell, the maximum rock fall velocity and the maximum flying height. For the Yosemite Valley, a DEM with a ground resolution of 10×10 m was prepared using topographic contour lines from the U.S. Geological Survey 1:24 000-scale maps. Rock fall release points were identified as DEM cells having a slope steeper than 60◦, an assumption based on the location of historical rock falls. Maps of the nor-mal and tangential energy restitution coefficients and of the rolling friction coefficient were produced from a surficial ge-ologic map. The availability of historical rock falls mapped in detail allowed us to check the computer program perfor-mance and to calibrate the model parameters. Visual and statistical comparison of the model results with the mapped rock falls confirmed the accuracy of the model. The model results are compared with a previous map of rockfall talus and with a geomorphic assessment of rock fall hazard based on potential energy referred to as a shadow angle approach,
Correspondence to: F. Guzzetti (F.Guzzetti@irpi.cnr.it)
recently completed for the Yosemite Valley. The model re-sults are then used to identify the roads and trails more sub-ject to rock fall hazard. Of the 166.5 km of roads and trails in the Yosemite Valley 31.2% were found to be potentially subject to rock fall hazard, of which 14% are subject to very high hazard.
1 Introduction
Yosemite National Park, in central California, is frequently affected by landslides, of which rock slides and rock falls are the most common types. In addition to damaging roads, trails, and other facilities in Yosemite National Park, rock falls endanger some of the more than 3 million annual vis-itors. During the period of 1857–2002, ten people have been killed and at least 20 seriously injured by rock falls in the Yosemite Valley. To ascertain the rock fall hazard in Yosemite National Park, the U.S. Geological Survey (USGS) and the U.S. National Park Service (NPS) have compiled a catalogue of historical landslides (Wieczorek et al., 1992). The inventory is regularly updated whenever a new landslide is reported in the valley. More recently, an attempt to as-sess the rock fall hazard based on the shadow angle approach (Evans and Hungr, 1993) was completed by Wieczorek et al. (1998; 1999), and incorporated in the Yosemite Valley Plan prepared by the U.S. National Park Service (2000).
492 F. Guzzetti et al.: Rockfall hazard and risk assessment
A
Yosemite Village
El Portal
B
A
A
Yosemite Village
El Portal
B
Yosemite Village
El Portal
Yosemite Village
El Portal
B
Fig. 1. (a) Location map. (b) Shaded relief image of the Yosemite
Valley and the surrounding areas. Yellow line shows approximate location of Fig. 7.
2 The study area
The Yosemite Valley is in the previously glaciated head-ward segment of the Merced River canyon in central Sierra Nevada, California (Fig. 1). The valley has very steep rock cliffs, 1000 m high or more, as well as moderately steep slopes mantled with deposits of colluvial soils and rocky talus. The most recent (Tioga) glaciation peaked between 28 000 and 17 000 year BP and only partially filled the Yosemite Valley. Below this most recent level of glacia-tion, the cliffs are very steep and nearly devoid of vegeta-tion. Above this level, the cliffs are less steep and there is extensive root penetration into the jointed, weathered rock.
The rocks of Yosemite Valley consist of Cretaceous granitic rocks, including granite, granodiorite, and diorite (Matthes, 1930; Huber, 1987). Jointing has influenced the landforms on both regional and local scales. The more
siliceous rocks, granite and granodiorite, have more widely spaced joints than the less siliceous rocks. On an individual outcrop scale, jointing influences the orientation of cliff faces and the size and shape of blocks, and thus contributes to their tendency to fall or slide.
Reported slope movements in Yosemite, excluding those caused by earthquakes, often reflect the strong seasonal cli-mate. The majority of slope movements occur during the wetter and colder six months of the season between Novem-ber and April. Additionally, earthquakes along the eastern flank of the Sierra Nevada have been strong enough to trig-ger rock falls and slides in four historic earthquakes felt in Yosemite Valley (Wieczorek and J¨ager, 1996).
3 Background and method
In a well-known report, Varnes and the IAEG Commission on Landslides and other Mass Movements (1984) proposed to define landslide hazard as “the probability of occurrence within a specified period of time and within a given area of a potentially damaging phenomenon”. This widely accepted definition of landslide hazard incorporates the concepts of lo-cation, i.e. where a landslide will occur, and time, i.e. when, or how frequently a landslide will occur (Guzzetti et al., 1999). Completing a landslide hazard assessment that fully complies with this definition of landslide hazard is difficult. Most of the attempts aimed at evaluating landslide hazard quantitatively (i.e. in probabilistic or deterministic fashion) provide estimates of the spatial distribution of landslides, but do not say anything about the temporal occurrence of slope failures. Statistically based methods predict where landslides will occur in the future based on where landslides have oc-curred in the past (inventory maps), and deterministic meth-ods predict where landslides may occur based on simple me-chanical laws (Guzzetti et al., 1999). Conversely, when a detailed catalogue of historical landslide events is available the average recurrence interval between slope failures can be determined. Assuming that the frequency of movements will remain the same in the future, and adopting a probabil-ity model (e.g. Poisson), the probabilprobabil-ity of future landslide events can be determined (Coe et al., 2002). This provides an estimate of the temporal occurrence of landslides.
F. Guzzetti et al.: Rockfall hazard and risk assessment 493
Fig. 2. Rock fall on 13 June 1999 above Curry Village, Yosemite
Valley, California. The failure involved 213.4 m3of granitic rock.
Photograph by Lloyd De Forrest (used with permission).
rock falls in the Yosemite Valley. This is described in Sect. 5 and provides the spatial component of the rock fall hazard assessment. In Sect. 6 we attempt a combined analysis of the spatial and temporal aspects of rock fall hazards, and we determine quantitatively the rock fall risk for the roads and trails in the Yosemite Valley.
4 Frequency of rock falls
A total of 463 single or multiple historical landslide events (mostly rock falls and rock slides) have been documented in Yosemite National Park during the last 145 years. Table 1 summarizes the number and volume characteristics of the historical slope failures in the Yosemite Valley, and Fig. 2 shows a typical example of a rock fall detaching from a steep granitic rock wall and falling on the talus slope.
The inventory of slope movements was assembled from observations and historical accounts (Wieczorek et al.,
1992). Historical reports of slope-movement events are fre-quently fragmentary or inconsistent. Most often the reports concentrate on events that damaged trails and roads, and con-sequently underestimated the number of events. Early ac-counts by occasional visitors to Yosemite described primarily the larger slope movement events; more systematic recording of both large and small events began after 1915 with prepa-ration of the National Park Superintendents reports.
Beginning in 1980, following the Mammoth Lakes earth-quake sequence which triggered nine rock falls and slides in Yosemite Valley, the USGS, in conjunction with the NPS, began more detailed site studies of rock fall sites. Special attention has been paid to identifying the release, path, and depositional areas of rock falls. Interpretation of aerial pho-tographs and field studies of rock falls have been used to pre-pare maps showing both prehistoric and historical rock falls (Wieczorek et al., 1998, 1999).
Most of the landslides reported in the historical inventory were rock slides (54.9%) and rock falls (29.8%), followed by debris flows (8.0%) and by debris slides (5.6%). The distinc-tion between some of the landslide types (e.g. rock fall and rock slide, or debris slide and debris flow) is affected by un-certainty in the description of the event, particularly for the oldest failures.
Limiting the analysis to the landslide types of interest to the present work, i.e., rock falls and rock slides, the landslide volumes range from 0.1 to 600 000 m3, with average values of∼14 000 m3 for rock falls and∼1400 m3for rock slides (Table 1). In the catalogue the precise date of occurrence was available for 380 landslide events. Figure 3a shows the yearly distribution of 126 rock falls (black squares) and 254 rock slides (open squares) for which the volume and the year of occurrence were known. The graph reveals problems in the data set.
494 F. Guzzetti et al.: Rockfall hazard and risk assessment
Table 1. Main characteristics of the 468 landslides reported in the Yosemite Valley, California (Wieczorek et al., 1992)
H
istori
cal
(1
867–2
002)
Landslide type Count % Volume (m3)
Min Max Average
Single or multiple debris flows 37 8.0 20 8,575 1,047
Single or multiple debris slides 26 5.6 20 2,000 440
Debris slump 2 0.4 200 200 200
Earth slide 1 0.2 950 950 950
Earth slump 1 0.2 200 200 200
Single or multiple rock falls 138 29.8 0.1 600,000 13,975
Single or multiple rock slides 254 54.9 1.0 100,000 1,404
Rock/debris slides 3 0.6 20.0 9,182 3,134
Rock slump 1 0.2 200 200 200
All historical landslides 463 0.1 600,000 4,864
Rock avalanche (prehistoric) 5 1.1 430,000 11,370,000 3,412,000
All landslides (including Rock av.) 468 0.1 11,370,000 27,578
accounts. Despite these problems associated with the accu-racy of the volumetric data, the available catalogue is most probably the best inventory of rock falls and rock slides in North America, and one of the few available in the world (Doussage-Peisser et al., 2002b and references herein).
Figure 3b shows the cumulative landslide volume for the period 1857–2002. A total volume of 1 470 481 m3of rock was involved (i.e. eroded) by rock falls or rock slides. This corresponds to a yearly erosion rate of about 10 140 m3/year, comparable with the erosion rate of 18 900 m3/year com-puted by J¨ager (1997) for the last 15 000 years, based on the evaluation of the size of the alluvial and rock talus cones (Wieczorek and J¨ager, 1996). Considering a terrain steeper than 45◦as a possible source of rock falls and correcting for
the terrain gradient, one can estimate that rock cliffs in the Yosemite Valley have an area of at least 40 km2. Therefore the erosion rate due to rock falls and rock slides in the last 145 years is calculated to be 0.25 mm/year. This figure is in good agreement with the estimate of 0.22 mm/year±27% computed by J¨ager (1997) for Yosemite Valley cliffs during the last 15 000 years. Figure 3b also shows that the cumu-lative curve of landslide volume is strongly dominated by the largest events, particularly by a rock fall of 600 000 m3 caused by an unrecognised trigger on 10 March 1987.
Information on the volume of historical rock falls and rock slides allows for estimations of the annual frequency of events, and of the frequency-magnitude statistics of rock falls in Yosemite National Park. Figure 4 shows the annual frequency of landslides exceeding a given volume against the landslide volume; i.e. the frequency vs. consequences of landslides (Fell and Hartford, 1997). Curves for different time spans are shown, namely: 23, 93 and 145 years. Varia-tion in the annual frequency for the different time spans re-flects the completeness of the historical catalogue. Limiting the analysis to the period 1980–2002, when the data set can
reasonably be considered complete, one can see that approx-imately 6 rock falls exceeding 1 m3, 3 rock falls exceeding 100 m3, and 0.5 rock falls exceeding 10 000 m3are expected annually in the Yosemite Valley. The location of the land-slides remains unknown. The dataset for the 23 year time period from 1980 to 2002 (grey squares) can be fitted by a power law, y = 12.9×VL−0.40 (R2 = 0.972), that can be used to estimate the rock fall risk in the Yosemite Valley.
F. Guzzetti et al.: Rockfall hazard and risk assessment 495 1.E-02 1.E-01 1.E+00 1.E+01 1.E+02 1.E+03 1.E+04 1.E+05 1.E+06
1855 1860 1865 1870 1875 1880 1885 1890 1895 1900 1905 1910 1915 1920 1925 1930 1935 1940 1945 1950 1955 1960 1965 1970 1975 1980 1985 1990 1995 2000
Volume (m 3) 1.E+05 3.E+05 5.E+05 7.E+05 9.E+05 1.E+06 1.E+06 2.E+06 Cumulative Vo lu me (m 3)
A
1855 1860 1865 1870 1875 1880 1885 1890 1895 1900 1905 1910 1915 1920 1925 1930 1935 1940 1945 1950 1955 1960 1965 1970 1975 1980 1985 1990 1995 2000
Year
B
1.E-02 1.E-01 1.E+00 1.E+01 1.E+02 1.E+03 1.E+04 1.E+05 1.E+06 1.E-02 1.E-01 1.E+00 1.E+01 1.E+02 1.E+03 1.E+04 1.E+05 1.E+061855 1860 1865 1870 1875 1880 1885 1890 1895 1900 1905 1910 1915 1920 1925 1930 1935 1940 1945 1950 1955 1960 1965 1970 1975 1980 1985 1990 1995 2000
1855 1860 1865 1870 1875 1880 1885 1890 1895 1900 1905 1910 1915 1920 1925 1930 1935 1940 1945 1950 1955 1960 1965 1970 1975 1980 1985 1990 1995 2000
Volume (m 3) 1.E+05 3.E+05 5.E+05 7.E+05 9.E+05 1.E+06 1.E+06 2.E+06 1.E+05 3.E+05 5.E+05 7.E+05 9.E+05 1.E+06 1.E+06 2.E+06 Cumulative Vo lu me (m 3)
A
1855 1860 1865 1870 1875 1880 1885 1890 1895 1900 1905 1910 1915 1920 1925 1930 1935 1940 1945 1950 1955 1960 1965 1970 1975 1980 1985 1990 1995 2000
Year
B
Fig. 3. Temporal distribution of rock falls and rock slides in the
Yosemite Valley, California, for the period 1857–2002. (a) Volume of 126 rock falls (black squares) and 254 rock slides (open squares) for which the year of occurrence is known. (b) Cumulative volume of rock falls and rock slides.
5 Spatial rock fall hazard model
5.1 Modelling software
To assess rock fall hazard spatially in the Yosemite Valley we used STONE, a physically-based computer program ca-pable of simulating in three-dimensions rock fall processes. The software, described in detail elsewhere (Guzzetti et al., 2002a), uses a lumped mass approach to simulate the falling of a boulder along topography described by a Digital Eleva-tion Model (DEM). The falling boulder is considered dimen-sionless and a kinematic simulation of the rock fall process is performed.
STONE computes 3-dimensional rock fall trajectories and spatially distributed raster maps showing the kinematics (ve-locity and height) and frequency of rock falls. The software can model three of the four states that a rock fall can take, namely: the free fall of a boulder along parabolic trajecto-ries, the impact of the boulder with the ground and the sub-sequent rebound, and the rolling of a boulder along the slope. Sliding is not modelled because it is considered to be a negli-gible part of the rock fall movement process (Guzzetti et al., 2002a).
The input data required by STONE are similar to the infor-mation required by other rock fall simulation programs (e.g. Descouedres and Zimmermann, 1987; Pfeiffer and Bowen,
y = 12.9 VL-0.40
0.001 0.01 0.1 1 10
0.01 0.1 1 10 100 1,000 10,000 100,000 1,000,000
Rock fall volumes, VL(m3)
Annu al freque ncy o f rock fal ls w ith vol ume l arger th an VL
1910 - 2002 1857 - 2002 1980 - 2002
y = 12.9 VL-0.40
0.001 0.01 0.1 1 10
0.01 0.1 1 10 100 1,000 10,000 100,000 1,000,000
Rock fall volumes, VL(m3)
Annu al freque ncy o f rock fal ls w ith vol ume l arger th an VL
1910 - 2002 1857 - 2002 1980 - 2002 1910 - 2002 1910 - 2002 1857 - 2002 1857 - 2002 1980 - 2002 1980 - 2002
Fig. 4. Annual frequency of rock falls and rock slides vs. landslide
volume. Symbols indicate different time intervals in the historical catalogue. The power law is fitted to the 1980–2002 data set, for
rock fall volumes greater than 50 m3.
Landslide Volume, VL(m3)
Fre quenc y Densit y, d (VL ) ( m -3) 1.E-07 1.E-06 1.E-05 1.E-04 1.E-03 1.E-02 1.E-01 1.E+00 1.E+01 1.E+02 1.E+03
1.E-02 1.E-01 1.E+00 1.E+01 1.E+021.E+03 1.E+04 1.E+051.E+06 1.E+07 d(VL) = 10 VL-1.1
Landslide Volume, VL(m3)
Fre quenc y Densit y, d (VL ) ( m -3) 1.E-07 1.E-06 1.E-05 1.E-04 1.E-03 1.E-02 1.E-01 1.E+00 1.E+01 1.E+02 1.E+03
1.E-02 1.E-01 1.E+00 1.E+01 1.E+021.E+03 1.E+04 1.E+051.E+06 1.E+07 d(VL) = 10 VL-1.1
1.E-07 1.E-06 1.E-05 1.E-04 1.E-03 1.E-02 1.E-01 1.E+00 1.E+01 1.E+02 1.E+03 1.E-07 1.E-06 1.E-05 1.E-04 1.E-03 1.E-02 1.E-01 1.E+00 1.E+01 1.E+02 1.E+03
1.E-02 1.E-01 1.E+00 1.E+01 1.E+021.E+03 1.E+04 1.E+051.E+06 1.E+07 1.E-02 1.E-01 1.E+00 1.E+01 1.E+021.E+03 1.E+04 1.E+051.E+06 1.E+07
d(VL) = 10 VL-1.1
Fig. 5. Frequency density of rock falls (squares) and of rock slides
(triangles). Black symbols represent the entire catalogue. Open symbols the period 1980–2002, for which the catalogue is com-pete and reliable. The grey diamond represents 5 prehistoric rock avalanches. The dashed grey line is a power law fit with exponent,
β= −1.1.
496 F. Guzzetti et al.: Rockfall hazard and risk assessment for modelling the loss of energy at impact points and for
rolling are provided in a spatially distributed (i.e. geograph-ical) form. As a result, the outputs produced by STONE are also spatially distributed.
STONE can simulate the inherent natural variability of rock falls in two ways: by launching a variable number of blocks (from 1 to 1000) from each detachment cell, i.e. sim-ulating a different frequency (or probability) of occurrence of rock falls; and by varying randomly, within pre-defined ranges, the starting horizontal angle, the dynamic rolling fric-tion coefficient, and the normal and tangential energy restitu-tion coefficients. The combinarestitu-tion of these two possibilities makes the software very flexible, allowing for simulations of different complexity (Guzzetti et al., 2002a).
STONE uses GIS technology to produce 2- and 3-dimensional (vector) rock fall trajectory lines and raster maps of the same size and resolution of the input grids. For each grid cell the raster output maps show: the cumulative count of rock fall trajectories that passed through the cell, the max-imum computed velocity, and the largest flying height (dis-tance above the ground) computed along all of the rock fall trajectories.
Portraying the areas that can be impacted by falling or rolling blocks, the maps provide a spatial prediction of rock fall hazard. In particular, the map showing the count of rock fall trajectories is a proxy for the probability of occurrence of rock falls. For any given cell the map portrays the chance of being crossed (or hit) by a falling boulder. The maps showing the maximum computed rock fall velocity and the maximum computed flying height provide information on the (maxi-mum) expected intensity of a rock fall, a proxy for the max-imum kinetic energy expected at each grid cell. A rock fall flying at high speed well above the ground is potentially more destructive than a boulder of the same size rolling slowly on the ground.
For the assessment of rock fall hazard in the Yosemite Val-ley only the map of rock fall counts was used, because unlike other situations, such as highway cuts, fences designed to catch boulders with a particular velocity or height of flight are not typically employed as mitigation measures in Na-tional Parks.
5.2 Application of the rock fall model to Yosemite Valley The information required by STONE to complete the rock fall simulation was obtained from existing topographic and thematic maps. The DEM describing topography was pre-pared by the USGS as a Level 2 DEM (i.e. maximum al-lowed RMSE one-half contour interval, and no error greater than one contour interval) by interpolating the 40 feet in-terval (∼13 meters) contour lines obtained from the stan-dard 1:24 000 scale topographic maps Yosemite Falls, Half Dome and El Capitan. Ground resolution of the DEM was 10×10 m, half of the resolution of the standard USGS DEM obtained by interpolating the 7.5’ Quadrangles. Comparison of the DEM with the original contour lines revealed a reason-ably good agreement both in low gradient terrain (i.e. in the
valley bottom and in the glaciated plateau) and where terrain was steep (i.e. in the rock cliffs and the valley sides).
Detailed, spatially distributed information on the location of the rock fall release areas was not available. The catalogue of historical landslides reports information on the location of the detachment areas of rock falls and rock slides only for a very limited number of events (Wieczorek et al., 1992). A few oblique and horizontal photographs showing the location of rock fall source areas exist but a systematic analysis of this information is difficult because of the gradual weathering and modification of source areas and the inability to distinguish separate events over historic (and prehistoric) time.
To identify the location of potential rock fall source cells we used the DEM. We experimented with various combina-tions of slope gradient and thematic maps, and the best re-sults were obtained selecting the DEM cells having slopes steeper than 60◦. This rather simple approach allowed
iden-tifying 61 435 grid cells (10×10 m) as possible sources of rock falls, i.e. 6.14 km2, in plan view; approximately 7% of the Yosemite Valley. Correcting for the steep topographic gradient, this is an area of about 19.1 km2. Inspection of the map of the rock fall source cells revealed a good agreement with the local morphology, and in particular with the loca-tion of the edges of the rock cliffs and with the localoca-tion of the release areas of known rock fall events.
The parameters used to model the loss of velocity at the impact points (i.e. the normal and tangential energy resti-tution coefficients) and where a boulder is rolling (i.e. the dynamic friction angle) were obtained by recoding a com-bination of existing bedrock, surface geology and landslide inventory maps. For this purpose, a map of unique condition units was produced in a GIS by superimposing (merging) a landslide inventory map (Wieczorek et al., 1998, 1999) and the geologic map of Matthes (1930) containing information on talus and alluvial deposits. For each terrain unit values of the normal and tangential energy restitution coefficients and of the dynamic friction angle were first obtained from infor-mation available in the literature (Broili, 1973; Fornaro et al., 1990; Chau et al., 2002) and then calibrated. Tables 2 and 3 summarize the values of the dynamic rolling friction angle, the normal and tangential energy restitution coefficients as-signed to each terrain type, and the initial modelling condi-tions, respectively.
F. Guzzetti et al.: Rockfall hazard and risk assessment 497
Table 2. Values of the dynamic rolling friction angle and of the normal and tangential energy restitution assigned to each terrain type in the
Yosemite Valley. Landslide types (a) were obtained from Wieczorek et al., 1998. Other lithological types (b) were obtained from Matthes, 1930
Terrain type Rolling Normal Tangential
friction restitution restitution
a Recent debris flow 0.65 30 50
a Recent rock fall and rock slide 0.75 35 55
a Rock fall path 0.30 65 80
a Landslide scar 0.20 65 80
a Historical debris slide 0.60 30 55
a Historical rock fall and rock slide 0.75 40 60
a Prehistorically debris flow 0.60 35 60
a Prehistorically rock fall and rock slide 0.70 35 55
a Prehistorically rock avalanche 0.60 40 60
b Talus deposit 0.70 35 55
b Bedrock 0.30 65 80
b Alluvial deposit 0.85 15 20
Table 3. Initial modelling conditions and parameters used by the computer program STONE to perform the simulation
Parameter Value(s) Notes
Elevation matrix file (DTM) dem.asc
Start/Stop matrix file source 10.asc
Vertical elasticity matrix file restit-n r.asc
Horizontal elasticity matrix file restit-t r.asc
Friction matrix file (tan(β)) friction r.asc
Start velocity (gunshot) 4 m sec−1
Minimum velocity (stop below) 1.5 m sec−1
Fly/roll transition thresholds: distance & velocity 3.0 8.0 m & m sec−1
Fly internal tabulation 2.0 meter
Roll internal tabulation 2.0 meter
Output tabulation (distance between points) 4.0 meter
Path array size 10 000 Memory parameter
Generate 3-D vector files (µStation) 0 NO
Generate 2-D vector files (Arc/Info) 0 NO
Stochastic flag 1 YES
Stochastic ranges starting angle, vrest, hrest, frict 4 5 5 5 percent
starting velocity, impact and friction coefficients, etc.), until the result was judged satisfactory, i.e. the extent and shape of the simulation matched the field mapping, the number of rock fall trajectories falling outside the mapped area was re-stricted, and the model parameters and initial conditions were within reasonable values.
Figure 6a shows the comparison between the mapped (thick black line) and the simulated (colours) of the rock fall that occurred on 14 September 2001. The rock fall involved approximately 17.1 m3 of granitic rock and was the second of a series of 3 events. The other failures occurred on 15 August 2001 and on 25 September 2001. The detachment area was originally identified above the Ledge Trail, at an elevation of approximately 6200 feet (1890 m). To get a
bet-ter agreement with the mapped landslide deposit, the rock fall release point was moved a few tens of meters to the east-southeast. This is considered acceptable because the rock fall release point was identified and mapped in the field from the bottom of the slope; a position from where the lack of clear reference points on the 1:24 000 topographic maps may have easily produced a slightly inaccurate mapping of the location of the release point.
498 F. Guzzetti et al.: Rockfall hazard and risk assessment
via della Madonna Alta 126 •••• 06128 PERUGIA •••• Italy Tel. +39 75 501.4413 •••• Fax. +39 75 5014.420
New Figure 6.
M ode l v s. M ap pin g
4 3 3 5 3 4 7
21 13 9 8 8 5 3
0% 20% 40% 60% 80% 100%
1-2 3-5 6-10 11-25 26-50 51-100 >100
Categories of number of boulders within each class
A
4 5 3 6 2 2 70
5 2 3 9 2 4 8
0% 20% 40% 60% 80% 100%
1-2 3-5 6-10 11-25 26-50 51-100 >100
Categories of number of boulders within each class
M ode l v s. M ap pin g
B
M ode l v s. M ap pin g4 3 3 5 3 4 7
21 13 9 8 8 5 3
0% 20% 40% 60% 80% 100%
1-2 3-5 6-10 11-25 26-50 51-100 >100
Categories of number of boulders within each class
A
M ode l v s. M ap pin g4 3 3 5 3 4 7
21 13 9 8 8 5 3
0% 20% 40% 60% 80% 100%
1-2 3-5 6-10 11-25 26-50 51-100 >100
Categories of number of boulders within each class
A
4 5 3 6 2 2 70
5 2 3 9 2 4 8
0% 20% 40% 60% 80% 100%
1-2 3-5 6-10 11-25 26-50 51-100 >100
Categories of number of boulders within each class
M ode l v s. M ap pin g
B
4 5 3 6 2 2 70
5 2 3 9 2 4 8
0% 20% 40% 60% 80% 100%
1-2 3-5 6-10 11-25 26-50 51-100 >100
Categories of number of boulders within each class
M ode l v s. M ap pin g
B
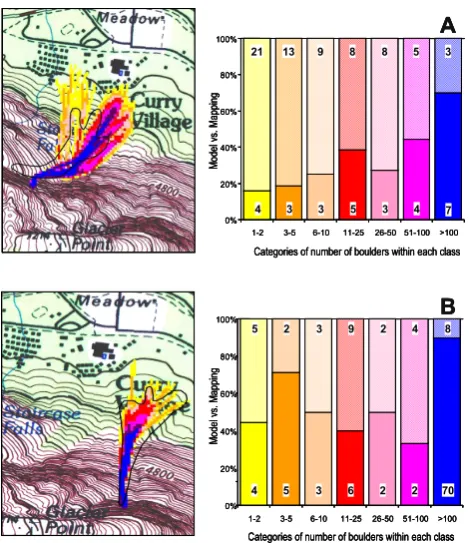
Fig. 6. Comparison between the mapped landslides (thick black
line) and the simulated rock falls (colours) near Curry Village. (a) Ledge Trail rock fall of 14 September 2001. (b) Glacier Point rock fall of 16 November 1998. Original scale 1:24 000. Histograms show the number of cells falling inside (solid colour) and outside (oblique pattern) the mapped landslide. Figures in the coloured bars are number of cells.
on 25 May 1999, on 13 June 1999 and on 29 August 2000 (Wieczorek and Snyder, 1999).
Visual inspection of the maps of Fig. 6 suggests that the rock fall simulations fit quite well the extent and the general shape of the mapped deposits. Differences are larger for the Ledge Trail rock fall. This could be the result of inaccurate mapping, inexact representation of topography by the DEM, larger modelling errors, or a combination of all the above. To quantify the matching (or mismatching) between the mapped and modelled rock fall maps we compared the number of cells inside the rock fall deposit (black line) and the num-ber of cells outside the rock fall deposits. The histograms in Figs. 6a and 6b show that, in general, the correlation is good for the cells where numerous rock falls trajectories are expected (i.e. >10 boulders), and is poorer where only a few rock falls are expected, i.e. 1–5 boulders out of the 100 launched from each source cell.
Between 600 and 1000 rock fall trajectories were com-puted for each rock fall detachment area (i.e. 100 blocks were launched from each of the 6–10 rock fall source cells). This explains why the extent of the simulated rock fall is always larger than the failure mapped in the field, which had proba-bly a smaller volume.
The second step in model calibration involved the
produc-tion of a rock fall model for the entire Yosemite Valley study area. The same model parameters and initial conditions used to model the localized, historical rock fall events were ap-plied to the entire study area (Table 3). This was done for computational efficiency. The only difference was that only 10 boulders were launched from each rock fall source cell. Despite the differences in the abundance of historical rock falls from the various rock units cropping out in the area, no distinction was made of the number of rock falls launched from each source cell. A random variability of 5% around the given values was allowed to cope with the unpredictability in the modelling parameters (i.e. normal and tangential energy restitution coefficients and dynamic friction angle, see Ta-ble 2).
The map of the cumulative count of the rock fall trajecto-ries (Fig. 7) was then visually inspected and compared with the extent of the talus deposits (Matthes, 1930; Wieczorek et al., 1999). To validate the model the map of the count of the rock fall trajectories was also compared with the lo-cation of 34 single outlying boulders mapped in the field (Wieczorek et al., 1998). These were particularly abundant near the Yosemite Lodge and near the Curry Village (Fig. 7). The comparison showed that the extent of the expected rock fall areas and the frequency of rock fall trajectories fit with the available information on historical events and the location of single rock fall boulders. Within several areas of study in parts of Yosemite Valley (eastern part of Yosemite Val-ley, Yosemite Lodge, and Taft Toe-El Capitan Meadow) only three single outlying boulders (two near El Capitan Meadow and one near the Ahwahnee Hotel) were located in areas be-yond the area predicted by the model as potentially affected by rock falls.
A final model validation was performed by randomly in-specting the distribution of the maps of the rock fall flying height (distance to the ground) and the rock fall maximum velocity in the lower part of the rock fall trajectories (Fig. 8).
6 Rock fall hazard assessment and risk evaluation
Available information on the historical occurrence of rock falls and rock slides, and the map of the count of rock fall trajectories produced by STONE allows the evaluation of the rock fall – rock slide hazard in Yosemite Valley. Considera-tions on the vulnerability to rock falls and rock slides and on the landslide risk to the infrastructure can also be made.
F. Guzzetti et al.: Rockfall hazard and risk assessment 499
Fig. 7. Map of the count of rock fall trajectories prepared by STONE. Original scale 1:24 000. See text for explanation. Circle indicates the
500 F. Guzzetti et al.: Rockfall hazard and risk assessment
B
A
B
A
Fig. 8. Maps of the maximum flying height (a) and of the
maxi-mum rock fall velocity (b) computed by STONE. Darker colours indicate larger flying heights (a) and larger rock fall velocities (b). See dashed rectangle on Fig. 8 for the map of the count of rock fall trajectories.
of rock falls and rock slides are therefore triggered by me-teorological events. This information might prove useful in developing a meteorologically-based landslide warning sys-tem.
Rock falls and rock slides caused damage mostly to roads (117 events) and trails (123 events), and to a lesser extent to utilities (15 events) and other structures (22 events) in the area. Eight events caused 10 fatalities and seven events re-sulted in 20 injured people. About a third of the fatalities and the injured people occurred in one event along the Yosemite Falls trail, on 16 November 1980. The statistics indicate that the most vulnerable elements are roads and trails. Rock fall risk assessment should therefore focus on the analysis of the sections of the roads and the trails most exposed to rock fall hazard. This cannot be done based on the catalogue of histor-ical events because precise information on the location of the landslide events is available only for a very limited number of recent landslides.
Figures 3, 4 and 5 show the temporal distribution of rock falls and rock slides and their frequency-volume statistics for Yosemite Valley. For hazard and risk assessment, Figs. 4
Yosemite Village
N
Curry Village
Glacier Point
Yosemite Village
N
Curry Village
Glacier Point
Fig. 9. Three dimensional view of the rock fall hazard in the eastern
section of the Yosemite Valley. Colours showing rock fall count are
the same as in Fig. 7. Red line is the 22◦ shadow angle line of
Wieczorek et al. (1998). Light brown lines are roads and trails.
and 5 are of particular interest because they show the annual frequency of rock fall volumes, and the expected frequency of landslide volumes in the valley, respectively. As it was stated earlier, the frequency-volume statistics obey a power law fit allowing for the prediction of the expected number (frequency) of large rock failures based on the observed fre-quency of the smallest ones, and vice versa.
The map of the rock fall trajectories shown, at a reduced scale, on Fig. 7 portrays the area of the Yosemite Valley that according to the STONE model can be affected by rock falls. The map shows that 34 km2(in plan) of the Yosemite Valley (i.e. ∼40%) can be affected by rock falls, albeit with dif-ferent frequencies. This value obtained by considering the planar extent of the rock faces and of the valley bottom, con-firms that rock fall processes are widespread in the Yosemite Valley, posing a significant threat.
F. Guzzetti et al.: Rockfall hazard and risk assessment 501
0.7 0.1
4.2 8.7
31.0
25.0
30.2
0.2 0.04 1.3
2.7
9.4 9.7 7.8
0 5 10 15 20 25 30 35
1-2 3-10 11-50 51-100 101-250 251-500 > 500
Classes of rock fall count
Per
centag
e
of
roads
0.7 0.1
4.2 8.7
31.0
25.0
30.2
0.2 0.04 1.3
2.7
9.4 9.7 7.8
0 5 10 15 20 25 30 35
1-2 3-10 11-50 51-100 101-250 251-500 > 500
Classes of rock fall count
Per
centag
e
of
roads
Fig. 10. Percentage of the roads and trails in the Yosemite Valley
potentially affected by rock falls. Solid pattern: percentages con-sidering only the roads and trails intersecting the map of the count of rock fall trajectories prepared by STONE (approximately 52 km). Dashed pattern: percentages considering all the roads and trails in the study area (166.5 km).
The count of rock fall trajectories, a proxy for the fre-quency of occurrence of rock falls, is not the same through-out the study area. Inspection of Figs. 7 and 9 reveals that higher frequency (>500 boulders) occurs along steep chan-nels and drainage lines, confirming the field observation that topography locally controls rock fall trajectories. Figures 7 and 9 also show that on talus deposits and debris cones the frequency of occurrence of rock falls decreases with an in-creasing distance from the base of the rock cliff. At the base of the rock cliffs the frequency remains very high (51–100) to high (11–50), and reduces to moderate (3–10) or low (1–2 boulders) values at the base of the talus deposits and, locally, on the flood plain. This is in good agreement with field obser-vations. Inspection of the maps of the rock fall flying height and the rock fall maximum velocity at the base of the talus deposits reveals that in these areas boulders travel mostly on the ground (i.e. rolling) or very close to the ground at low or very low velocity.
For the Yosemite Valley, Wieczorek et al. (1998; 1999) prepared a rock fall hazard map based on the application of the shadow angle line (Evans and Hungr, 1993). The method is empirical, and identifies the line from which the top of the talus is seen at an angle of 22◦from the valley bottom. This is considered to be the maximum possible extent of rock falls along talus slopes. The angle of 22◦was determined by studying the position of 25 outlying boulder locations and compares well with values cited by Evans and Hungr (1993), particularly for areas with debris flows. In the Yosemite Val-ley Plan (NPS, 2000) only the talus line is addressed as an in-dicator of relative rockfall hazard with the stipulation that fu-ture facilities not be generally planned within the talus area.
A comparison between the hazard zoning based on the shadow angle line (Wieczorek et al., 1998) and the map of
the count of rock fall trajectories produced by STONE is in-structive. Figure 7 portrays the shadow angle line as a dashed red line (also shown as a red line on Fig. 9).
Visual inspection of the map shows that there is good agreement between the 22◦ shadow angle line and the ex-tent of rock falls predicted by STONE, but that the computer model tends to underestimate the extent of the rock fall haz-ard predicted by the empirical approach, i.e. the rock fall hazard extent identified by STONE stops behind (upslope) the 22◦shadow angle line. This occurs on large debris flow fans or talus deposits, where debris flows coexist with or pre-dominate over the rock falls (e.g. at Yosemite Village, NE of Bridalveil Meadow, S of Lower Brother), the computer model is a better representation of the rock fall hazard, than that provided by the shadow angle concept. In places the extent of the rock fall hazard computed by STONE goes be-yond (i.e. further down slope) the shadow angle line (e.g. in Tenaya Canyon, NE of Curry Village, Leidig Meadow, N of El Capitan Meadow). In these areas the empirical approach underestimates the possible extent of the rock fall hazard, and this may represent a dangerous situation. In Tenaya Canyon the simulation performed by STONE appears to better fit the field observations. In the other places detailed analyses are probably required to more accurately determine the real ex-tent of the rock fall hazard.
For the Yosemite National Park a map of roads and trails was available in digital format. The map was originally prepared by digitizing the 1:24 000 topographic maps of Yosemite Falls, Half Dome and El Capitan. It was there-fore possible to perform a preliminary assessment of the rock fall risk to which roads and trails (undistinguished) can suf-fer in the Yosemite Valley. The spatial information on roads and trails was first transformed into raster format, with grid spacing of 10×10 m, consistent with the grid spacing of the original raster input maps (DEM, etc.). The map of the count of the rock fall trajectories was then overlaid in a GIS over the (raster) map of the roads and trails. This simple operation allowed: a) identification of the sections (pixels or strings of pixels) of roads and trails where the rock fall hazard is pre-dicted to be higher; and, b) estimation of the total and the percentage of roads and trails subject to rock fall hazard.
502 F. Guzzetti et al.: Rockfall hazard and risk assessment the actual hazards and the associated risk to people, vehicles,
roads and trails, buildings and other infrastructure.
7 Conclusions
The availability of a detailed catalogue of historical rock falls and rock slides spanning a period of 145 years (from 1857 to 2002) and of a spatially distributed, physically based model of rock fall occurrence, allowed for a better understanding of the hazards and risk posed by rock falls in the Yosemite Valley. Considerations of the temporal frequency of rock falls and of the most common triggering mechanisms (mostly climatic) may prove useful for landslide warning. Analysis of the damage caused by the known historical events shows that roads and trails are particularly vulnerable elements to rock falls. The combined analysis of a spatially distributed rock fall simulation model with the distribution of the roads and trails in the Yosemite Valley identified the sections of the roads and trails that are potentially subject to rock falls. The roads and trails can be classified according to the number of expected rock fall trajectories, considered to be a proxy of the rock fall hazard.
In general, the STONE computer model appears to be a better representation of the rock fall hazard, than that pro-vided by the shadow angle concept. This is mostly because the apex of the fan used for representing the shadow line is somewhat arbitrary and does not well represent all potential rock fall sources, but only those that have produced large talus fans. More generally, we think that where the required thematic information is available in digital format, STONE can be quickly used to test the consistency of rock fall haz-ard zonings based on the shadow angle concept. STONE can also be used to perform new spatially distributed rock fall hazard and risk assessments. This can prove useful in moun-tain areas worldwide.
As a final remark, it is worth pointing out that the work presented here is not a comprehensive evaluation of rock fall risk in Yosemite Valley. The modelling software STONE is unable to consider the volume and mass of the falling boul-der, the shape of the block (e.g. cube, slab, cylinboul-der, disk, irregular), or the tendency of rock falls to split during suc-cessive impacts. We are convinced that these limitations do not impede the rock fall hazard assessment in Yosemite Val-ley, but their local effects remain unknown. The temporal and spatial components of rock fall hazards were ascertained sep-arately and only the potential destructive effects on the roads and trails in the Valley were examined. A comprehensive risk assessment should consider various other aspects, including: a) the effects of rock falls on the population, including the daily and seasonal changes, b) the number of vehicles travel-ling along the roads and the number of people walking or hiking along the trails, and c) the changes occurring with time in the location and extent of the structures and the in-frastructure in Yosemite Valley. Whether the NPS will adopt the computer model as an alternative or as integration to the 22◦shadow angle line or the talus line is unknown. The
em-pirical approach is simpler than the STONE computer model, and some effort will be needed to transfer the new technology to the NPS.
Acknowledgements. We are grateful to J. Godt (USGS) for mak-ing available digital data and maps, to S. Melzner (University of Bonn) for the help in the model calibration, and to G. Crosta and F. Agliardi (University of Milano Bicocca) for assisting with the field work and the discussions. We thank B. Morgan of the USGS and J. Snyder of the NPS for their comments on an early version of the text, and J. Zvelebil and a second anonymous reviewer for their comments. The work was supported by CNR IRPI and CNR GNDCI grants and by the EU project DAMOCLES (UE EVG1-CT-1999-00007). (CNR GNDCI publication no. 2585).
References
Broili, L.: In situ tests for the study of rockfall. Geologia Applicata e Idrogeologia, (in Italian), 8, 1, 105–111, 1973.
Chau, K. T., Wong, R. H. C., and Wu, J. J.: Coefficient of restitution and rotational motions of rockfall impacts, Int. J. Rock Mech. and Min. Sc., 39, 69–77, 2002.
Coe, J. A., Michael, J. A., Crovelli, R. A., and Savage, W. Z.: Preliminary map showing landslide densities, mean re-currence intervals, and exceedance probabilities as determined from historic records, Seattle, Washington, U.S. Geological Sur-vey Open File Report 00-303, http://greenwood.cr.usgs.gov/pub/ open-file-reports/ofr-00-0303/, 2000.
Descouedres, F. and Zimmermann, Th.: Three-dimensional dy-namic calculation of rockfalls, Proceedings 6th International Congress of Rock Mechanics. Montreal, Canada, 337–342, 1987.
Dussage-Peisser, C., Guzzetti, F., and Wieczorek, G. F.: Frequency-volume statistics of rock falls: examples from France, Italy and California: EGS02-A-04053, Geophysical Research Abstracts, Vol. 4, 2002, ISSN 1029-7006, 2002a.
Dussage-Peisser, C., Helmstetter, A., Grasso, J. R., Hantz, D., Desvarreaux, P., Jeannin, M., and Giraud, A.: Probabilistic ap-proach to rock fall hazard assessment: potential of historical data analysis, Nat. Haz. and Earth Sys. Sci., 2, 1–2, 15–26, 2002b. Evans, S. G. and Hungr, O.: The assessment of rockfall hazard at
the base of talus slopes, Can. Geotech. J., 30, 620–636, 1993. Fornaro, M., Peila, P., and Nebbia, M.: Block falls on rock slopes
application of a numerical simulation program to some real cases, in: Proceedings 6th International Congress IAEG, edited by Price, D. G., Amsterdam, Balkema, Rotterdam, 2173–2180, 1990.
Fell, R. and Hartford, D.: Landslide risk management, in: Landslide Risk Assessment, edited by Cruden, D. and Fell, R., Balkema, Rotterdam, 51–109, 1997.
Guzzetti, F., Carrara, A., Cardinali, M., and Reichenbach, P.: Land-slide hazard evaluation: an aid to a sustainable development, Ge-omorphology, 31, 181–216, 1999.
Guzzetti, F., Crosta, G., Detti, R., and Agliardi, F.: STONE: a com-puter program for the three-dimensional simulation of rock-falls, Computers and Geosciences, 28, 9, 1079–1093, 2002a. Guzzetti, F., Malamud, B. D., Turcotte, D. L., and Reichenbach, P.:
Power-law correlations of landslide areas in Central Italy, Earth and Planet. Sc. Let., 195, 169–183, 2002b.
F. Guzzetti et al.: Rockfall hazard and risk assessment 503
Hungr, O., Evans, S. G., and Hazzard, J.: Magnitude and frequency of rock falls and rock slides along the main transportation corri-dors of South Western British Columbia, Can. Geotech. J., 36, 2, 224–238, 1999.
J¨ager, S.: Fallstudien zur Bewertung von Massenbewegungen als geomorphologische Naturgefahr, (in German), Heidelberger Ge-ographische Arbeiten, 108, 151, 1997 .
Jones, C. L., Higgins, J. D., and Andrew, R. D.: Colorado Rockfall Simulation Program Version 4.0. Colorado Department of Trans-portation, Color. Geolog. Surv., March, 127, 2000.
Matthes, F. E.: Geological History of the Yosemite Valley, U.S. Geological Survey Professional Paper 160, 137, 1930.
National Park Service: Yosemite Valley Geologic Hazard Guide-lines, in: Final Yosemite Valley Plan Supplemental Environmen-tal Impact Statement, November 2000, 2, Appendix C, C1–C4, 2000.
Paronuzzi, P. and Artini, E.: Un nuovo programma in ambiente Windows per la modellazione della caduta massi, (in Italian), Geologia Tecnica e Ambientale, 1/99, 13–24, 1999.
Pfeiffer, T. J. and Bowen, T.: Computer simulation of rockfalls, Bul-letin of the Association of Engineering Geologists, 26, 1, 135– 146, 1989.
Pfeiffer, T. J., Higgins, J. D., Schultz, R., and Andrew, R. D.: Col-orado Rockfall Simulation Program Users Manual for Version 2.1, Colorado Department of Transformation, Denver, 127, 1991. Spang, R. M. and Sonser, Th.: Optimized rockfall protection by “ROCKFALL”, Proceedings 8th International Congress Rock Mechanics, 3, 1233–1242, 1995.
Stevens, W.: RocFall: a tool for probabilistic analysis, design of remedial measures and prediction of rockfalls, M.A.Sc. Thesis,
Department of Civil Engineering, University of Toronto. Ontario, Canada, 105, 1998.
Varnes, D. J. and IAEG Commission on Landslides and other Mass-Movements: Landslide hazard zonation, a review of principles and practice, UNESCO Press, Paris, 63, 1984.
Wieczorek, G. F. and J¨ager, S.: Triggering mechanisms and deposi-tional rates of in the Yosemite Valley, California: Geomorphol-ogy, 5, 17–31, 1996.
Wieczorek, G. F., Morrissey, M. M., Iovine, G., and Godt, J.: Rock-fall Hazards in the Yosemite Valley, U.S. Geological Survey Open-file report 98–467, scale 1:12 000, 7, 1998.
Wieczorek, G. F., Morrissey, M. M., Iovine, G., and Godt, J.: Rock-fall potential in the Yosemite Valley, California: U.S. Geological Survey Open File Report 99-578, 1 plate, scale 1:12 000, 7, http://greenwood.cr.usgs.gov/pub/open-file-reports/ ofr-99-0578/, 1999.
Wieczorek, G. F. and Snyder, J. B.: Rock falls from Glacier Point above Camp Curry, Yosemite National Park, California, U.S. Ge-ological Survey Open-file Report 99–385, 13, http://greenwood. cr.usgs.gov/pub/open-file-reports/ofr-99-0385/, 1999.
Wieczorek, G. F., Snyder, J. B., Alger, C. S., and Isaacson, K. A.: Rock falls in Yosemite Valley, California, U.S. Geological Sur-vey Open-File Report 92–387, 38, 1992.