314
Multimode Interference Biosensor Working With
Multiple Wavelengths And Two Polarizations
Moisi Xhoxhi, Partizan Malkaj, Tatjana Mulaj, Alma Dudia, Aurel Ymeti
Abstract: In this paper is presented a new design for Young Interferometer (YI) biosensor and the analysis of output power of a MMI waveguide that will be used in it. The waveguides are simulated with OptiBPM software, which is a Waveguide Optics Modeling software from Optiwave Coorporation. Output power and excess loss is analysed for 15 and 110 planar MMI waveguides for different wavelengths with TE and TM polarization. It is demonstrated that output power decreases exponentially with the increase of the wavelength for both polarizations. The evaluation of the excess loss shows that it is higher for a TM polarized field for all the wavelengths and periodicities considered. Power imbalance seems to have small values suggesting the use of MMI waveguides as good power splitters. A comparison of the excess loss between 15 and 110 MMI waveguides shows that it remains almost the same for both polarizations for the optimum wavelength ( = 647 nm).
Index Terms: biosensor, integrated optics, MMI structures, waveguides, multichannel interferometer, multiple wavelength, two polarizations, virus detection
————————————————————
1
INTRODUCTION
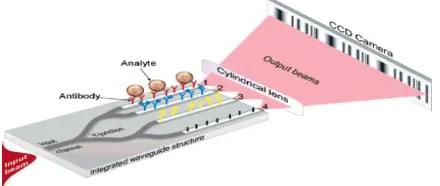
BIOSENSORS are a new technology in medical diagnostics that have had a big impact and have accelerated the investigation in many research fields where the most important is biomedical analysis. They are used to detect and measure the presence of a specific analyte (microorganism or chemical substance that is subject to analysis) in a specific sample (blood, serum, beverage etc) by means of a recognition system. Hundreds of different biosensors exist nowadays depending on their design and working principle. Most of the research in this field until now has been focused on improving their sensitivity, selectivity, and stability, while little research is done to reduce their high cost of production and increase their measurement capacity. In this paper is presented a new design for the integrated optics Young Interferometer (YI)[1] that addresses the two latter issues. The original biosensor, as shown in Fig. 1, is based on Young’s Interferometer (YI) and combines the optical output from four channels to form interference fringes on a CCD camera.
Sensing is accomplished by measuring the shift in phase of the output beams due to the changes in the binding surface. The new design that we propose is composed of two MMI waveguides one after another, as shown in Fig. 2b. This design offers more output channels for simultaneous measurements, in this way increasing its measurement capacity. Because MMI waveguides have
excellent properties as compact size, low loss and large fabrication tolerances [4] they are suitable to be used in biosensors and bioassays to reduce their cost. The main component of the new design is the first MMI waveguide, shown in Fig. 4, which is the subject of our analysis. The thickness of the core layer, height of the channel ridge, thickness of the substrate and cover layer are the same as the Young Interferometer [1]. Table 1 presents all the parameters for the first MMI waveguide. We report on the output power and excess loss when changing different parameters such as wavelength, polarization and periodicity of replicas of the first MMI waveguide because it directly affects the quality of measurements in the biosensor. Fabrication tolerances are independent from the number of output channels, N, but are proportional to the output channel separation [2]. Therefore, when increasing the number of output channels, we expect less fabrication tolerances. Standard splitters based on X- and Y- junction design suffer from high reflection and radiation losses due to branching complexity [3]. On the other hand, there has been a growing intereset in the application of the multimode interference (MMI) waveguides in integrated optics [4], [5], due to their excellent properties and ease of fabrication. They are quite easy to design and are compatible with both weakly guided and strongly guided structures [5].
2
MMI PRINCIPLE AND DESIGN
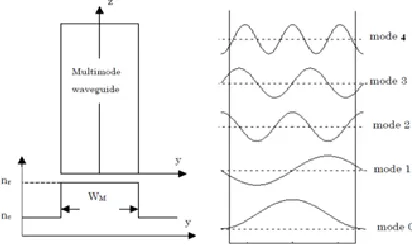
The multimode interference (MMI) effect in multimode waveguides is caused due to the reflecting of the input field in the side walls of the waveguide. This causes a weighted combination of even and odd lateral modes inside the multimode region, which recombine and form single or multiple images of the input field at periodic intervals [4], as shown in Fig. 3. These images can then be coupled to single-mode waveguides at the end of the multimode region to form NN or 1N splitters or cross-couplers. The 1N beam splitters, which are used in the new biosensor design, are obtained by center-feeding the multimode waveguide with a symmetric field profile [4]. In this case, only the even modes are excited in the multimode region and the length of the MMI waveguide will be 4-times shorter if we used general inteferfence [6]. The imaging is obtained by linear combination of the even (symmetrical) modes, and this type of MMI mechanism is called symmetric interference [4].
According to the symmetric interference mechanism, the single images of the input field will be obtained at the multimode section length, L, defined by (1) [4]:
𝐿 = 𝑝 3𝐿𝜋
4 𝑤𝑖𝑡ℎ 𝑝 = 0,1,2 …, (1)
while the N-fold images are obtained at
𝐿 = 𝑝
𝑁 3𝐿𝜋
4 =
𝑝 𝑁
𝑛𝑐𝑊𝑒2
(2)
where L, known as the beat length, is defined by
𝐿𝜋≈ 𝜋 𝛽0−𝛽1=
4𝑛𝑐𝑊𝑒2
3 (3)
Here, 0 and 1 are propagation constants of the fundamental and the first-order lateral modes, respectively, is the free space wavelength, nc is the effective index of the waveguide core, p is the periodicity of replicas, N is the number of output channels and We is the effective width of the multimode waveguide. We can approximate the effective width, We, of the MMI area as:
𝑊𝑒≈ 𝑊 +
𝜋
𝑛 𝑐𝑙 𝑛 𝑐
2𝜎
𝑛𝑐2−𝑛𝑐𝑙2
(4)
where W is the physical width of the MMI area and ncl is the effective cladding index of the MMI waveguide, and integer = 0 for TE modes and = 1 for TM modes [4]. For strongly guided waveguides we get We W [2]. Due to the different values of the integer, there is a difference of the MMI optimal length between TE and TM modes.
3
SIMULATION OF THE FIRST MMI WAVEGUIDE WITH
5 OUTPUT CHANNELS
In our design we consider a MMI splitter based on a ridge structure. Fig. 4 shows a 2D and 3D view of the first MMI waveguide used in the new design, while Table 1 presents the related parameters.
Fig. 2. (a) Layout of the original four-channel YI biosensor. Adapted from ―Development of a Multichannel Integrated Young Interferometer Immunosensor‖by A.Ymeti,2004, ISBN 90-365-2028-2. (b) The new design of the biosensor with two MMI waveguides based on symmetric interference.
Fig. 4. a) Schematic 2D view of the first MMI b) Schematic 3D view of the first MMI
316
TABLE 1 PARAMETERS OF THE FIRST MMI WAVEGUIDE WITH 5
OUTPUT CHANNELS
The wavelengths used in these simulations are: 1. 1 = 0.647 m
2. 2 = 21 = 1.294 m 3. 3 = 31 = 1.941 m 4. 4 = 22 = 41 = 2.588 m
These wavelengths fulfill the condition that for each of them we can have the same number of output replicas without changing the other parameters of the waveguide. The length of MMI waveguide presented in table 1 is calculated from (2) in order to take first periodicity (p = 1) for 1. Equation (2) implies that by maintaining constant the width and length of MMI waveguide, we will take the second, third and fourth periodicity for the output replicas for 2, 3and 4, respectively.
3.1 Analysis of Output Power for TE Polarized
Input Field
This section analyzes output power taken from the simulation of the waveguide in Fig. 4. using TE polarized Gaussian input field. Table 2 shows the wavelengths and the respective period of the replicas in the output channels for this waveguide.
TABLE 2 PERIOD OF REPLICAS AND THE RESPECTIVE
WAVELENGTH
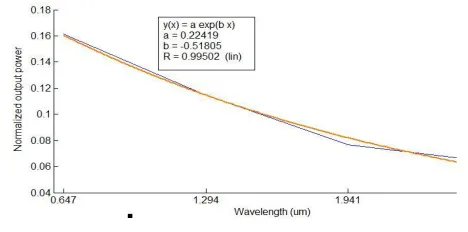
Fig. 5. shows the relationship between output power in channel 1 versus wavelength. Also, in this figure is shown the fitting exponential function of the form y = a exp(bx)
and the corresponding correlation coefficient R. The high value of the correlation coefficient implies that output power in channel 1 decreases exponentially with the increase of the wavelength.
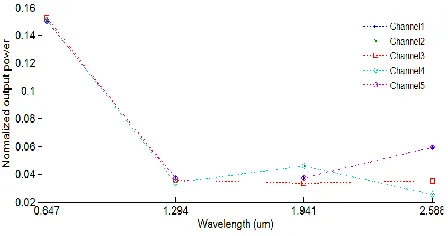
Fig. 6. shows the same relationship between output power and the wavelength used in the simulations for the other channels of the waveguide. Again, we can see that for each of the 5 channels output power decreases exponentially with wavelength. Table 3 shows the parameters a and b of the fitting exponential functions, of the form y = a exp(bx), for each curve and the corresponding correlation coefficients R.
TABLE3 PARAMETERS OF THE EXPONENTIAL FITTING FUNCTIONS FOR TE POLARIZATION
The correlation coefficient’s values in Table 3 move in the range 96.5% - 99.5%, which insinuate an exponential decay of the output power in all the channels of the MMI waveguide with the increase of the wavelength. Fig. 7. shows the field distribution in the multimode section of the waveguide for the 4 different wavelengths considered in these simulations. In these figures we can observe a greater dispersion of the field for higher wavelengths (higher periodicities). Due to the increase of dispersion, the replicas become less accurate and their coupling with the output channels less effective. This causes the reduction of the output power with the increase of the wavelength used. The same thing is observed in Fig. 8., which shows a 3D view of the field distribution in the multimode section of the waveguide.
Fig. 5. Power output in channel 1 vs. Wavelength
Fig. 7. Field distribution for TE polarized field inside the MMI waveguide: (a) 1 = 0.647 m (first periodic interval) , (b) 2 = 1.294 m (second periodic interval), (c) 3 = 1.941 m (third periodic interval), (d) 4 = 2.588 m (fourth periodic interval)
3.2 Analysis of output power for TM polarized input
field
This section analyzes output power of the same MMI waveguide for a TM polarized input field with a Gaussian profile. The relatioship between the output power for each channel versus wavelength, shown in figure 9, is similar to TE polarization. This is approved by the high values of the correlation coefficients for the exponential fitting functions shown in Table 4. Therefore, even for TM polarized input field there is an exponential decrease of output power with the increase of the wavelength.
TABLE 4 PARAMETERS OF THE EXPONENTIAL FITTING
FUNCTIONS FOR TM POLARIZATION
3.3 Comparison of output power between TE and
TM polarized input field
If we compare the output power of the MMI waveguide between TE and TM polarized input field, we can clearly observe that output power for TE polarization is higher than TM polarization, as shown in Fig. 10. This may be due to the lower attenuation and dispersion for TE polarization as we increase periodicity. In addition, the slight difference in MMI width between TE and TM polarization, implied from (4), may be another factor for the lower output power for TM polarization. The higher attenuation for TM polarization is observed even from the values of the b coefficient in Table 4, which have e greater absolute value than those in Table 3.
3.4 Excess loss and Power imbalance for TE and
TM polarization
Practical applications such as optical fibre communication systems usually require optical circuits with low loss and balanced power splitting.. Here we calculate two of the commonly used performance parameters that are more specifically related to MMI devices, excess loss, Le(dB), and power imbalance, Lb(dB) [5]. Excess loss is defined as the logarithmic difference between the sum of the powers in the output channels and the power in the input channel.
𝐿𝑒 𝑑𝐵 = −10𝑙𝑜𝑔10 𝑃𝑗 𝑗/𝑃𝑖𝑛 (5)
where Pjis the power in each output channel for j = 1, 2, 3, …, and Pin is the input power of the waveguide. In the previous paragraphs we showed that output power in MMI waveguides for both polarizations decreases exponentially with the increase of the wavelength. This implies that excess loss will increase with the increase of the wavelength for both polarizations. Table 5 shows the excess loss values for the four wavelengths considered in these simulations for TE and TM polarization.
Fig. 8. 3-D view of the field distribution for a TE polarized field inside the MMI waveguide: (a) 1 = 0.647 m (first periodic interval) , (b) 2 = 1.294m (second periodic interval), (c) 3 = 1.941 m (third periodic interval), (d) 4 = 2.588 m (fourth periodic interval)
Fig. 9. Output power vs. Wavelength for TM polarization
318 Fig. 13. Excess loss for 4 different wavelengths for first periodicity of
replicas
TABLE 5EXCESS LOSS FOR TE AND TM POLARIZATION
Fig. 11. clearly shows that excess loss is greater for a TM polarized field compared to a TE polarized one. If a figure of 1 dB is accepted for the excess loss [7], we can infer from Table 5 that only a TE polarized field with a wavelength = 0.647 nm can be used with this waveguide for application purposes. Power imbalance, Lb(dB),is defined as the logarithmic difference between two of the desired outputs.
Lb dB = −10log10 Pd1/Pd2 (6)
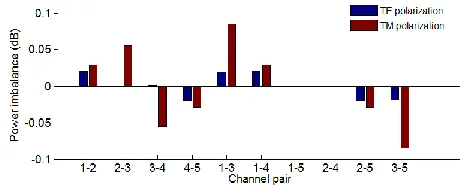
Table 6 shows power imbalance for = 0.647 m, for the 10 different channel pairs of the waveguide with 5 output channels that we simulated.
TABLE 6 POWER IMBALANCE FOR =0.647M
Table 6 shows that power imbalance for all channel pairs has relatively small values for both polarizations. This is especially emphasized for channel pairs 1-5 and 2-4 that are symmetrical in reference to channel 3. Therefore, the MMI waveguide in consideration is working as a good power splitter by offering almost equal power at each output channel. This characteristic makes it suitable to be used in the new design of the biosensor for splitting the input power.
3.5 Excess loss for the first period of replicas for different MMI lengths
Referring to equation (2), we have calculated the length of the MMI waveguide in order to take the first period of replicas for the wavelengths in consideration. Table 7 shows excess loss for these wavelenghths and the respective MMI length.
3.5 Excess loss for the first period of replicas for
different MMI lengths
Referring to (2), we have calculated the length of the MMI waveguide in order to take the first period of replicas for the wavelengths in consideration. Table 7 shows excess loss for these wavelenghths and the respective MMI length.
TABLE 7 EXCESS LOSS FOR DIFFERENT MMI LENGTHS
Again the values show that excess loss is higher for TM polarization. Excess loss is under 1 dB at = 647 nm for TE polarization while for TM polarization excess loss is under 1 dB for = 1.941 m.
4
SIMULATION OF MMI WAVEGUIDE WITH 10 OUTPUT CHANNELSThe parameters of this waveguide are the same with that shown in Fig. 4. except the fact that it has ten output channels. In this case the interdistance between output Fig. 11. Excess loss for TE and TM polarization vs. wavelength
Fig. 14. Excess loss for 3 different wavelengths for TE and TM polarization
Fig. 15. Field distribution for a TE polarized field inside the MMI waveguide: a)1 = 0.3235 m LMMI = 13.91 mm b) 2 = 0.647 m LMMI = 6.955 mm c) 3 = 1.294 m, LMMI = 3.477 mm
Fig. 16. Excess losses for TE polarization for the two MMI devices
Fig. 17. Excess losses for TM polarization for the two MMI devices channels will be lint = We/N = 150m/10 = 15m. The
wavelengths used in the simulations of this waveguide are: 1. 1 = 0.3235 m
2. 2 = 21 = 0.647 m 3. 3 = 22 = 41 = 1.294 m
Table 8 shows the length of the MMI device for each wavelength and the respective excess loss.
TABLE 8 EXCESS LOSS FOR 3 DIFFERENT WAVELENGTHS FOR
TE AND TM POLARIZATION
From the values in Table 8 we can infer that all the three wavelengths can be used for application purposes, if a figure of 1 dB is accepted for the excess loss [7].
5
EXCESS LOSS COMPARISON BETWEEN TWO
MMI
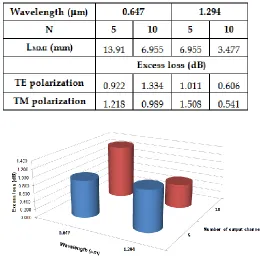
WAVEGUIDES FOR TE AND TM POLARIZATION Let us now compare excess loss between the two MMI waveguides that we have considered so far, with 5 and 10 output channels. The calculations are done for two differentwavelengths in order to take the first periodicity of the replicas in both cases. Table 9 shows the excess loss for TE and TM polarization for these two wavelengths, and the respective MMI length.
TABLE 9 EXCESS LOSS FOR TE AND TM POLARIZATION FOR
TWO MMI WAVEGUIDES
From the values in Table 9 we can infer that excess loss remains almost the same for = 647 nm for both waveguides and polarizations, while for = 1.294 nm excess loss is two to three times higher for the waveguide with 5 output channels for both polarizations.
6
CONCLUSION
320 them more portable. The evaluation of the excess loss and
power imbalance by simulating the first MMI waveguide with OptiBPM software, showed that it offers the best performance as a power splitter by using a TE polarized profile input field with a wavelength of 647nm. To the best of our knowledge, MMI devices have never been investigated for sensing immune reactions, so this design is a novel contribution to the field of optical immunosensing.
REFERENCES
[1] A. Ymeti, "Development of a Multichannel Integrated Young Interferometer Immunosensor," PhD dissertation, MESA+ Inst. for Nanotechnology, Univ. of Twente, Netherlands, 2004. (Thesis).
[2] P. A. Besse, M. Bachmann, H. Melchior, L. B. Soldano, and M. K. Smit, "Optical Bandwidth and Fabrication Tolerances of Multimode Interference Couplers." vol. 12, pp. 1004-1009, Jun. 1994, doi: 10.1109/50.296191, Journal of Lightwave Technology.
[3] H. P. Chan, S. Y. Cheng and P. S. Chung., "Novel design of low-loss wide-angle symmetric Y-branch waveguides." Microwave and Optical Technology Letters, Vol. 11, pp. 87–89, 5 Feb. 1996.
[4] L. B. Soldano, and E. C. M. Pennings, "Optical Multi-Mode Interference Devices Based on Self-Imaging: Principles and Applications" , vol. 13, pp. 615-627,
Journal of Lightwave Technology, Apr. 1995, ISSN: 0733-8724.
[5] L. B. Soldano, F. B. Veerman, M. K. Smit, B. Verbeek, "Planar Monomode Optical Couplers Based on Multimode Interference Effects", vol. 10, pp. 1843-1850, doi: 10.1109/50.202837, Journal of Lightwave Technology..
[6] R. M. Jenkins, R. W. J. Devereux, and J. M. Heaton "Waveguide beam splitters and recombiners based on multimode propagation phenomena.", vol.. 17, pp. 991-993, doi.: 10.1364/OL.17.000991 Optics Letters, 1992,
[7] L. B. Soldano, M. Bachmmann, P. A. Besse, and M.. K. Smit, "Large Optical Bandwidth of InGaAsP/InP Multi-Mode Interference 3-dB Couplers" 6thECIO, Neufchatel, Switzerland, Apr. 1993 (Conference Proceedings).
[8] A. Ymeti, J. Greve, P. V. Lambeck, T. Wink, S. W. F. M. van Hövell, T. A. M. Beumer, R. R. Wijn, R. G. Heideman, V. Subramaniam, and J. S. Kanger, ―Fast, ultrasensitive virus detection using a young interferometer sensor,‖ vol.. 7, no. 2, pp. 394-397, Nano Letters, 2007
[9] E. F. Schipper, R. P .H. Kooyman, R.G. Heideman, and J. Greve. ―Feasibility of optical waveguide immunosensors for pesticide detection: physical aspects‖, Elsevier Science, Vol. 24, pp. 90-93. ISSN:1873-3077,1995, Sensors and Actuators B: Chemical
[10]K. Wörhoff, P. V. Lambeck, H. Albers, O. F.