Research
Paper
*Address for correspondence
E-mail: [email protected]
Accepted 24 October 2019 Revised 23 July 2019 Received 14 April 2019 Indian J Pharm Sci 2019;81(6):1107-1114
This is an open access article distributed under the terms of the Creative Commons Attribution-NonCommercial-ShareAlike 3.0 License, which allows others to remix, tweak, and build upon the work non-commercially, as long as the author is credited and the new creations are licensed under the identical terms
Development of Liquisolid Tablets of Chlorpromazine
using 3
2Full Factorial Design
H. PATEL*, N. GUPTA, SONIA PANDEY AND K. RANCH
Maliba Pharmacy College, Uka Tarsadia University, Gopal Vidyanagar, Maliba campus, Surat-394 350, India
Patel et al.: Chlorpromazine Liquisolid Tablets
The major problem with chlorpromazine, a BCS class II drug, is erratic absorption from gastrointestinal tract, limited aqueous solubility, poor dissolution, and poor bioavailability. The present work is aimed to investigate the use of the liquisolid technique to improve the dissolution of chlorpromazine in a tablet dosage form. The liquisolid tablets were formulated using polyethylene glycol 400 as a liquid vehicle, Avicel PH 200 as a carrier material, Neusilin US2 as a coating material and sodium starch glycolate as a superdisintegrant. The new mathematical model and 32 full factorial design were utilized to formulate various liquisolid tablets. The carrier:coating ratio (X1) and drug concentration (% w/v) in polyethylene glycol 400 (X2) were selected as independent variables whereas, percent cumulative drug release at 30 min (Y1) and disintegration time (Y2) were selected as dependent variables. The results of the evaluation parameters of liquisolid tablets were compared with directly compressed tablet and marketed tablet of chlorpromazine. The optimized tablets with liquisolid compact exhibited acceptable flow properties, weight uniformity, drug content, hardness, friability, and disintegration. Liquisolid tablets showed a higher dissolution rate as compared to a directly compressed tablet and marketed tablet. From the study, it may be concluded that the liquisolid technique is a promising alternative for improving the dissolution property of water-insoluble drugs.
Key words: Carrier:coating ratio, liquisolid tablet, polyethylene glycol 400, liquid load factor
Tablets are the most commonly prescribed pharmaceutical dosage form due to advantages like ease of manufacture and administration, dosage uniformity and stability compared to liquid and semi-solid preparations. The direct compression method is more preferable for tablet manufacturing method due to several advantages over wet granulation and dry granulation. Fewer steps in the manufacturing process, lower labor cost, reduced processing time, higher stability of hygroscopic and thermo-sensitive drugs, optimum tablet disaggregation and less microbiological contamination are more striking features of the direct compression method. However, the direct compression
process is strongly influenced by the properties of the pre-compression powder blend, such as flowability,
compactibility and dilution potential[1-3].
More than 40 % of new chemical entities (NCEs) developed in the pharmaceutical industry are practically insoluble in water. It has been well understood that solubility, dissolution and gastrointestinal permeability are fundamental parameters that control rate and
extent of drug absorption and its bioavailability. BCS class II drugs are poorly water-soluble but highly permeable. Dissolution is the rate-limiting step for in vivo absorption. Many approaches were reported for improving solubility of poorly soluble drugs, which have limited in vivo bioavailability owing to low
dissolution rate in the gastrointestinal fluids following
oral administration. The techniques are chosen based on certain aspects such as properties of the drug under consideration, nature of excipients to be selected, and the nature of the intended dosage form[4-6].
Liquisolid technology is very efficient in the dissolution
November-December 2019 Indian Journal of Pharmaceutical Sciences
concept involved in the liquisolid technology is the use of liquid lipophilic or water-insoluble solid drugs dissolved in non-volatile solvent and conversion of
this liquid into free-flowing, non-adherent, dry-looking
and readily compressible powders with the use of different carrier and coating materials. Owing to the presence of the drug in the form of a liquid, it is in either a solubilized or a molecularly dispersed state. This can provide increased wetting and surface area for dissolution[7,8]. Dissolution rate of prednisolone[9], famotidine[10], valsartan[11], ketoprofen[12], raloxifene hydrochloride[13], clonazepam[14] and clofibrate[15] were enhanced by liquisolid technique.
Chlorpromazine, (3-[(2-chloro-10H-phenothiazine-10yl)propyl]dimethylamine), acts as an antagonist at dopamine (D2) receptors to produce the positive symptoms of schizophrenia, which are associated with hyperdopaminergic neurotransmission in the brain[16]. It is a BCS II drug having high permeability and low solubility[17]. The present study aimed to enhance the dissolution rate of chlorpromazine from tablets using the liquisolid technique. The liquisolid tablets were formulated using polyethylene glycol (PEG) 400, as a liquid vehicle, Avicel PH 200 as a carrier material, Neusilin US2 as a coating material and sodium starch glycolate as a superdisintegrant[8]. A new mathematical model and 32 full factorial design were utilized to formulate various liquisolid tablets. The performance of liquisolid tablets was compared with the conventionally prepared directly compressed tablet and marketed tablet of chlorpromazine.
MATERIALS AND METHODS
Chlorpromazine was purchased from Balaji drugs, Surat, India. Microcrystalline cellulose PH 200 was purchased from Signet, Mumbai, India. Neusilin US2 was a gift from Gangwal Chemicals Pvt. Ltd, Mumbai, India. PEG 400, propylene glycol (PG), Span 80, Tween 80 were purchased from Suvidhinath Laboratories,
Baroda, India. Lactose anhydrous was purchased from DFE Pharma, Germany. Sodium starch glycolate, magnesium stearate, and talc were purchased from S. D. Fine Chem Products, Mumbai, India.
Solubility study of chlorpromazine in non-volatile solvents:
The saturated solubility of chlorpromazine in non-volatile solvents like PG, PEG 400, PEG 600 and Tween 20 were determined using the shake flask method[18].
Mathematical calculation of carrier and coating material:
The liquid load factor for PEG 400 liquisolid system was
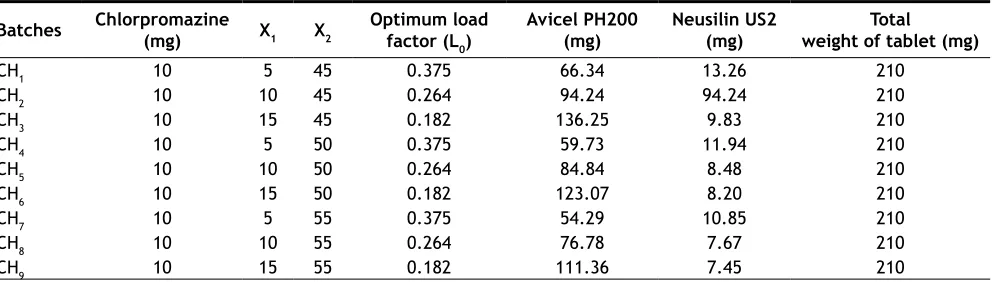
calculated from flowable liquid retention potential and compressible liquid retention potential using R-value. Eqns. 1, 2 and 3 were used to calculate the quantity of carrier and coating material in the formulation batches (Table 1). In the present study, PEG 400, Avicel pH 200 and Neusilin US2 were selected as the non-volatile solvent, carrier material, and coating material, respectively. Flowable liquid-retention potential for Avicel pH 200 and Neusilin US2 was 0.02 and 2.44, respectively[19]. Eqn. 1, L
f = ΦAvicel+ΦNeusilin(1/R), where, Lf is the liquid load factor, ΦAvicel represented the liquid
retention potential of Avicel pH 200 in PEG 400, ΦNeusilin
is the liquid retention potential of Neusilin US2 in PEG 400. Eqn. 2, Lf = W/Q, where, W is the weight of liquid medication and Q is the weight of carrier material. Eqn. 3, R = Q/q, where, q is the weight of coating material and R is the ratio of carrier to the coating material.
Formulation and evaluation of chlorpromazine liquisolid tablets:
Calculated quantities of chlorpromazine and PEG 400 (Table 1) were accurately weighed in a 20-ml glass beaker and sonicated at controlled temperature (80 to 90°) until a homogenous solution was obtained. The
Batches Chlorpromazine(mg) X1 X2 Optimum load factor (L
0)
Avicel PH200
(mg) Neusilin US2(mg) weight of tablet (mg)Total
CH1 10 5 45 0.375 66.34 13.26 210
CH2 10 10 45 0.264 94.24 94.24 210
CH3 10 15 45 0.182 136.25 9.83 210
CH4 10 5 50 0.375 59.73 11.94 210
CH5 10 10 50 0.264 84.84 8.48 210
CH6 10 15 50 0.182 123.07 8.20 210
CH7 10 5 55 0.375 54.29 10.85 210
CH8 10 10 55 0.264 76.78 7.67 210
CH9 10 15 55 0.182 111.36 7.45 210
November-December 2019 Indian Journal of Pharmaceutical Sciences
appropriate amounts of carrier and coating materials used for each formulation depend upon Lf of that formulation. A mixture of Avicel pH 200 and Neusilin US2 was added to the above liquid medication under continuous mixing in a mortar. Sodium starch glycolate was added to the above binary mixture and mixed for a period of 10 to 20 min. Talc and magnesium stearate was added to the mixture and mixed for 2 min. The resulting
liquisolid material was evaluated for flowability and
compressibility. The liquisolid mixture was compressed into a tablet using 8 mm punch and die set in a tablet compression machine. The liquisolid tablets were evaluated for appearance, weight variation, hardness, friability, disintegration time, content uniformity and drug release[20].
Experimental design:
A 2-factor, 3-level (32 factorial) design was used to statistically optimize the formulation parameters and evaluate main effects, interaction effects and quadratic effects of the formulation ingredients on disintegration time and in vitro release of formulations. The non-linear computer-generated quadratic model is given as Eqn. 4, Y = b0+b1X1+b2X2+b12X1X2+b11X12+b
22X22, where, Y is the measured response associated with each factor level combination; b0 is an intercept; b1 to b22 are
regression coefficients computed from the observed
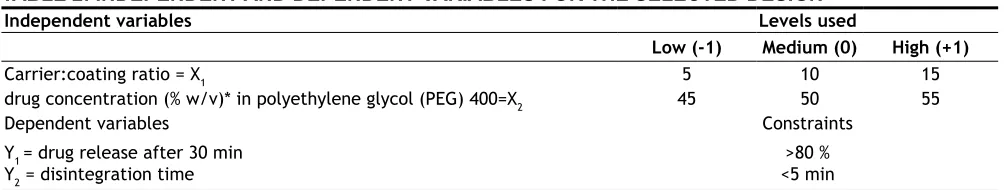
experimental values of Y, and X1 and X2 are the coded levels of independent variables. The terms X1X2 and Xi2 (i = 1, and 2) represent the interaction and quadratic terms, respectively[21]. The dependent and independent variables selected are shown in Table 2 along with their low, medium and high levels. Response analysis was evaluated by Design-Expert software. The levels were selected based on a literature survey and preliminary trials. A design matrix comprising of 9 experimental runs was constructed as shown in Table 3.
Optimization data analysis and optimization model:
The aim of pharmaceutical formulation development is to develop an acceptable formulation in the shortest
period of time using minimum trials. A very efficient
way to enhance the value of research and to minimize the process development time is through the design of the experiment. So for optimization of liquisolid tablets
of chlorpromazine, grid searches were conducted to find
the composition of optimized formulations. Various 2D and 3D response surface graphs were provided by the Design-Expert software. By intensive grid search performed over the whole experimental region, an
optimum formulation was selected which satisfies the
desired criteria for liquisolid formulation[22].
Formulation, evaluation and stability of chlorpromazine liquisolid tablets:
A conventional formulation of chlorpromazine was directly compressed into cylindrical tablets, each containing 10 mg chlorpromazine, Avicel PH 200, Neusilin US2, sodium starch glycolate, talc and magnesium stearate[23]. The resulting blend was
evaluated for flowability and compressibility. The
blend was compressed using 8 mm punch and die set in a compression machine and tablets were evaluated for appearance, weight variation, hardness, friability, disintegration time, content uniformity and drug release. Stability studies of optimized liquisolid tablets (OLS) were conducted as per ICH guidelines[24].
RESULTS AND DISCUSSION
The saturated solubility of chlorpromazine drug powder in different solvents is reported in Table 4. The solubility of chlorpromazine in water was found to be 1.478±0.025 mg/ml, which indicated a slightly soluble category of the drug as per the solubility expressions reported in Indian Pharmacopoeia. Chlorpromazine exhibited the highest solubility in PEG 400 than other solvents hence PEG 400 was selected as a non-volatile solvent for further study. This may be due to the lipophilic nature of the drug. The solubility of the drug is an important physicochemical property as the drug must dissolve in order to be absorbed through membranes and reach the site of action. Solubility
Independent variables Levels used
Low (-1) Medium (0) High (+1)
Carrier:coating ratio = X1 5 10 15
drug concentration (% w/v)* in polyethylene glycol (PEG) 400=X2 45 50 55
Dependent variables Constraints
Y1 = drug release after 30 min
Y2 = disintegration time <5 min>80 %
TABLE 2: INDEPENDENT AND DEPENDENT VARIABLES FOR THE SELECTED DESIGN
November-December 2019 Indian Journal of Pharmaceutical Sciences
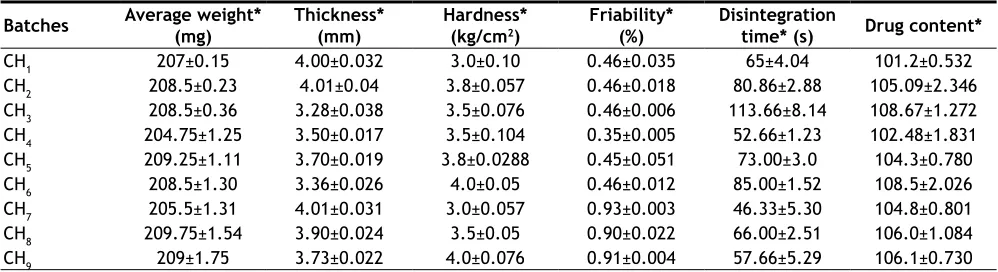
formulations were less than 1 % w/w. All formulations were found to be within USP 32 NF 27 limits as per weight variation test and assay (Table 5). Disintegration time was ranging between 46.33±5.30 to 113.66± 8.14 s. Avicel and sodium starch glycolate accelerated the disintegration of liquisolid compacts and improved the dissolution of the drug. Batch CH7 showed less disintegration time it had more amount (55 %) of non-volatile oil. In vitro drug release profile of all the liquisolid formulations are shown in fig. 1. The release
patterns of all batches showed fast dissolution during
the first 30 min. All batches showed more than 80 %
dissolution in 30 min. Only batch CH9 showed slow release in 30 min. The enhancement in the dissolution rate of chlorpromazine from liquisolid formulation can be increased due to several factors, lack of crystallinity, increased surface area of drug available for release, increased aqueous solubility of chlorpromazine and an improved wettability of chlortpromazine particles. During dissolution studies, the immediate sinking of the particles was noted.
Fitting data to a model was achieved using a two-factor, three-level full factorial statistical experimental design as the response surface method, which required 9 experiments. All responses observed for 9 formulations
(Table 6) prepared were simultaneously fitted to the
quadratic model using Design-Expert software. governs the drug bioavailability, that is, the ability of a
drug to be available in an appropriate concentration at the site of action, independently of the pharmaceutical dosage form and route of administration[25].
Precompression evaluation of liquisolid formulations (CH1 to CH9), the angle of repose, Carr’s index and Hausner’s ratio of all the liquisolid formulations were found to be in the range of 33.86 to 35.33°, 19.14 to 24.00 % and 1.23 to 1.31, respectively which showed
good flowability and compressibility.
Post compression evaluation of liquisolid formulations showed that tablets of all batches (CH1 to CH9)
were white, flat and without any physical defect.
The prepared tablets showed acceptable pharmaco-technical properties (Table 5). For batches CH1 to CH9, hardness values were found to be in the range of 3.0±0.10 to 4.0±0.076 kg/cm2. Friability values of all
X1 X2 X12 X11 X
22
CH1 -1 -1 +1 +1 +1
CH2 -1 0 0 +1 0
CH3 -1 +1 -1 +1 +1
CH4 0 -1 0 0 +1
CH5 0 0 0 0 0
CH6 0 +1 0 0 +1
CH7 +1 -1 -1 +1 +1
CH8 +1 0 0 +1 0
CH9 +1 +1 +1 +1 +1
TABLE 3: 32 FULL FACTORIAL DESIGN MATRIX
WITH INTERACTION TERMS BATCHES
Solvent Solubility*(mg/ml)
PG 106.54±0.548
Water 1.478±0.025
Span 80 81.03±0.591
PEG 400 176.67±1.257
Tween 80 65.22±0.895
TABLE 4: SATURATED SOLUBILITY STUDY IN SOLVENTS
*Mean±SD, n=3
Batches Average weight*(mg) Thickness*(mm) Hardness* (kg/cm2)
Friability*
(%) Disintegration time* (s) Drug content*
CH1 207±0.15 4.00±0.032 3.0±0.10 0.46±0.035 65±4.04 101.2±0.532
CH2 208.5±0.23 4.01±0.04 3.8±0.057 0.46±0.018 80.86±2.88 105.09±2.346
CH3 208.5±0.36 3.28±0.038 3.5±0.076 0.46±0.006 113.66±8.14 108.67±1.272
CH4 204.75±1.25 3.50±0.017 3.5±0.104 0.35±0.005 52.66±1.23 102.48±1.831
CH5 209.25±1.11 3.70±0.019 3.8±0.0288 0.45±0.051 73.00±3.0 104.3±0.780
CH6 208.5±1.30 3.36±0.026 4.0±0.05 0.46±0.012 85.00±1.52 108.5±2.026
CH7 205.5±1.31 4.01±0.031 3.0±0.057 0.93±0.003 46.33±5.30 104.8±0.801
CH8 209.75±1.54 3.90±0.024 3.5±0.05 0.90±0.022 66.00±2.51 106.0±1.084
CH9 209±1.75 3.73±0.022 4.0±0.076 0.91±0.004 57.66±5.29 106.1±0.730
TABLE 5: POST COMPRESSION EVALUATION OF LIQUISOLID TABLETS
*Mean±SD, n=3
Fig. 1: Percent cumulative drug release from batches CH1-CH9
▬●▬ CH1, ▬●▬ CH2, ▬●▬ CH3, ▬●▬ CH4, ▬●▬ CH5,
November-December 2019 Indian Journal of Pharmaceutical Sciences
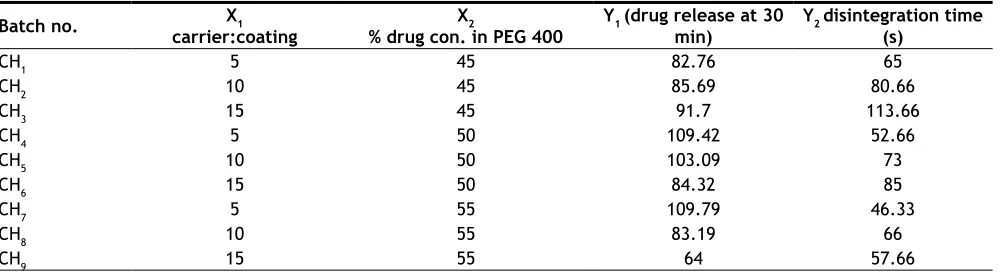
Data analysis of Y1, drug release at 30 min showed that the observed value for all the 9 batches CH1 to CH9 varied from 64.00 to 109.79 % (Table 6). The result indicated that Y1 is strongly affected by the independent variables selected for the study. The response (Y1) obtained at various levels of two independent variables were subjected to multiple regression to give a quadratic polynomial Eqn. 5, Y1 = 99.16-10.325X1-0.528X2 -13.682X1X2-0.325X12-12.755X
22.
The above equation reflected the wide range of values for various coefficients (b). These two variables X1
(p<0.05) and X2 (p<0.05) were found to be significant
in affecting Y1. The negative coefficient value for
independent variable X1 (-10.325) indicated the negative effect on the dependent variable Y1, decreased carrier:coating ratio lead to an increase in drug release.
Negative coefficient value for X2 (-0.528) indicates the negative effect on drug release, i.e. decreased drug concentration in PEG 400 leads to an increase in drug release. X2 has the prominent effect on response. The
model was significant at 5 % confidence level since
p-value was 0.0163 (<0.05). The R2 value was found to be 0.9710. For all the models, the predicted R2 value is in reasonable agreement with the adjusted R2 value. Adequate precision (AP) was 14.240. AP values higher
than 4 for all the responses confirm that all predicted models can be used to navigate the design space defined by the full factorial design. The coefficient of variance
(CV) as the ratio of the standard error of the estimate
to the mean value of the observed response defines
reproducibility of the model. A model normally can be considered reproducible if its % CV is not greater than 10 %. The % CV was found to be 4.57.
Data analysis of Y2 that is disintegration time showed that the observed value of disintegration time for all the 9 batches CH1 to CH9 varied from 46.33 to 113.66 s. The result indicated that Y2 is strongly affected by the independent variables selected for the study. The response (Y2) obtained at various
levels of two independent variables were subjected to multiple regression to give a quadratic polynomial Eqn. 6, Y2 = 72.33+15.388X1-14.888X2-9.332X1X2 -3.168X12+1.331X22.
The above equation reflects the wide range of values of various coefficients (b). These two variables X1
(p<0.05) and X2 (p<0.05) were found to be significant
in affecting Y2. The positive coefficient value for
independent variable X1 (15.388) indicated a positive effect on the dependent variable Y2, increased carrier:coating ratio lead to increase in disintegration
time. Negative coefficient value for independent
variable X2 (-14.888) indicated the negative effect on the dependent variable Y2. As decreased carrier:coating ratio led to an increase in the disintegration time. Both X1 and X2 almost have an equal effect on response. The
model was significant at 5 % confidence level since
p-value was 0.0393 (<0.05). The R2 value was found to be 0.9472. For all the models, the predicted R2 value is in reasonable agreement with the adjusted R2 value. AP was found to be 9.732. AP values higher than 4 for
all the responses confirmed that all predicted models
can be used to navigate the design space defined by
the full factorial design. The % CV was found to be 10.72, which means the model cannot be considered reproducible.
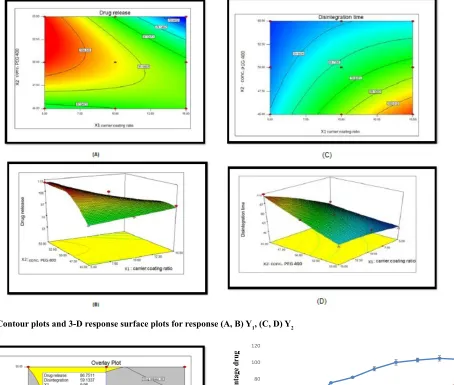
Two-dimensional contour plots and 3-D response surface plots for variables Y1 and Y2 are shown in fig. 2A-D,
respectively. Drug release increased from 64 to 109.79 % with the increasing amount of drug concentration in PEG 400 and increasing carrier:coating ratio. Disintegration time decreased from 113.66 to 46.33 s with the increasing amount of drug concentration in PEG 400 and increasing carrier:coating ratio. All the relationships among the two variables are nonlinear, as shown in the following contour and 3D plots.
The optimal formulation was selected based on the criteria of attaining the constraints of variables response
Batch no. X1
carrier:coating % drug con. in PEG 400X2 Y1 (drug release at 30 min) Y2 disintegration time (s)
CH1 5 45 82.76 65
CH2 10 45 85.69 80.66
CH3 15 45 91.7 113.66
CH4 5 50 109.42 52.66
CH5 10 50 103.09 73
CH6 15 50 84.32 85
CH7 5 55 109.79 46.33
CH8 10 55 83.19 66
CH9 15 55 64 57.66
November-December 2019 Indian Journal of Pharmaceutical Sciences
Fig. 2: Contour plots and 3-D response surface plots for response (A, B) Y1, (C, D) Y2
Fig. 3: Overlay plot
0 20 40 60 80 100 120
0 5 10 15 20 25 30 40 50 60
Cu
m
ul
at
iv
e p
er
ce
nt
ag
e d
ru
g
re
le
as
e
Time(min)
Fig. 4: Drug release profile of OLS, DCS and MT
Drug release profile of optimized liquisolid tablets (OLS, ▬●▬), direct compression tablets (DCS, ▬●▬) and marketed sample (MT, ▬●▬)
Batch Bulk density* (g/cm3) Tapped density* g/cm3) Carr’s index* Hausner’s ratio* Angle of repose*
OLS 0.38±0.011 0.47±0.018 19.14±0.029 1.23±0.01 34.68±1.27
DCT 0.39±0.02 0.5±0.01 22±0.092 1.28±0.019 35.33±1.33
TABLE 7: COMPARISON OF PRE-COMPRESSION EVALUATION OF OLS AND DCT
*Mean±SD, n=3
(drug release after 30 min (Y1): >80 % and disintegration time (Y2): <5 min). Upon trading of various response variables and comprehensive evaluation of feasibility search and exhaustive grid search, the formulation composition with concentration of drug in PEG 400 (54.84 %) and carrier:coating ratio (9.98) were
found to fulfill the desired responses those are optimum drug release after 30 min with good disintegration time
(fig. 3). The results of the precompression evaluation
parameters of the OLS and directly compressible tablets (DCT) are shown in Table 7.
November-December 2019 Indian Journal of Pharmaceutical Sciences
Batch Average weight*(mg) Thickness* (mm) Hardness* (kg/cm3) Friability*(%) Disintegration* time (s) Drug content*(%)
OLS 208.5±2.5 3.8±0.030 3.8±0.04 0.46±0.04 51.30±4.23 104.8±0.064
DCT 209.0±5.45 4.0±0.04 4.0±0.076 0.91±0.053 82.5±5.12 98.9±0.063
Marketed
tablet 100±0.5 2.0±0.01 3.0±0.05 0.28±0.012 108±3.65 102.5±0.36
TABLE 8: POST COMPRESSION EVALUATION OF OLS, DCT AND MARKETED TABLETS
*Mean±SD, n=3; OLS is optimized liquisolid tablets, DCT is directly compressible tablets
parameters of OLS, DCT and marketed tablet (Chlorpromazine 10) are shown in Table 8. The OLS could enhance drug release by more than 80 % in 30 min. The dissolution rate of OLS was higher than
DCT and the marketed tablet of chlorpromazine (fig. 4).
This indicated that the liquisolid technique enhanced the in vitro dissolution of chlorpromazine. The study showed that liquisolid technique could be a promising strategy in improving the dissolution rate of poorly water-soluble drugs and formulating immediate release solid dosage form, which may increase the bioavailability of chlorpromazine in the systemic circulation. The OLS prepared using Avicel PH 200 as carrier material and Neusilin US2 as the coating material and PEG 400 as the non-volatile solvent is effective to enhance the drug
dissolution rate with acceptable flow and compression
characteristics. According to the result of 32 full factorial design, it could be concluded that as drug concentration in PEG 400 decreases and carrier:coating ratio increases drug release was increased. Thus, the liquisolid approach can also be utilized for other BCS class II drugs where dissolution is the rate-limiting step in their absorption.
Acknowledgements:
The authors thank Gangwal chemicals Pvt. Ltd, Mumbai for providing a gift sample of Neusilin US2 for the present research work.
Conflict of interest:
There is no conflict of interest.
Financial support and sponsorship:
Nil.REFERENCES
1. Iqubal MK. Recent advances in direct compression technique for pharmaceutical tablet formulation. IJPRD 2014;6:49-57. 2. Kumar V, Kataria MK, Bilandi A, Kumar S. Recent
Advancements and Developments in Tablet Dosage Form. J Pharm Res 2012;5:5354-62.
3. Jivraj M, Martini LG, Thomson CM. An overview of the different excipients useful for the direct compression of tablets. Pharm Sci Technol Today 2000;3:58-63.
4. Khadka P, Ro J, Kim H, Kim I, Tae J, Kim H, et al.
Pharmaceutical particle technologies : An approach to improve drug solubility, dissolution and bioavailability, Asian J Pharm Sci 2014;9:304-16.
5. Deshmukh S, Avachat A, Garkal A, Khurana N, Cardot J. Optimization of a Dissolution Method in Early Development Based on IVIVC Using Small Animals: Application to a BCS Class II Drug. Dissolut Technol 2016:34-41.
6. Savjani KT, Gajjar AK, Savjani JK. Drug Solubility : Importance and Enhancement Techniques. ISRN Pharm 2012;2012:195727.
7. Karmarkar AB, Gonjari ID, Hosmani AH. Liquisolid technology for dissolution rate enhancement or sustained release. Expert Opin Drug Deliv 2010;7:1227-34.
8. Lu M, Xing H, Jiang J, Chen X, Yang T, Wang D, et al. Liquisolid technique and its applications in pharmaceutics. Asian J Pharm Sci 2017;12:115-23.
9. Spireas A, Srinivas S. Enhancement of prednisolone dissolution properties using liquisolid compacts. Int J Pharm 1998;166:177-88.
10. Fahmy RH, Kassem MA. Enhancement of famotidine dissolution rate through liquisolid tablets formulation: in vitro and in vivo evaluation. Eur J Pharm Biopharm 2008;69:993-1003.
11. Naveen C, Shastri N, Rao R. Use of the liquisolid compact technique for improvement of the dissolution rate of valsartan. Acta Pharm Sin B 2012;2:502-8.
12. Vittal GV, Deveswaran R, Bharath S, Basavaraj B, Madhavan V. Formulation and characterization of ketoprofen liquisolid compacts by Box-Behnken design. Int J Pharm Investig 2012;2:150-6.
13. Komala DR, Janga KY, Jakunti R, Bandari S, Vijayagopal M. Competence of raloxifene hydrochloride loaded liquisolid compacts for improved dissolution and intestinal permeation. J Drug Deliv Sci Technol 2015;30:232-41.
14. Sanka K, Poienti S, Mohd AB, Diwan PV. Improved oral delivery of clonazepam through liquisolid powder compact formulations: in vitro and ex vivo characterization. Powder Technol 2014;256:336-44.
15. Bonthagarala B, Lakshmi Sai PD, Sivaiah KV, Kumar AG, Rao
BN, Dasari V. Enhancement of dissolution rate of clofibrate
(BCS Class – II drug) by using liquisolid compact technology. Int J Biomed Adv Res 2015;6:288-98.
16. Li P, Snyder GL, Vanover KE. Dopamine Targeting Drugs for the Treatment of Schizophrenia: Past, Present and Future. Curr Top Med Chem 2016;16:3385-403.
17. BCS classification [cited 2014 March 13]. Available from:
http://www.ddfint.net/results.cfm.
18. Baka E, Comer JEA, Tak K. Study of equilibrium solubility
measurement by saturation shake-flask method using
November-December 2019 Indian Journal of Pharmaceutical Sciences
19. Spireas S, Inventor. Hygrosol Pharmaceutical Corp, assignee. Liquisolid systems and methods of preparing same. United States patent US6423339B1. 2002.
20. Prajapati ST, Bulchandani HH, Patel DM, Dumaniya SK, Patel CN. Formulation and Evaluation of Liquisolid Compacts for Olmesartan Medoxomil. J Drug Deliv 2013;870579:1-9. 21. Patel H, Patel H, Gohel M, Tiwari S. Dissolution rate
improvement of telmisartan through modified MCC pellets
using 32 full factorial design. Saudi Pharm J 2016;24:579-87. 22. Patel H, Ghayal A, Shah S. Formulation development of
directly compressible co-processed excipient for sustained
release of tramadol hydrochloride. J Pharm Invest 2015;45:51-63.
23. Saigal N, Baboota S, Ahuja A, Ali J. Microcrystalline Cellulose as a Versatile Excipient in Drug Research. J Young Pharm 2009;1:6-12.
24. Stability testing of new drug substances and products. ICH Q1A(R2) [cited 2014 Sep 17]. Available from: https://www.ich. org/fileadmin/Public_Web_Site/ICH_Products/Guidelines/ Quality/Q1A_R2/Step4/Q1A_R2__Guideline.pdf.