www.nat-hazards-earth-syst-sci.net/9/623/2009/ © Author(s) 2009. This work is distributed under the Creative Commons Attribution 3.0 License.
and Earth
System Sciences
A severe blizzard event in Romania – a case study
F. Georgescu, S. Tascu, M. Caian, and D. Banciu
National Meteorological Administration, Bucharest, Romania
Received: 14 November 2008 – Revised: 9 April 2009 – Accepted: 9 April 2009 – Published: 27 April 2009
Abstract. During winter cold strong winds associated with snowfalls are not unusual for South and Southeastern Roma-nia. The episode of 2–4 January 2008 was less usual due to its intensity and persistence. It happened after a long pe-riod (autumn 2006–autumn 2007) of mainly southerly cir-culations inducing warm weather, when the absolute record of the maximum temperature was registered. The impor-tant snowfalls and snowdrifts, leading to a consistent snow layer (up to 100 cm), produced serious transport and electric-ity supply perturbations.
Since this atypical local weather event was not correctly represented by the operational numerical forecasts, several cross-comparison numerical simulations were performed to analyze the relative role of the coupler/coupling models and to compare two ways of process-scale uncertainties mitiga-tion: optimizing the forecast range and performing ensemble forecast through the perturbation of the lateral boundary con-ditions. The results underline, for this case, the importance of physical parametrization package on the first place and sec-ondary, the importance of the model horizontal resolution. The resolution increase is beneficial only in the local process representation; on larger scale it may either improve or de-crease the accuracy effect, depending on the specified nudg-ing between large-scale and small-scale information. The event capture is likely to be favored by two elements: a more appropriate time-scale of the event’s physics and the qual-ity of the transmitted large-scale information. Concerning the time scale, the statistics on skill as a function of forecast range are shown to be a useful tool in order to increase the accuracy of the numerical simulations. Ensembles forecast-ing versus resolution increase experiments indicate, for such atypical events, an interesting supply in the forecast accu-racy through the ensemble method when applied to correct the minimum skill of the deterministic forecast.
Correspondence to: S. Tascu ([email protected])
1 Introduction
At polar and temperate latitudes the blizzard is a severe weather event of highest risk, often leading to important damages. Every year Romania experiences at least one bliz-zard episode. Consequently the conditions when it is pro-duced and its characteristics were studied by Romanian me-teorologists, many times in connection with the local wind crivatz dynamics (Draghici, 1983, 1984; Cordoneanu et al., 1997; Popa and Soci, 2002).
The blizzard of 1–4 of January 2008 was chosen for the present study due to its severity and to the fact that it occurred after a long period of warm weather. The blizzard affected the southern part of Romania and the north of Bulgaria by considerable snowfalls and snowdrifts that were associated with low visibility; it seriously perturbed the socio-economic activity. For instance, in Bucharest just in twelve hours the snow layer reached seventy centimeters.
An essential condition for generating blizzards is the pres-ence of intense gradients of pressure, and often, temperature. In Western, Northern and Central Europe they are produced at the extremity of very active cyclones, usually developed in the North Atlantic basin, afterward engaged on continental trajectories (Pinto et al., 2007). In these situations the sever-ity of the weather is due to the energetic input of the surface heat fluxes (latent and sensible) contrast between land and ocean.
Fig. 1. The ALADIN model domain (1x=10 km, Lambert con-form projection) and orography (the same color palette as in Fig. 2); the red line indicates the position of the vertical cross section (see Sect. 3.3).
The climatological studies (Maheras et al., 2001) reveal the presence of three cyclogenetic regions in Western, Cen-tral and Eastern Mediterranean. The Eastern Mediterranean is in generally a weaker cyclogenetic region (Radinovic, 1965; Alpert et al., 1990) in comparison with the cycloge-netic regions of the Western Mediterranean. Generally, the surface fluxes due to the sea-land contrast contribute to the cyclogenesis process. On the other hand, in winter the orog-raphy plays a major role in the Genoa Gulf cyclogenesis (where the highest number of intense cyclones is registered) while in the Eastern Mediterranean the upper level dynam-ics seems to constitute a dominant feature (Maheras et al., 2002).
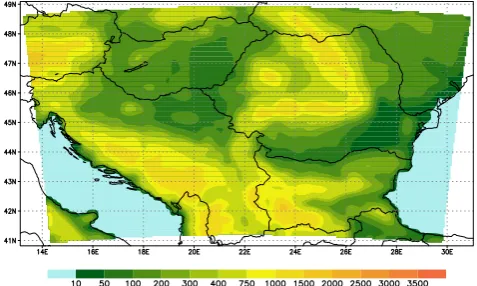
When the generated atmospheric flow in the coupling zone of an anticyclone and a Mediterranean cyclone is a block-ing one, the duration of the blizzard may be of several days (Tayanc¸ et al., 1998). In Romania, besides the large-scale conditions, an important role in the evolution of the phe-nomenon is the orographic forcing induced by the presence and the shape of the Romanian Carpathians (see Fig. 1) and the diabatic one due to the proximity of the Black Sea (Draghici, 1983, 1984).
The data and models used within the paper are shortly pre-sented in Sect. 2 while the analysis of the specific charac-teristics of the blizzard of 1–4 January 2008 is the subject of Sect. 3. Since this atypical local weather event was not correctly represented by the operational numerical prediction models (usually having a good skill), several numerical
sim-Fig. 2. The RegCM3 model domain and orography (in meters on
color bar):1x=10 km, Lambert conform projection.
ulation have been carried out in order to find a solution for a better representation of such an extreme event. They allow us to analyze the sensitivity to coupler/coupled models, fore-cast range, initial and boundary conditions and to compare alternate solutions for uncertainty mitigation through reso-lution increase and ensemble prediction systems (EPS). The experiments organization corresponding to their aim and the obtained results are presented in Sect. 4. Finally, the conclu-sions of this study are summarized in Sect. 5.
2 Data and methods
For the large-scale conditions analysis of this blizzard episode the analysis of the ECMWF (European Center for Medium Range Weather Forecast) deterministic model and the satellite water vapor channel imagery (METEOSAT 9, WV6.2µm channel) have been used. For a more detailed analysis we benefited from the numerical limited area model (LAM) ALADIN (Bubnova et al., 1995; Horanyi et al., 2006) operationally integrated in Romania at a 10 km horizontal resolution (the model domain and orography are presented in Fig. 1). The surface observations (with a quite high den-sity over Romania) complement the information for the case analysis.
For the numerical simulations (explained in detail in Sect. 4) the following models were used:
– The LAM ALADIN coupled either with the IFS/ARPEGE or with the IFS/ECMWF determin-istic global models for short range forecasts. The integration domain (1300×1300 km) covers Romania and its surroundings (Fig. 1).
The development of IFS (ECMWF’s Integrated Forecasting System) was begun in 1987, in collabora-tion with M´et´eo – France. This is the basis of all numerical weather applications at global level in both organizations. Sharing the dynamical and data assimilation structure, the IFS/ECMWF and IFS/ARPEGE models use different physical parametrization packages.
The ALADIN model, developed as a limited area counter part of the IFS/ARPEGE model within an international project (initiated in 1990 by M´et´eo – France which now en-compasses 16 countries, including Romania), was especially designed for mesoscale phenomena simulation. It was built entirely on the notion of compatibility with his “mother” sys-tem ARPEGE (Courtier and Geleyn, 1988), but in a flexible manner, being possible to integrate it at different resolutions and geographical positions. Thus, the high compatibility be-tween the models offers a special framework for the devel-opment and research activities.
The system based on RegCM3 (Giorgi, 1990; Giorgi et al., 1993) coupled with IFS/ECMWF deterministic model or with its EPS (Buizza, 2007) has been developed at the Roma-nian National Meteorological Administration during the last years for medium and long-term applications. It was tuned and tested in research studies over Romania. The system is able to represent multi time-scale physical processes inter-actions, especially those involving the sea surface tempera-ture time-variations with strong impact in winter for Roma-nia (R. Bojariu, personal communication) and in deep-soil hydrology. Those characteristics are absolutely necessary for the representation of the analyzed event in medium range simulations.
For the validation of the models precipitation forecasts for the entire integration domain there were used data from the Romanian observation network (168 synop and 150 rain gauges) and from the GTS – Global Telecommunication Sys-tem (about 115 synop stations). For the graphical representa-tion the precipitarepresenta-tion data were interpolated in a geographical grid (0.2◦×0.2◦).
3 The case analysis
In the evolution of the analyzed blizzard episode four stages were revealed:
– a precursory stage (31 December 2007, 18:00 UTC – 1 January 2008, 06:00 UTC) when the upper air trough extended towards the Central Mediterranean enhancing the continental polar air advection;
– a beginning stage (1 January 2008, 06:00 UTC – 2 Jan-uary 2008, 00:00 UTC) when the snowfalls and wind gusts started to occur more and more frequently; – a maturity stage (2 January 2008, 00:00 UTC – 3
Jan-uary 2008, 12:00 UTC) when the area coverage and the intensity of the phenomenon reached its maximum;
Fig. 3. Mean sea level pressure [hPa] (pressure≤1012 – green,
>1012 – orange isoline) and 850 hPa temperature [◦C] (<0 – blue dashed,≥0 – red isolines), ECMWF analysis: 31 December 2007, 18:00 UTC (a) and 2 January 2008, 00:00 UTC (b).
– the final stage (3 January 2008, 12:00 UTC – 4 January 2008, 06:00 UTC) when the phenomenon gradually ex-tinct.
3.1 The precursory stage
On 31 December 2007, in the lower troposphere a high pres-sure system dominated the most part of Europe. Over the central Mediterranean Sea the pressure had relatively low values (minimum mean sea level pressure values were below 1012.5 hPa; see the green curve south of Italy on Fig. 3a).
(a)
(b)
(c)
Fig. 4. 300 hPa geopotential height [dam] (brick) and temperature
[◦C] (blue dash), ECMWF model analysis: 31 December 2007, 18:00 UTC (a), 2 January 2008, 00:00 UTC (b), 3 January 2008, 00:00 UTC (c).
(a)
(b)
Fig. 5. 500 hPa relative vorticity [10−5s−1], ECMWF model anal-ysis: 31 December 2007, 18:00 UTC (a) and 2 January 2008, 00:00 UTC (b).
3.2 The beginning stage
In the next thirty hours the trough continued to extend to-wards the east of the Mediterranean Sea and the upper level geopotential low, positioned in the previous stage over the Baltic Countries descended over Serbia (Fig. 4b). In this stage high upper level baroclinicity was noticed in the south-west of Romania, where the relative vorticity increased to 12×10−5s−1 (Fig. 5b). The cold air advection on the up-stream side of the trough enhanced the low level cyclonic vorticity as well. Over Romania and Bulgaria there was a sig-nificant humidity supply: in the lower layers from the Black Sea area (Fig. 3b) and in the upper ones, from the Mediter-ranean Sea on the downstream side of the trough (Fig. 4b). The snowfalls appeared in the southwestern part of Romania, where the orographic forcing was important.
3.3 The maturity stage
process, initiated in the first part of the night over the South-western Black Sea basin, was responsible for the trigger-ing of the blizzard on the Southeastern Romania, includtrigger-ing Bucharest.
The analysis of the upper and lower troposphere structure together with the water vapor satellite image patterns led to the recognition of the elements of the cyclogenesis con-ceptual model within the baroclinic trough (Santurette and Georgiev, 2005). The continuous cold air and vorticity ad-vection of the last two days in the upper troposphere deter-mined the generation of a potential vorticity anomaly (values of 6–8 PVU at 300 hPa level – Figs. 4c and 8) over Bulgaria, at the trough base. In the satellite image this anomaly corre-sponds well to the gray zone south of Romania (Fig. 9) while the black band, surrounding it, indicates the polar front jet position. In the same image the moist/cloud area (the nearly white zone southeast of Romania) has the specific “baroclinic leaf” shape and is located just downstream of the potential vorticity anomaly. In the lower troposphere the distinct baro-clinic zone (high gradient of the wet bulb potential temper-ature over the Southwestern Black Sea – Fig. 10) is overrun by the polar front jet, the jet streak being located upstream of this zone.
On the other hand, in the lower layers, the latent heat fluxes from warmer and more humid maritime air mass, in cyclonic twist towards the northwest generate a thermal pos-itive anomaly ahead (Flocas and Karacostas, 1996), deep-ening the surface vortex (see in Fig. 10 the closed low of 1014 hPa over the Black Sea) and sustaining the altitude one. This process of mutual conditioning continued until the end of the day of 3 January, when the advection of polar air mass from the Russian Plain became dominant, breaking the surface-altitude coupling.
The cold air advected by the northeast air flow (Fig. 10) following the Romanian Carpathians intensified the pressure and temperature gradients on the southeastern part of the country, generating a low level jet. The Fig. 11 shows a verti-cal cross section of the ALADIN model analysis on 3 January 2008, 00:00 UTC along a line (the red one in Fig. 1) through the northeasterly low-level jet. Accordingly to this section the low level jet developed within a 1–2 km layer close to the ground, where the wind speed reached 16 m/s (the green area at the figure bottom). The intensity of the blizzard was re-lated to the presence of the low-level jet, which is expressed climatologically as a regional wind called crivatz.
3.4 Final stage
This stage corresponds to the interval when the upper air geopotential low moved eastwards, this time decoupled from the lower troposphere circulation where the cold air was con-tinuously advected over Romania from the Russian Plain (not shown).
Fig. 6. Horizontal wind speed [m/s] vertical cross section along
12.5◦E longitude (the red line from Fig. 7, between 36◦ and 60◦N latitudes), ECMWF model analysis: 31 December 2007, 18:00 UTC.
4 Numerical experiments
The operational LAM ALADIN could represent this weather event only with a six hour anticipation, while the ECMWF global model could indicate it 24 h before, being contradic-tory to the results of both operational ALADIN and of its coupler (ARPEGE) initialized at the same moment. For this reason few numerical experiments have been conducted to assess:
i) The effect of the coupling model for the same limited area model
For this purpose the ALADIN model was coupled with ARPEGE and ECMWF models over the same domain (the operational one) at 10 km. Due to the three models’ config-uration (see Sect. 2), these experiments allow the analysis of the relative role of physics and resolution.
ii.1) The effect of the forecast range (from 1 to 10 days) The RegCM3 model was integrated for 10 days at the same 10 km resolution, being coupled with the ECMWF determin-istic model. These experiments allow the large time-scale processes to develop and impact on event generation and thus, to indicate the best range that reproduces more appro-priately the process.
ii.2) The effects of using a LAM ensemble prediction system
Fig. 7. 300 hPa wind speed [m/s] – color palette and wind vector, ECMWF model analysis: 31 December 2007, 18:00 UTC.
Fig. 8. 300 hPa potential vorticity [PVU] (color palette), ECMWF
model analysis: 3 January 2008, 00:00 UTC.
4.1 Sensitivity to coupling model
Fig. 9. METEOSAT 9, WV 6.2µm channel: 2 January 2008, 21:35 UTC.
generate, despite of its higher resolution, the local main max-imum over central Romanian Southern Plain. This shows that the resolution increase is not sufficient; it only cre-ates/enhances local features when appropriate information transmission function between large-small scale is put to work (as in experiment d) and dump it in the opposite case. It also turns out that this function has to depend on the main physical parametrization hypothesis in order to let the high resolution model extract crucial large-scale information for the process development.
4.2 Uncertainty mitigation
The high-resolution solution accuracy was poor, while differ-ent coupling model physics showed an improvemdiffer-ent of the global solution over the target limited area domain. However this improvement was not transmitted further to the coupled LAM solution. This sub-section is looking for a better so-lution for uncertainty mitigation both in physical process de-velopment representation and in the transmission of coupling information towards the limited area.
Because the non-systematic failures of physical process representation are often connected to non-linear interac-tion and model feedback’ strengths rather than to a given parametrization the first set (ii.1) of experiments aimed to determine a better forecast range for capturing those time-scales needed by the physical process to correctly develop.
On the other hand, the previous results (i) showed the role of the initial and lateral boundary conditions (LBC) in re-producing the event and in conditioning the efficiency of model resolution increase. In the second set – LAM/EPS – the unique LBC was replaced by the different solution of ECMWF/EPS. An additional input expected from this exper-iment would be to see if the approach of ensemble forecast (standing for another way of parametrization of both initial
1018
1022
1022
1026 1026
1030
Fig. 10. Mean sea level pressure [hPa] (black isolines), 925 hPa
wet bulb potential temperature [◦C] (color palette) and 10 m wind, ALADIN model analysis: 3 January 2008, 00:00 UTC.
Fig. 11. Aladin model horizontal wind vertical cross section, along
the line marked on Fig. 1, for 3 January 2008, 00:00 UTC. On the section, Bucharest is in the middle of the line A–B; wind speed [m/s] – color palette and isolines, wind vector – arrows.
(a) ARPEGE model
(b) ECMWF model
(c) ALADIN - ARPEGE
(d) ALADIN - ECMWF
Fig. 12. 24 h cumulated forecast precipitation [mm]: 2 January
2008, 06:00 UTC–3 January 2008, 06:00 UTC of ARPEGE model
(a), ECMWF model (b), ALADIN coupled with ARPEGE model (c), ALADIN coupled with ECMWF model (d).
Fig. 13. Observed 24 h cumulated precipitation [mm], 2 January
2008, 06:00 UTC–3 January 2008, 06:00 UTC.
4.2.1 Sensitivity to forecast range
A first series of experiments has been performed in order to analyze the error growth as a function of forecast range and its possible application to uncertainty estimation for opera-tional and research activities. In all simulations the RegCM3 model was integrated at a 10 km horizontal resolution, over the same domain (see Fig. 2) but started on different days before the interval of interest (i.e. 2–3 January 2008, the blizzard maturity stage). The initial state and boundary con-ditions were provided by the ECMWF deterministic model. The results were compared for different forecast ranges, from 30 to 240 h, all valid for 3 January, 06:00 UTC.
Since the longest RegCM3 forecast was limited to 3 January 2008, 00:00 UTC due to the availability of LBC (ECMWF deterministic model was operationally integrated up to 240 h) for the longer simulations the precipitation was cumulated on a slightly different interval (2 January 2008, 00:00 UTC–3 January 2008, 00:00 UTC) and was compared with the corresponding observation (Fig. 15d). For an eas-ier comparison, Fig. 15 presents only the southern part of the integration domain, where the maximum precipitation amount was registered at 00:00 UTC. One can notice an un-expected improvement of the solution for the 240 h forecast range (Fig. 15c – initial state 24 December 2007, 00:00 UTC) compared to those for 216 and 168 h, respectively (Fig. 15b – initial state 25 December 2007, Fig. 15a – initial state 27 December 2007).
To have more insights into this behavior and to under-stand if this may contain some predictability information connected to the model-intrinsic response, we analyzed the precipitation prediction skill as a function of forecast range for the past winter: 2006–2007. For that cold season, daily 10-day forecasts were already available. The cumulated pre-cipitation over 24 h intervals were compared, for the near-est grid points (10 km-spaced) to observations (A. Enculescu, personal communication).
The normalized (to the maximum value) bias, averaged for the observation points in the southern half of the domain (Fig. 15d), is displayed in Fig. 16. This error growth func-tion shows a minimum skill for the 192 h forecast range (8 days) and a qualitative improvement for the 240 h (10 days) range, in agreement with our case study results (Fig. 15c in comparison with observations in Fig. 15d). It also indicates a steep slope of predictability loss for ranges between 144 and 192 h (six to eight days), which is reproduced by our case study as well. A similar agreement between the 2006–2007 winter bias and the model simulations for the blizzard case is noticed for shorter ranges.
Accordingly to this result the uncertainty of the numer-ical solution studied here seems be strongly related to the modeling-system internal variability, and if so, this might be used when estimating the likely probability of a forecast event development.
This result should be further studied in connection with the evolution of the energy spectrum contained in all motion-scales represented by the model, as well as in connection with observed-spectral distribution (Peixoto and Oort, 1992), in order to understand the predictability “gaps” in that vari-ability. The result should be analyzed for longer time-series in order to assess its statistical significance in both opera-tional work and research.
4.2.2 Ensemble simulation
Since statistically the predictability of the deterministic sim-ulations (10 km resolution) has a rapid decrease for time-scales between six and eight days (in our case the seven days
(a)
(b)
(c)
(d)
(a)
(b)
(c)
(d) Observed precipitation
Fig. 15. Cumulated precipitation [mm] over last 24 h for the
numer-ical experiments based on: 27 December 2007 00:00 UTC (a), 25 December 2007, 00:00 UTC (b), 24 December 2007, 00:00 UTC
(c). All are valid for the 3 January 2008 at 00:00 UTC. The
ob-served precipitation cumulated over the same interval (2 January 2008, 00:00 UTC–3 January 2008, 00:00 UTC) of time is shown in
(d).
Fig. 16. Error growth function dependency on the forecast range.
Fig. 17. Cumulated precipitation [mm] over last 24 h simulated by
RegCM/ECMWF ensemble, based on 27 December 2007, valid for 3 January 2008, 06:00 UTC.
forecast range – 168 h), an ensemble simulation was built by using the REGCM3 model coupled with the first 10 members of the ECMWF/EPS initiated on 27 December 2007 (like in the experiment presented in Fig. 14d). The aim was to ana-lyze the performance of the ensemble solution in filling this longer inertia predictability gap.
The resolution of the ensemble simulation was however decreased (by a factor of 5 with respect to the determinis-tic simulation: 1x=50 km for RegCM3 and1x=125 km for ECMWF) in order to be able to eliminate the models reso-lution when attributing the result to different contributions. The reason was that, if assuming ensemble technique as a sub-grid parametrization concept (Palmer, 1999), the effect of model and LBC resolution increase would be otherwise over-accounted for.
Comparing the deterministic and ensemble simulations for the same forecast range, thus having the same time-scales enabled for physical processes, the differences between them might primarily be attributed to the method itself.
resolution, the precipitation system dynamics improvement (see for comparison in Fig. 14d the deterministic simulation and in Fig. 13 the observed precipitation for comparison). The ensemble solution allows a more realistic diabatic supply from the sea, leading to the system’s further development.
This turned out to be a more complete technique to re-solve spatial scale uncertainty, at a similar computational cost. This solution may be applied regardless the physical “gaps” in the energy spectra of the motions we looked for, at ii.1).
5 Conclusions
The blizzard from 1–4 January 2008 was the meteorological phenomenon with the highest degree of risk throughout the 2007–2008 winter in Romania. The damages and the distur-bance of social and economic activities justify the analysis of this episode.
In the precursory stage and the beginning one, the mo-tion towards the southeast of the deep trough generated in the middle and upper troposphere represented the initiating factor of the phenomenon.
The relative vorticity advection and the potential vorticity anomaly from the highest layers triggered, in the maximum development phase, the cyclogenesis process in the Black Sea. The ground vortex, generating a thermal anomaly, re-activated at its turn the cyclogenesis in the Black Sea and the anomaly of vorticity from the highest levels. The pres-sure and temperature gradients from the Southeastern Ro-mania, generated at the contact between the East-European anticyclone and the cyclonic low above the Black Sea, sub-sequently favored a typical evolution of the blizzard episode, with the formation of low level jet and abundant snowfalls.
The numerical simulations performed in order to assess the main element leading to a better solution indicate that the model physics parametrization appropriateness is, in such mesoscale winter events, more important than the resolution gain. The model resolution might be an element of improve-ment only after the large-scale information is allowed to pass in an optimal nudged way. To sustain this idea, we intend to further perform a series of experiments on the large-scale information transmission for a few coupling models and to establish its relation with the physical packages and pro-cesses involved. The study also emphasized the usefulness of model-specific error growth function, in the prediction of severe weather events.
The ensemble prediction system succeeds, for this case, to cover the lack of accuracy in the less predictable time-scales indicated by the error growth statistical function of the de-terministic forecast. Again, for a same physical package, the main role of LBC was proved. This result finally emphasizes the need to better understand the physical basis of the under-lying mechanism of scale-predictability and to statistically assess error growth behavior for severe mesoscale weather forecast.
Acknowledgements. We want to thank to the two anonymous
reviewers for their constructive comments. Also to our colleague, S. Ioan, for his help in improving the English of the manuscript.
Edited by: A. Loukas
Reviewed by: two anonymous referees
References
Alpert, P. and Reisin, T.: An early winter polar air mass penetration to the eastern Mediterranean, Mon. Wea. Rev., 114, 1411–1418, 1986.
Alpert, P., Neeman, B. U., and Shay-El, Y.: Climatological analysis of Mediterranean cyclones using ECMWF data, Tellus, 42A, 65– 77, 1990.
Bubnova, R., Hello, G., Benard, P., and Geleyn, J.-F.: In-tegration of fully elastic equations cast in the hydrostatic pressure terrain-following coordinate in the framework of the ARPEGE/ALADIN NWP system, Mon. Wea. Rev., 123, 515– 535, 1995.
Buizza, R.: The new ECMWF Variable Resolution Ensemble Pre-diction System, Book of Abstracts of the 3rd HEPEX Workshop, 27–29 June 2007, Stresa, Italy, European Commission EUR228, 19–23, 2007.
Cordoneanu, E., Ivanovici, V., Banciu, D., Dragulanescu, L., and Soci, C.: Severe weather event during the coupling between a Mediterranean cyclone and a north north-easterly anticyclone over Romania, Proceedings INM/WMO international sympo-sium and hazardous weather in the Mediterranean, 14–17 April 1997, Palma de Mallorca, Spain, 771–778, 1997.
Courtier, Ph. and Geyleyn, J.-F.: A global numerical weather pre-diction model with variable resolution: Application to shallow water equations, Q. J. Roy. Meteor. Soc., 114, 1321–1346, 1988. Draghici, I.: A low level-jet east-southest of Carpathians,
Meteorol-ogy and HydrolMeteorol-ogy, 1, 3–8, 1983.
Draghici, I.: Black Sea coastal frontogenesis, Nowcasting II Sym-posium, Norrkoping, Sweden, ESA-SP 208, 75–79, 1984. Flocas H. A. and Karacostas, T. S.: Cyclogenesis over the Aegean
Sea: Identifications and synoptic categories, Meteor. Appl., 3, 53–61, 1996.
Horanyi, A., Kertesz, S., Kullmann, L., and Radnoti, G.: The ARPEGE/ALADIN mesoscale numerical modeling system and its application at the Hungarian IDOJARAS, Meteorological Service, Quart. Journal of Hungarian Meteorological Service, 110(3–4), 203–227, 2006.
Giorgi, F.: Simulation of regional climate using a limited area model nested in a general circulation model, J. Climate, 3, 941– 963, 1990.
Giorgi, F., Marinucci, M. R., and Bates, G. T.: Development of a second generation regional climate model (regcm2): Bound-ary layer and radiative transfer processes, Mon. Wea. Rev., 121, 2794–2813, 1993.
Maheras, P., Flocas, H. A., Patrikas, I., and Anagnostopoulou, Chr.: A 40 year objective climatology of surface cyclones in the Mediterranean region: spatial and temporal distribution, Int. J. Climatol., 21, 109–130, 2001.
Popa, F. and Soci, C.: M´ethode classique et actuelle d’analyse d’une tempˆete de neige, Rev. Roum. de Geographie, 45–46, 177–186, 2002.
![Fig. 3. Mean sea level pressure [hPa] (pressure18:00 UTCdashed,> ≤1012 – green,1012 – orange isoline) and 850 hPa temperature [◦C] (<0 – blue ≥0 – red isolines), ECMWF analysis: 31 December 2007, (a) and 2 January 2008, 00:00 UTC (b).](https://thumb-us.123doks.com/thumbv2/123dok_us/8433109.1388017/3.595.307.549.63.407/pressure-pressure-utcdashed-temperature-isolines-analysis-december-january.webp)
![Fig. 4. 300 hPa geopotential height [dam] (brick) and temperature00:00 UTC[◦C] (blue dash), ECMWF model analysis: 31 December 2007,18:00 UTC (a), 2 January 2008, 00:00 UTC (b), 3 January 2008, (c).](https://thumb-us.123doks.com/thumbv2/123dok_us/8433109.1388017/4.595.309.546.62.402/geopotential-height-temperature-ecmwf-analysis-december-january-january.webp)
![Fig. 6. Horizontal wind speed [m/s] vertical cross section along12.5◦ E longitude (the red line from Fig](https://thumb-us.123doks.com/thumbv2/123dok_us/8433109.1388017/5.595.311.546.63.228/fig-horizontal-speed-vertical-cross-section-along-longitude.webp)


![Fig. 12. 24 h cumulated forecast precipitation [mm]: 2 January(c)2008, 06:00 UTC–3 January 2008, 06:00 UTC of ARPEGE model(a), ECMWF model (b), ALADIN coupled with ARPEGE model, ALADIN coupled with ECMWF model (d).](https://thumb-us.123doks.com/thumbv2/123dok_us/8433109.1388017/8.595.56.278.63.613/cumulated-forecast-precipitation-january-january-arpege-aladin-arpege.webp)
![Fig. 14. RegCM3 (174 h�x=10 km) last 24 h cumulated precipitation[mm] for different forecast ranges: 30 h (a), 54 h (b), 126 h (c) and (d), valid at 3 January 2008, 06:00 UTC.](https://thumb-us.123doks.com/thumbv2/123dok_us/8433109.1388017/9.595.324.531.59.641/regcm-cumulated-precipitation-different-forecast-ranges-valid-january.webp)

